

Eloi_Omella/E+ via Getty Images
Dear Investors,
2022 was another year of unusual global events with the war in Ukraine. Globally most equity markets declined including the Nikkei Index. Our Japan capital appreciation strategy returned -5.5% net of fees. The iShares MSCI Japan ETF (EWJ) returned -17.7%.
Since 2017, we have offered this strategy which is solely focused on Japanese public equities. In this portfolio, we take more of a quantitative approach. We construct a diversified portfolio of up to 30 positions. These companies are modestly growing revenues with good profitability, attractively valued on an absolute and relative basis, most companies have significant net cash on their balance sheets and pay an attractive growing dividend.
2022 Performance
Detractors: The biggest detractor from performance was the decline in the Yen against the USD. In January 2021, the rate was 103 Yen to 1 USD, which has been roughly the average exchange rate for the last 30 years. In Jan 2022, the rate hovered around 115 to 1 and then the exchange rate skyrocketed to a high of 150 to 1, before settling back down to 131 to 1. This cost 5% in performance.
Winners: Equities as a group contributed about 0.6%
Portfolio Composition (Jan 28, 2023): Top 10 Positions (41% of account)
|
Company |
Weight |
P/E |
EV/EBIT |
ROE |
Yield |
Cash % MCap |
|
JFE Systems (OTC:JFEYF) |
5.2% |
9.3 |
3.6 |
17% |
3.7% |
43% |
|
Business Brain Showa |
5.2% |
12.1 |
5.5 |
14% |
2.5% |
24% |
|
KSK Co |
4.9% |
8.1 |
2.7 |
12% |
3.5% |
55% |
|
System Research |
4.4% |
12.3 |
5.4 |
19% |
2.8% |
27% |
|
Kaga Electronics |
4.2% |
5.2 |
3.8 |
15% |
5.1% |
– |
|
Nippon Pillar Packing (OTCPK:NLLRF) |
4% |
7.9 |
5.4 |
17% |
3.9% |
3% |
|
Ryoyu Systems |
3.8% |
8.7 |
5 |
12% |
3.5% |
11% |
|
Yotai Refractories |
3.3% |
9.6 |
5.1 |
9.3% |
2.9% |
25% |
|
DMW Corp |
3% |
6.7 |
1.9 |
9% |
3.9% |
64% |
|
Computer Management |
3% |
8.6 |
1.5 |
14% |
2% |
76% |
As you can see from the table above, the Japanese market is an incredibly rich environment for finding profitable undervalued stocks. Our companies sport rock solid balance sheets (overly conservative in most cases), pay growing dividends and have decent ROE. While the stocks are cheap on PE ratio, they are incredibly attractive on enterprise value to earnings before interest and taxes (EV/EBIT).
So how does value get unlocked in Japan? Over the 6+ years of managing the strategy, we have seen some holdings get acquired by management or another entity. We have seen activists take stakes to shake things up. Management teams are also acting to improve shareholder returns via improving operations as well as increased dividends and share buybacks. Stocks do follow earnings over longer periods of years. Below we present few stock price charts and accompanying table showing progression of EPS and DPS over the years.
JFE Systems: 5 year stock return 101% (plus dividends)
TradingView.com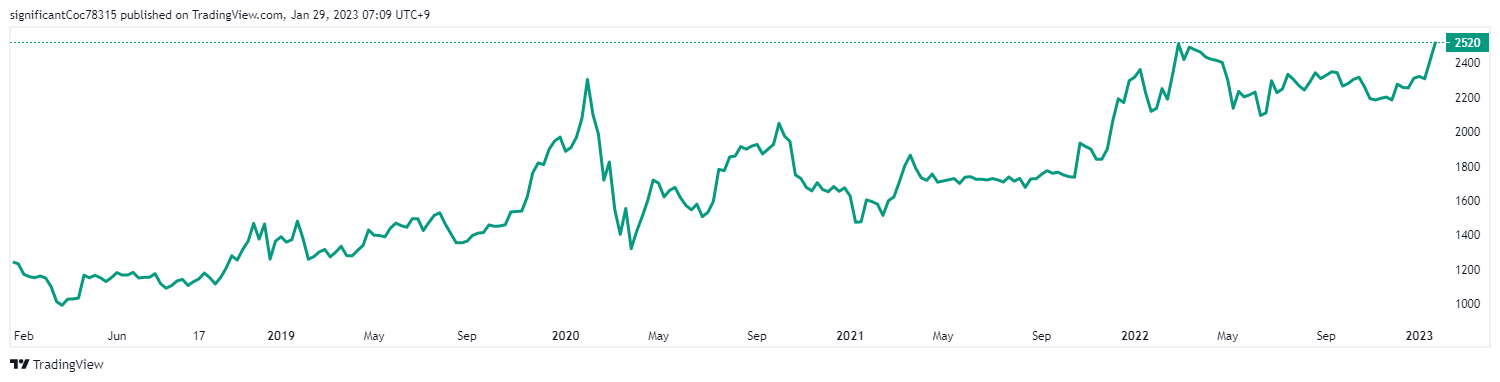
|
Year |
2018 |
2019 |
2020 |
2021 |
TTM |
|
EPS |
148 |
203 |
196 |
237 |
255 |
|
DPS |
42.5 |
60 |
60 |
75 |
90 |
Business Brain Showa: 5 year stock return 129% (plus dividends)
TradingView.com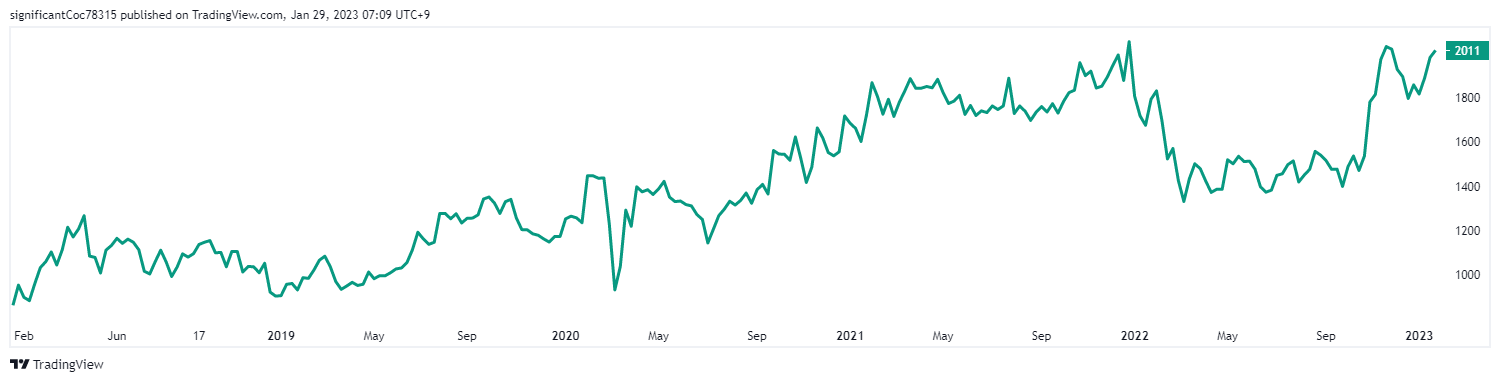
|
Year |
2018 |
2019 |
2020 |
2021 |
TTM |
|
EPS |
110 |
148 |
130 |
179 |
175 |
|
DPS |
30 |
50 |
60 |
60 |
60 |
Yotai Refractories: 5 year stock return 128% (plus dividends)
TradingView.com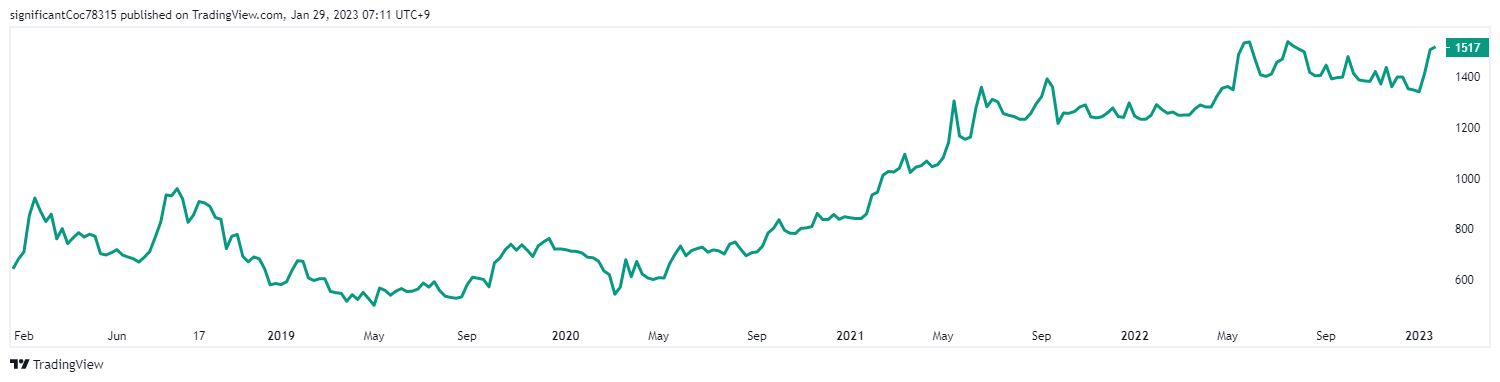
|
Year |
2018 |
2019 |
2020 |
2021 |
TTM |
|
EPS |
164 |
127 |
85 |
141 |
135 |
|
DPS |
15 |
16 |
17 |
43 |
38 |
Example Portfolio holding: Business Brain Showa (BBS) is in the System Integration and BPO business with a 70-30 split. BBS has grown revenues from 20B Yen in 2015 to 35B at the end of H2 2022. Operating profit has increased from 890M to 3B. In the recent presentation, the company outlined targets for 2030 with sales of 100B and operating profit of 10B (3x increase). The ROE has trended down the last couple of years from 17% to 15% and a sale of a subsidiary will further reduce ROE to 12%. BBS has a target ROE of 14% and has announced a 6% share repurchase that will help improve the ROE and shareholder returns. BBS also has implemented a 30% dividend payout policy.
I continue to be excited by the Japan investment opportunity. Thank you for the opportunity to manage a portion of your assets. We will continue to work hard to protect and grow your entrusted capital in 2023 and beyond.
Sincerely,
Adib Motiwala, Portfolio Manager
|
Motiwala Capital LLC is a Registered Investment Advisor. This commentary candidly discusses a number of individual companies. These opinions are current as of the date of this commentary but are subject to change. All information provided is for information purposes only and should not be considered as investment advice or a recommendation to purchase or sell any specific security. While the information presented herein is believed to be reliable, no representations or warranty is made concerning the accuracy of any data presented. This communication may not be reproduced without prior written permission from us. Past performance is no guarantee of future results. Motiwala Capital performance is computed on a before-tax time weighted return (TWR) basis and is net of all paid management fees and brokerage costs. Performance figures are unaudited and generated using our custodian’s reporting functionality. Performance of individual accounts may vary depending on the timing of their investment, the effects of additions, and the impact of withdrawals from their account. |
Be the first to comment