

t_kimura/iStock via Getty Images

Introduction
It’s time to talk about two (related) things. First of all, we have to discuss global agriculture, which has become a hot topic as a result of fertilizer shortages and the war in Ukraine, which made things worse. I will explain why the situation remains extremely tense, providing long-term upside for agriculture commodities and related companies. Hence, my second point of discussion is the Mosaic Company (NYSE:MOS), which has been one of my most successful investments ever after we started buying below $10 in 2020. My most recent Mosaic article was written in April of 2021, which means it’s time for an update as I believe that the current sell-off of more than 40% opens up new opportunities for investors. Mosaic remains in a fantastic spot to benefit from a changing agriculture industry and its valuation does not reflect its potential.
FINVIZ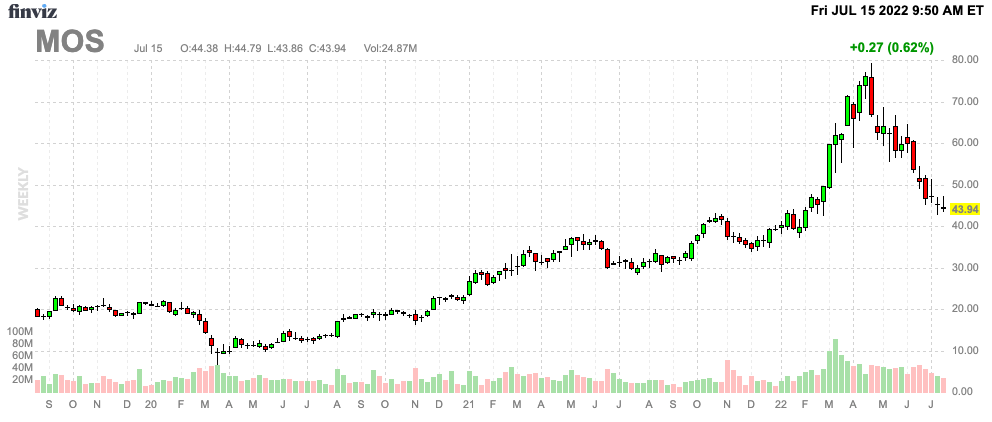
So, without further ado, let’s get to it!
It’s A New Era For Agriculture
Back in 2020, the agriculture bull case was pretty straightforward. Pandemic-related lockdowns had crushed economic output, restaurants were closed, and people stopped going places. Hence, food demand fell (restaurants use way more food than people at home), energy demand imploded (corn and related commodities are key in energy production), and lower demand for chemicals made things worse.
After these lockdowns demand came back, energy prices rebounded and China started to rebuild its hog herds, which required a lot of import grains. Farmers saw higher margins and equipment sales rose. It was a fun time to be bullish as everyone was happy.
Then things changed. The bull case got stronger, but it wasn’t fun anymore to cheer for higher crop prices. After all, we started to discuss a global food crisis as soon as energy prices made fertilizers unaffordable for many.
We are now in a situation that emphasizes the relationship between energy and agriculture. The chart below shows the number one crop in the United States (most planted acres) and the price of WTI crude oil.
CME Group
The correlation is so high because of a number of reasons. First of all, energy is a big driver of crop production costs. It determines the direction of inflation in general, but (in this case natural gas) is also a major feedstock for fertilizer production. As crop prices tend to trade just barely above production costs outside of supply issue spikes, it is no surprise that energy and agriculture are highly connected.
On top of that, corn is a major feedstock for ethanol. Ethanol is an energy commodity. A quarter of corn production is used for ethanol production, and I believe it’s only increasing as the oil supply remains very tight (as explained in this article).
Not only are energy markets doing a number on food security, but the aforementioned geopolitical tensions also make things much worse. According to the Washington Post:
Reduced shipments from Russia and Belarus, which account for nearly 25 percent of global fertilizer exports, have made a market that was tight at the outset of the fighting even tighter. The price of granular urea, the substance that filled the CF Industries warehouse here and the most widely traded fertilizer on global markets, jumped more than 70 percent in the first six weeks of the war.
[…] Russia and neighboring Belarus are major sources of nitrogen fertilizers, like those produced by CF Industries, as well as phosphate and potassium products that use minerals from surface and underground mines. Ukraine is a relatively minor fertilizer producer. But it relied on Russia and Belarus for much of its needs and future deliveries are now in jeopardy, casting a cloud over next year’s harvest.
And, to make things worse, the WaPo also made clear that things aren’t looking better after 2022:
“The global outlook for 2023 may be even more dire. As the Russia-Ukraine war continues and the supply of fertilizer remains limited, high prices are likely to have a more profound impact on 2023 planting decisions,” the department’s Foreign Agricultural Service concluded in a report last month.
Russia and Ukraine control 30% of the world’s wheat exports. Ukraine alone exports 10% of global corn. Almost all of its wheat and corn is exported via the Black Sea, which is entirely controlled by Russia’s Navy.
With that said CBOT NOLA DAP futures have lost 22% from their recent highs but continue to trade at very elevated prices. NOLA DAP is a fertilizer known as Di-ammonium phosphate, which contains nitrogen and phosphorus. I use it as a benchmark for fertilizer prices.
I believe that fertilizer prices have come down as a result of investors who started pricing in a recession. It hurt energy prices and triggered profit-taking in “hot” sectors and industries.
TradingView (NOLA DAP)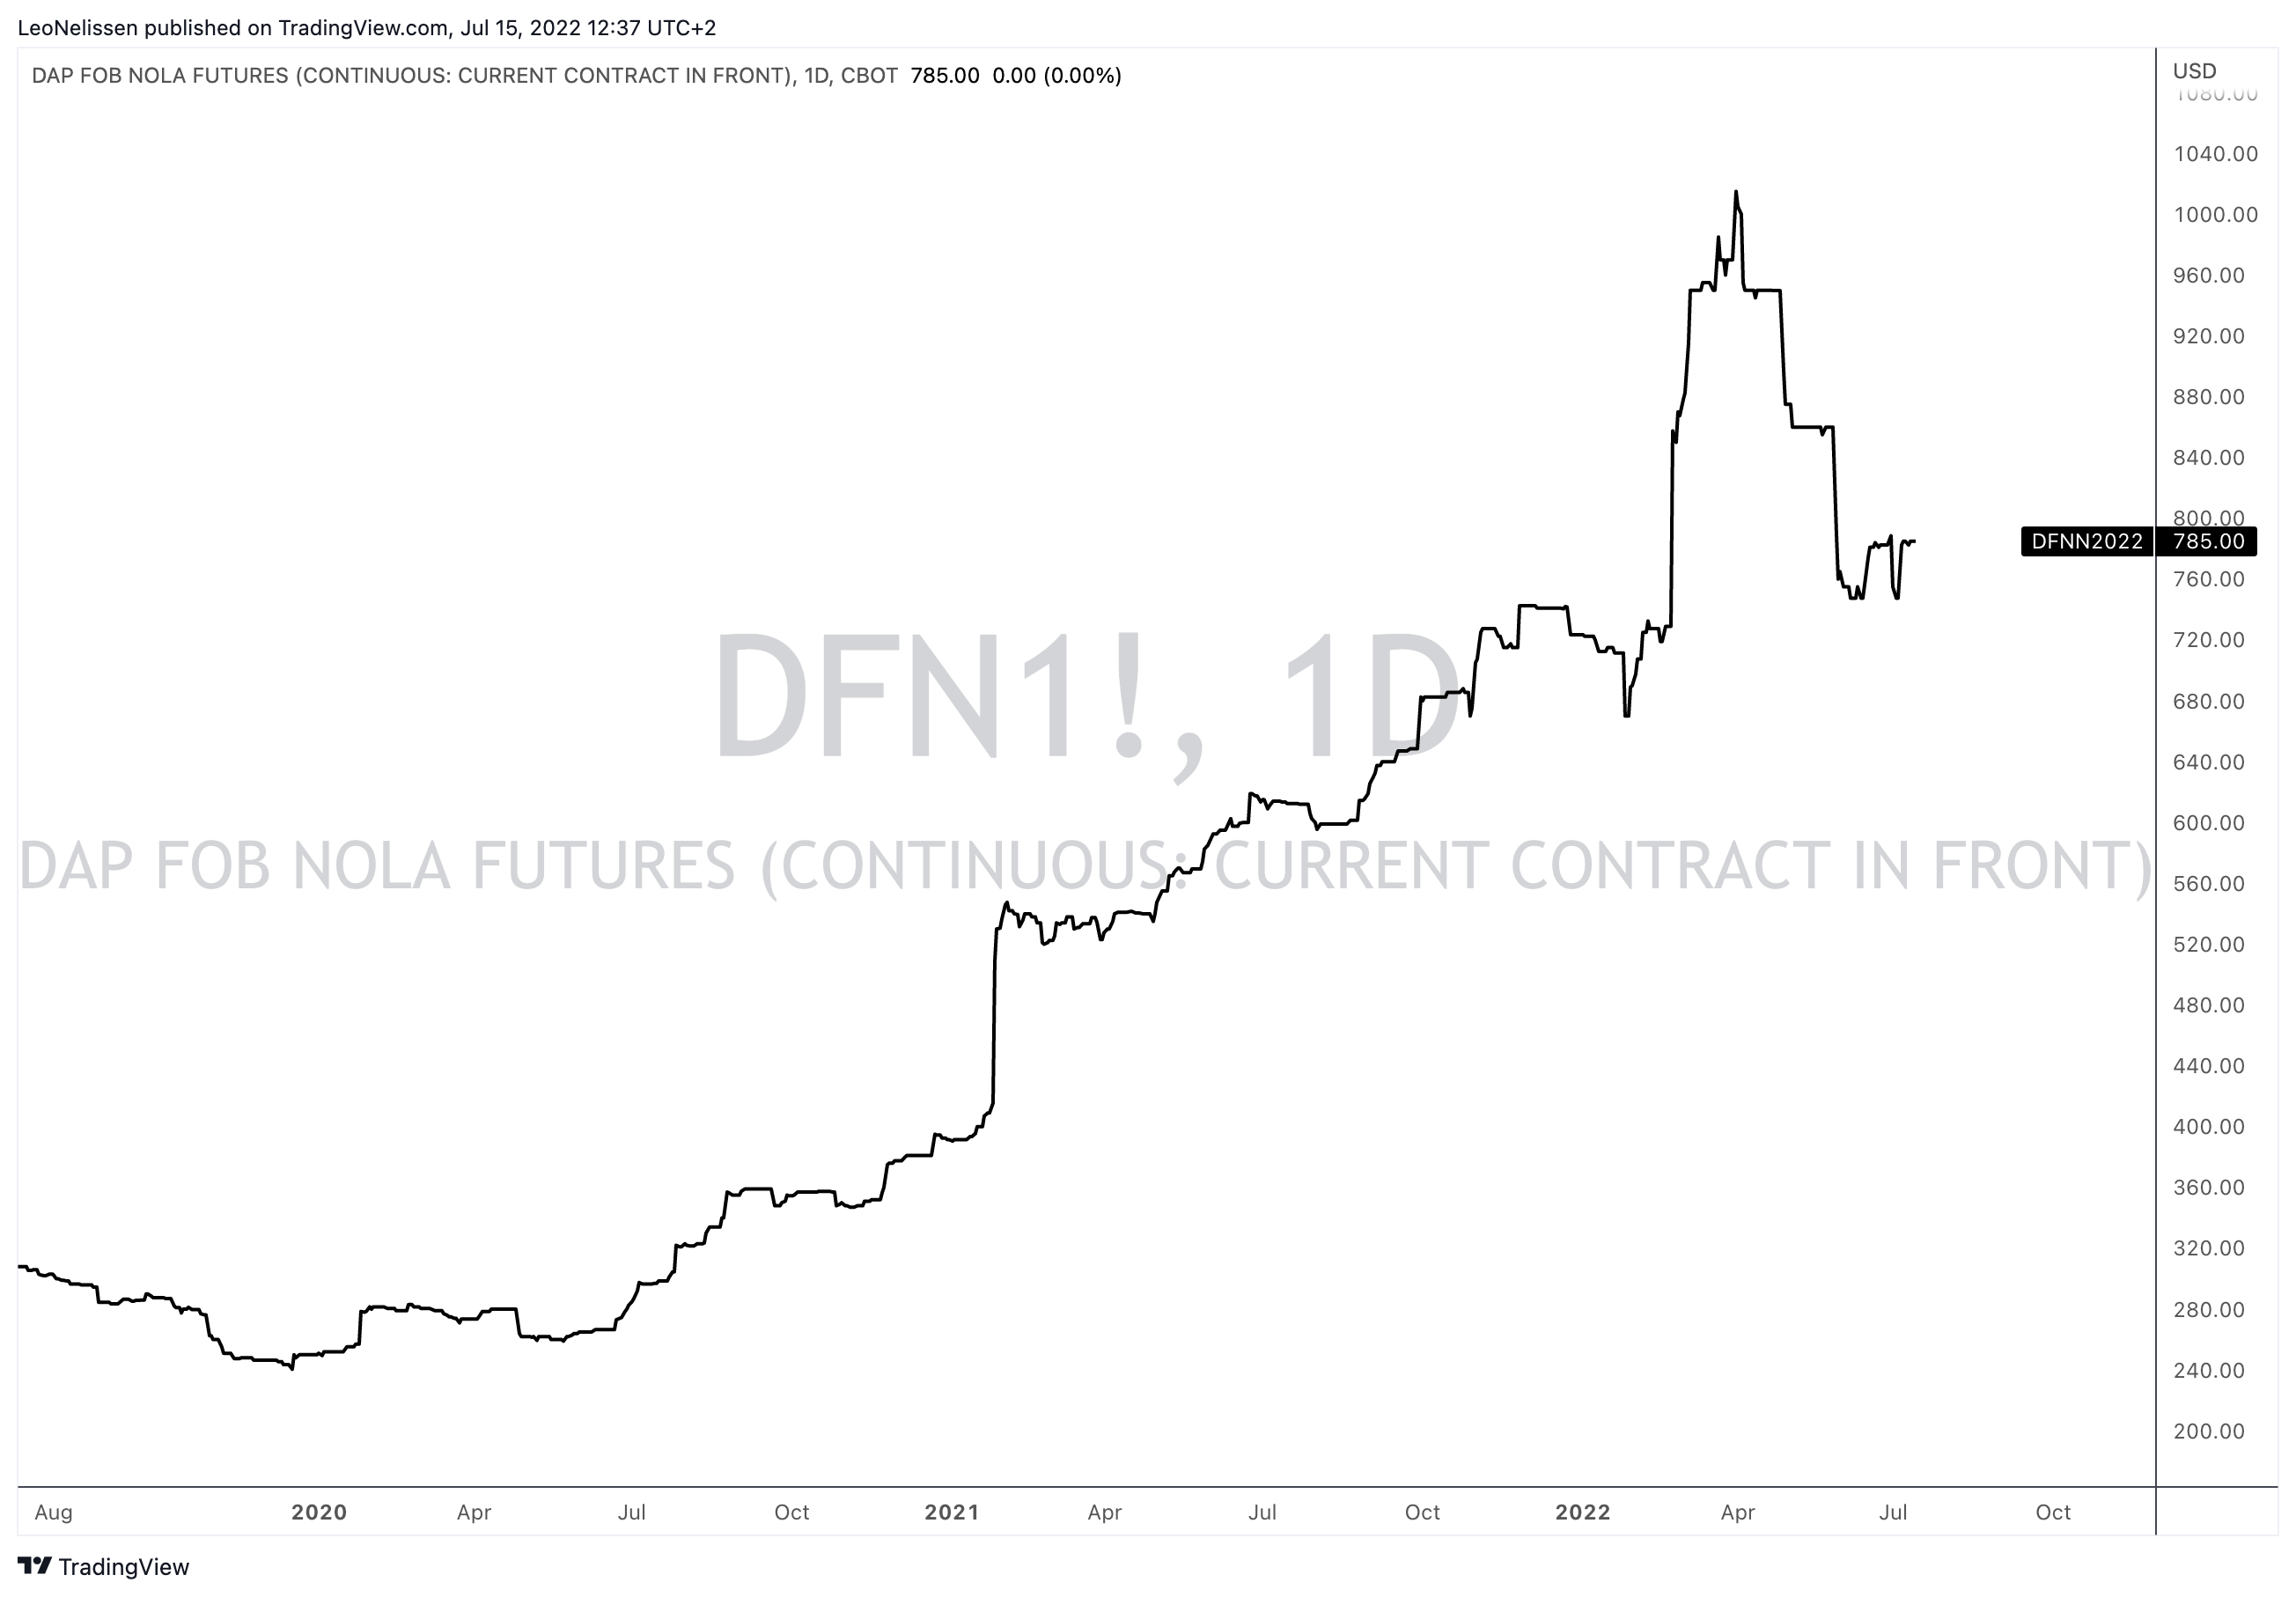
The other day, I read a report that highlighted long-term risks facing agriculture markets – in this case, inflationary risks benefiting crop and fertilizer prices.
For example, between 2000 and 2020, the global coarse grain (cereal grains except for wheat and rice) production rose by 42%. I used the corn production chart below as a proxy. During this period, fertilizer application rose by 40%. On a shorter-term basis, the same relationship holds. Between 2010 and 2020, global grain production rose by 18%. Fertilizer application rose by 17%.
CME Group
We’re now in a situation where the world is facing two problems.
Problem 1: Less available arable land
Earlier this month, I shared the following chart on Twitter, which shows that available agricultural land per capita has been in a decline for decades.
Our World In Data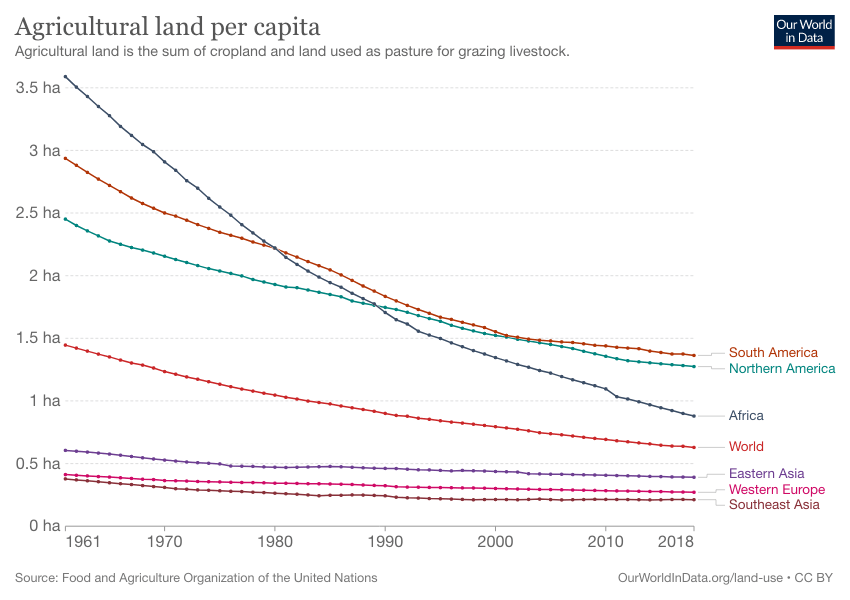
In other words, while the global population is growing, available land is falling. This means one thing: more efficient operations are needed.
Fertilizer application is key here, which brings us to…
… Problem 2: Less available fertilizers
While farmers in industrial nations can, technically speaking, afford higher fertilizer prices, the biggest issue is availability. Nitrogen production, driven by production cuts in Europe, is down 5%. This has mainly to do with the fact that sky-high energy prices have made production unprofitable.
European natural gas prices are almost 8x more expensive than US-based Henry Hub. Prior to the energy crisis, that number used to be 2.0x. On a side note, this is a huge benefit for North American producers like Mosaic who gain competitive advantages over foreign producers.
TradingView (TTE vs. Henry Hub Ratio)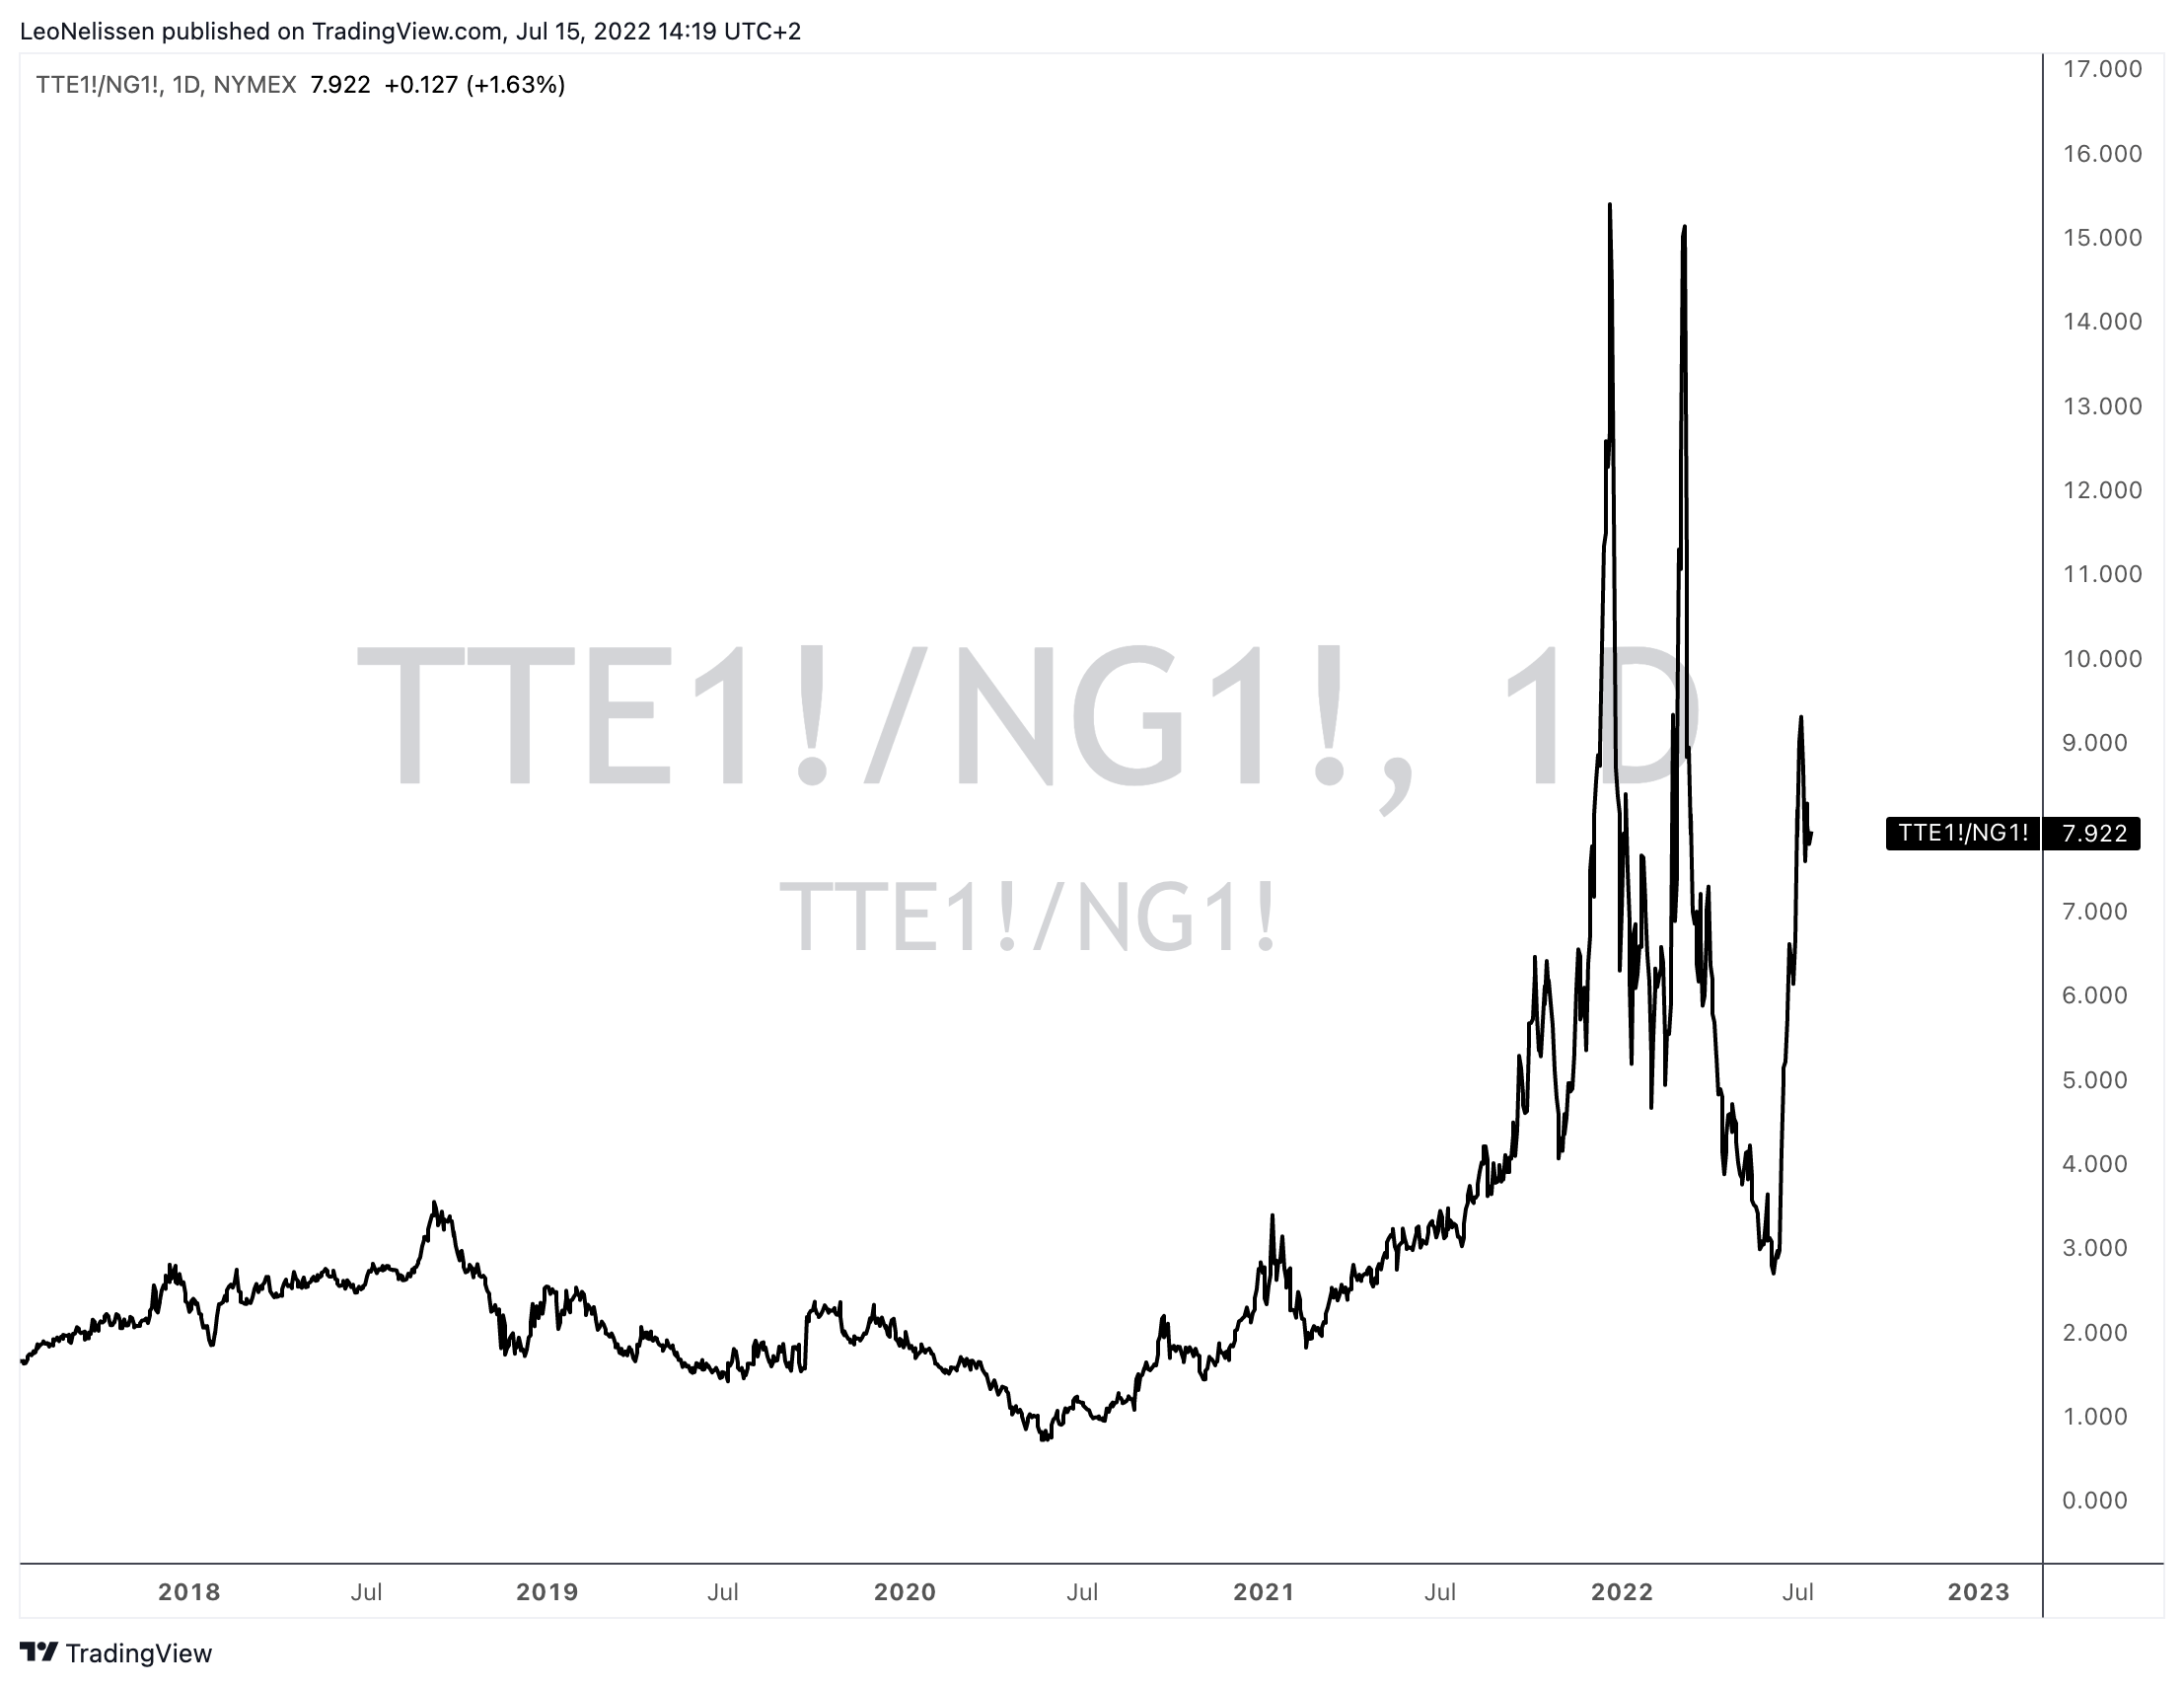
Going back to fertilizer supply, Russia produces 30% of total nitrogen exports. That’s roughly 7 million tonnes. It’s unclear what Russia is planning. One thing is for sure, it has significant leverage thanks to a massive footprint in both energy and agriculture.
With that said, Goehring & Rozencwajg estimates that…
… a 5% reduction in nitrogen application could result in an immediate 1 to 2% reduction in global grain supply. Given the existing tightness, such a drop will have an outsized impact on supply-demand balances going into the 2022-2023 planting season. For example, the International Rice Research Institute predicts rice yields could drop as much as 10% this season, causing a loss of 36 million tonnes or 7% drop of world rise supply. The lost rice production would be enough to feed 500 mm people.
Furthermore, a 20% cut in potash application could decrease the size of the next Brazilian soybean crop by 14%.
It also doesn’t help that a big part of the US will experience high temperatures this month with below-average precipitation.
USDA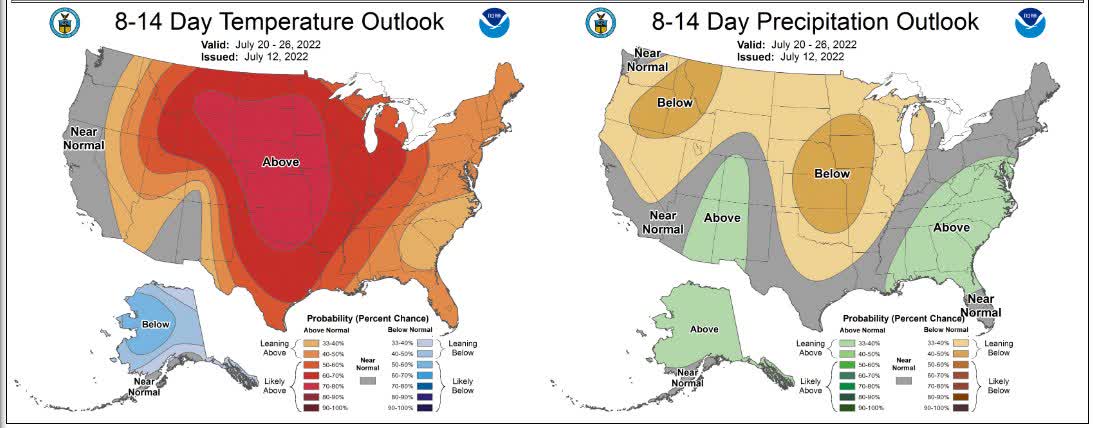
So far, roughly a quarter of US corn is experiencing drought, which I believe will have a significant impact on yield estimates in the weeks ahead.
Here’s Why That Makes Mosaic Attractive
With a market cap of $15.8 billion, Mosaic is one of the world’s largest fertilizer producers. Located in Tampa, Florida, the company has become the world’s leading producer and marketer of concentrated phosphate and potash nutrients. In 2021, the company generated 40% of its sales from phosphates, 21% from potash, and 41% from its business in Brazil, Mosaic Fertilizantes.
The company produces 12% of the world’s phosphate supply as well as 12% of global potash production.
Potash is mainly produced in Canada. Phosphates are produced in Florida. Fertilizantes produces both fertilizers in South and East Brazil.
In its first quarter of 2022, the company confirmed what I just explained in the first part of this article. Unfilled demand is high, putting a floor under fertilizer prices.
Mosaic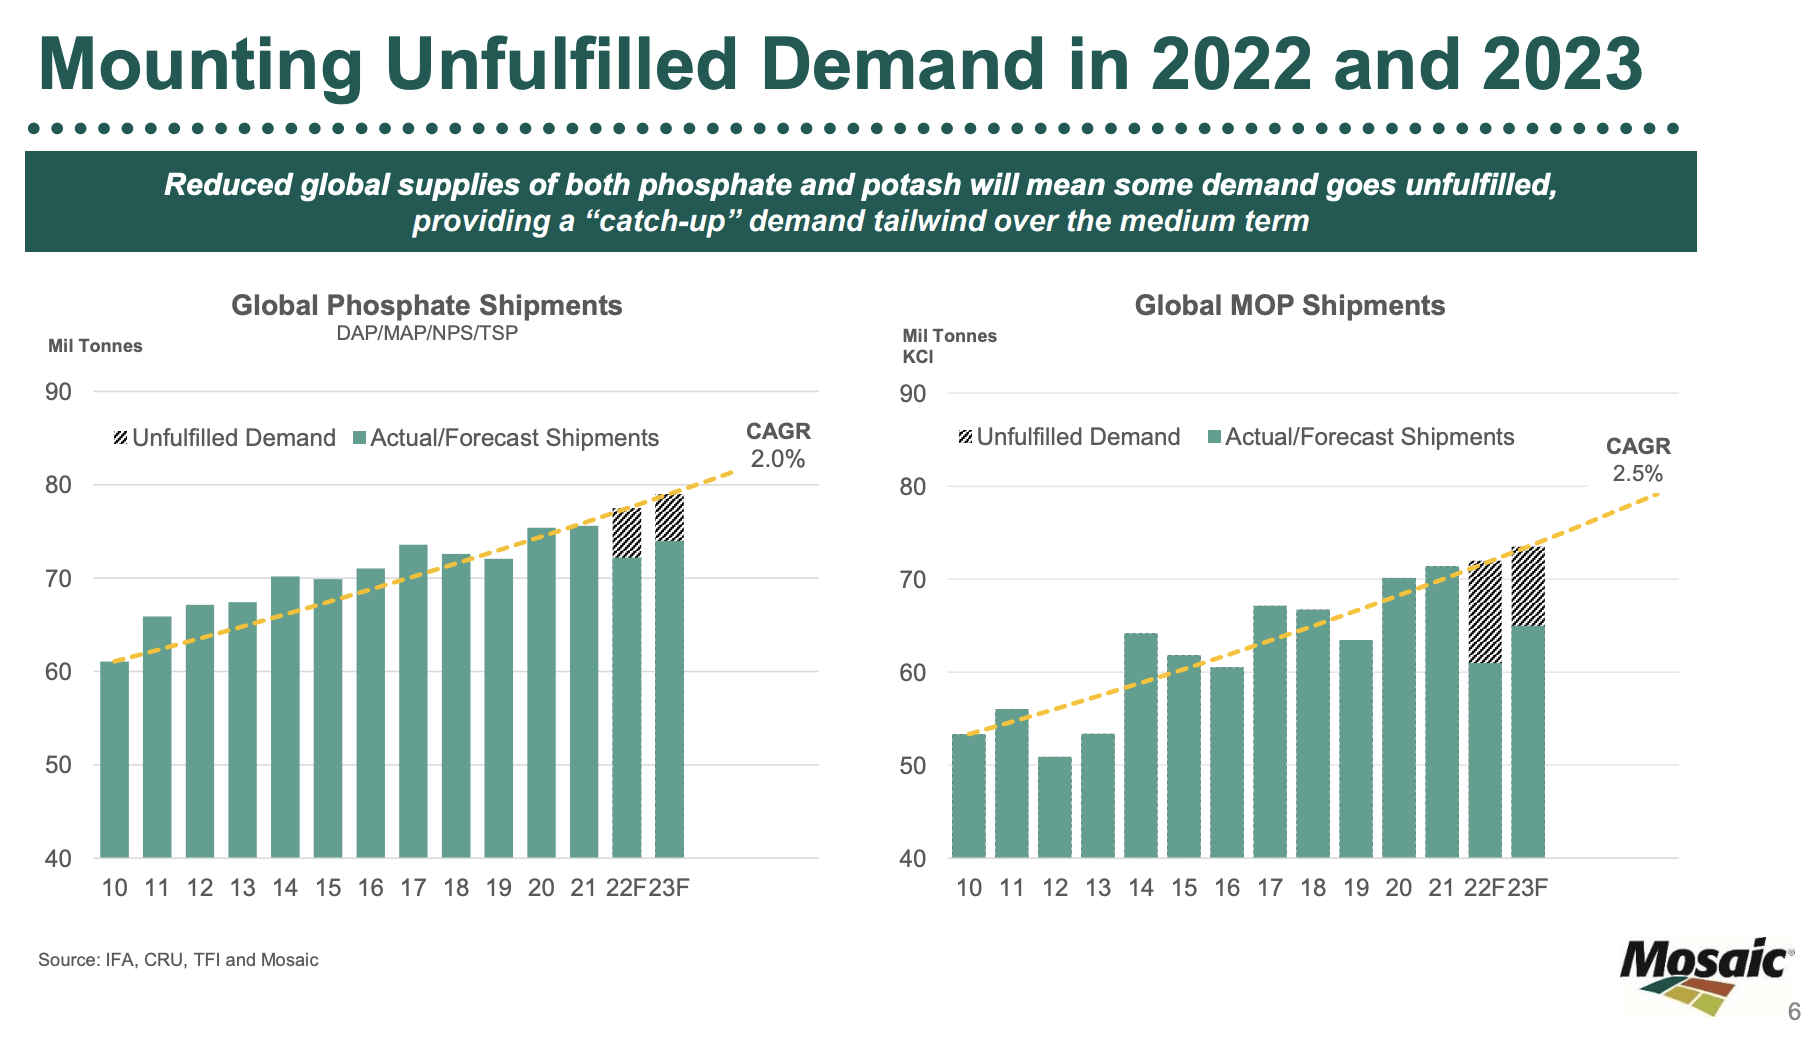
Hence, Mosaic is looking to expand production. By 2H23, the company could add an additional 1.5 million tons per year. 2022 phosphates production is expected to be a million tonnes above 2021 levels. Total production in Brazil is expected to grow by 400 thousand tons.
So far, the company is boosting earnings based on lower output, something that has become very common in the industry. In 1Q22, total potash sales were 1.8 million tons. Down from 2.0 million tons. Yet pricing rose by more than 150% providing the company with $651 million in adjusted segment EBITDA – up from $212 million in 1Q21.
In phosphates, the same happened. Sales were at 1.7 million tons. Down from 2.1 million tons. Yet pricing rose from $426 per ton DAP to $785 per ton, providing the company with a surge of $361 million in segment (adjusted) EBITDA to $632 million.
Mosaic Fertilizantes adjusted EBITDA more than doubled from $104 million to $233 million during this period.
This year, the company is expected to do more than $7.7 billion in EBITDA with free cash flow reaching $3.7 billion. That’s an implied free cash flow yield of 23.4%. It allows the company to erase all of its net debt by the end of next year, which would also mean that the company enters the next commodity downturn (whenever that may be) with a much healthier balance sheet.
TIKR.com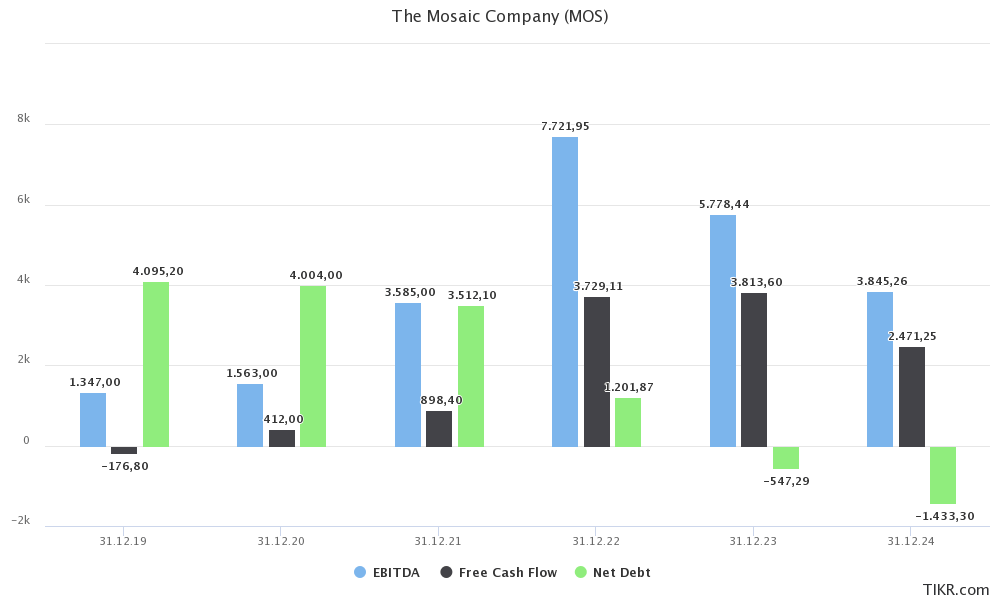
If we incorporate the company’s $15.8 billion market cap, $550 million in expected net cash, $153 million in minority interest, and $130 million in pension-related liabilities, we get an enterprise value of $15.5 billion.
That’s roughly 2.7x next year’s expected EBITDA. It’s 4.1x expected 2024 EBITDA when analysts are pricing in the normalization of fertilizer prices.
This is way too cheap and it does not at all price in the risks (or in this case opportunities) facing the agriculture sector.
TIKR.com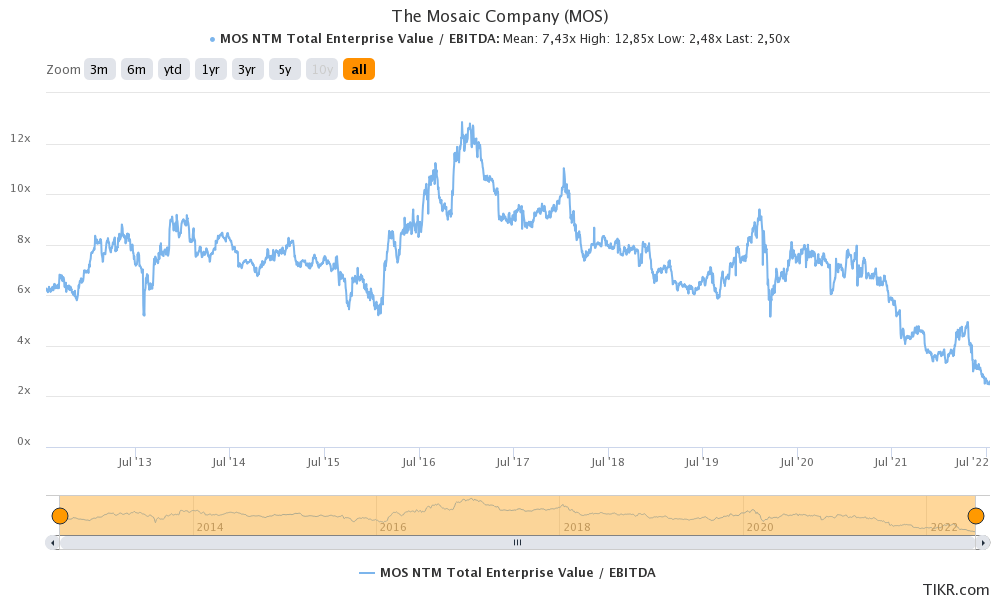
Hence, I believe that Mosaic should trade at least between $70 and $80, which could be achieved by the end of this year if the energy crisis in Europe worsens – to give you a trigger event.
If that doesn’t happen – and I think we all hope that this can be avoided – I believe it will be a more gradual uptrend towards these targets in early 2023.
Takeaway
Agriculture has changed since 2021. Production costs have risen consistently and it doesn’t look like this will end anytime soon. Energy prices are high, making fertilizer production more costly. Meanwhile, Europe has reduced fertilizer production due to unsustainable energy costs. All of this is made worse by the war in Ukraine and the fact that “food” has, once again, become a weapon of war.
In this article, I highlighted the importance of fertilizers as improving farm efficiencies isn’t just a nice thing to have, but a total necessity given population growth and the fact that arable land is limited.
Mosaic is in a fantastic spot to benefit from all of this. The company has a geographic advantage, which allows it to produce cheaper than competitors suffering from even higher energy costs, it can (and will) boost output, and it can erase all of its net debt thanks to high free cash flow.
The valuation has come down significantly as a result of the (temporary) decline in energy prices and I believe that Mosaic is poised to continue its longer-term uptrend as shares are massively undervalued at current prices.
Nonetheless, I advise investors to not go overweight fertilizer (or energy) stocks. These investments are volatile and very cyclical and can do harm to traders who are inexperienced with these risks.
(Dis)agree? Let me know in the comments!
Be the first to comment