

Khanchit Khirisutchalual
After another set of stunning CPI and PPI reports, not to mention hot jobs growth data earlier in the month, traders are left wondering if inflation has finally reached its climax. As early as March and April this year, many market pundits jumped the gun on the “peak inflation” narrative. Alas, more sizzling data points hit the tape through Q2. Is it different this time? I say probably yes.
Just take a look at one-month returns on key commodities. Important agricultural soft products like cotton and wheat are off by more than 20% in the last month while we all know about the steep drawdowns seen in the energy arena – though natural gas has perked back up, crude oil and RBOB gasoline futures are way off their June zeniths. Moreover, the cost to ship goods around the world is in steep decline while “Dr. Copper” has been severely hurt.
M/M Commodity Performances Point To A Peak In Inflation
Koyfin Charts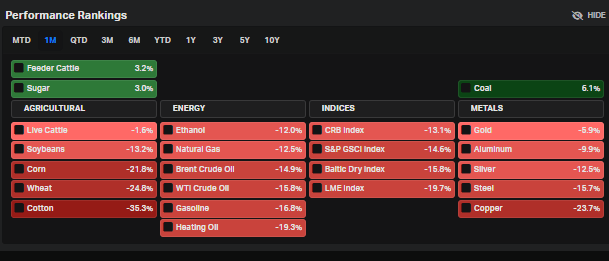
Perhaps the biggest market “tell” right now is indeed what’s happening with copper futures – a key industrial metal. Earlier this year, the United States Copper Index Fund (NYSEARCA:CPER) rallied impressively, though it did not break out. According to VettaFi, the exchange-traded product seeks to replicate an index that is comprised of a basket of exchange-traded futures contracts. The underlying index is designed to reflect the performance of a portfolio of copper futures contracts, diversified across multiple maturities, fully collateralized with 3-month U.S. Treasury Bills.
CPER illustrates the turn from inflation fear to a global economic growth scare. The ETP rallied off its early 2020 lows but then traded sideways for much of 2021 through the first five months of this year. Whenever a chart consolidates as shown below, the key question technicians ask themselves is: Is that pattern indicative of a bullish consolidation or bearish distribution? The answer is seen starkly in price action over the last six weeks. CPER is down nearly 30% from its late-May high. Interestingly, CPER nears support today.
CPER ETF Rallied, Then Stalled Before A Recent Collapse
Stockcharts.com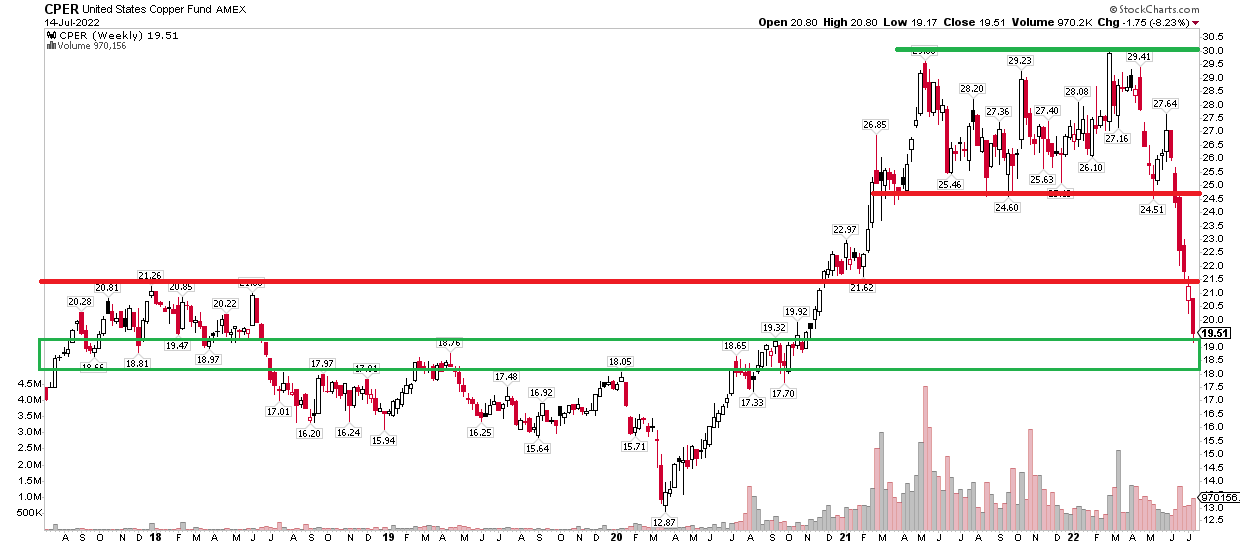
The move in copper echoes what happened during the middle of 2008, immediately before the onslaught of the Great Financial Crisis. While I was just a college kid trading haphazardly and just getting started investing, the broad market shifted from inflation worries to serious global recession realities at that time. A similar story is bearing out now. So, while some inflation top-callers might sound optimistic, I’m less sanguine considering the alternative could be an ugly economic contraction.
DBC Commodities ETF Surged in 1H08, Then Fell As the GFC Ensued
Stockcharts.com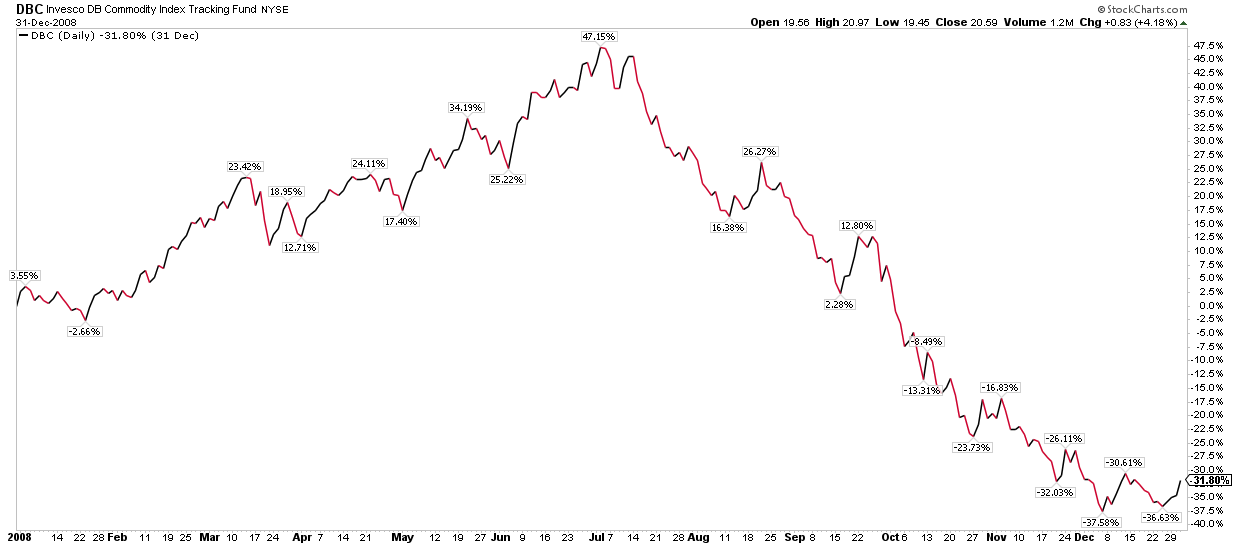
Something else to watch is what happens with labor costs. The upshot right now is that the employment situation is far better than what was seen in early and mid-2008. After June’s positive NFP surprise, +372k jobs, it’s clear that U.S. consumers still have a few weapons in their arsenal to whether stubbornly elevated retail prices. Moreover, last Friday’s upbeat retail sales data further bolstered a positive demand thesis. While all that sounds good on the surface, it’s inflationary. The Fed no doubt wants to see demand ease and wage pressures soften.
June’s Advance Retail Sales Above Consensus
Investing.com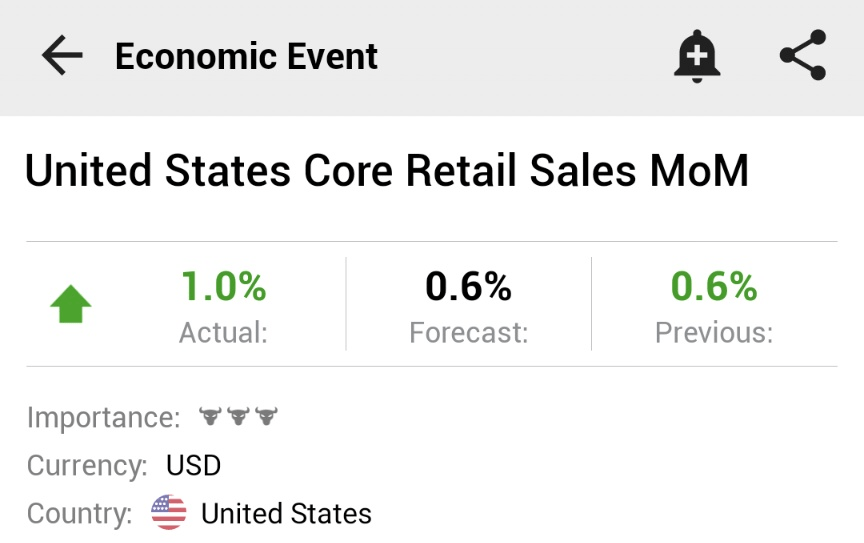
Finally, the housing market must chill out. While some high-frequency data points to falling prices, the S&P/Case Shiller Home Price Index still shows stout monthly advances. Moreover, rents are at nosebleed levels. Due to a controversial tracking methodology the CPI uses, those high prices (which climbed rapidly over the last two years) will only slowly find their way into the index’s calculation, keeping CPI prints high through the end of 2022. I will be watching more indicative figures like what Zillow and Redfin post.
Rents and Owning Costs Keep Rising
Bianco Research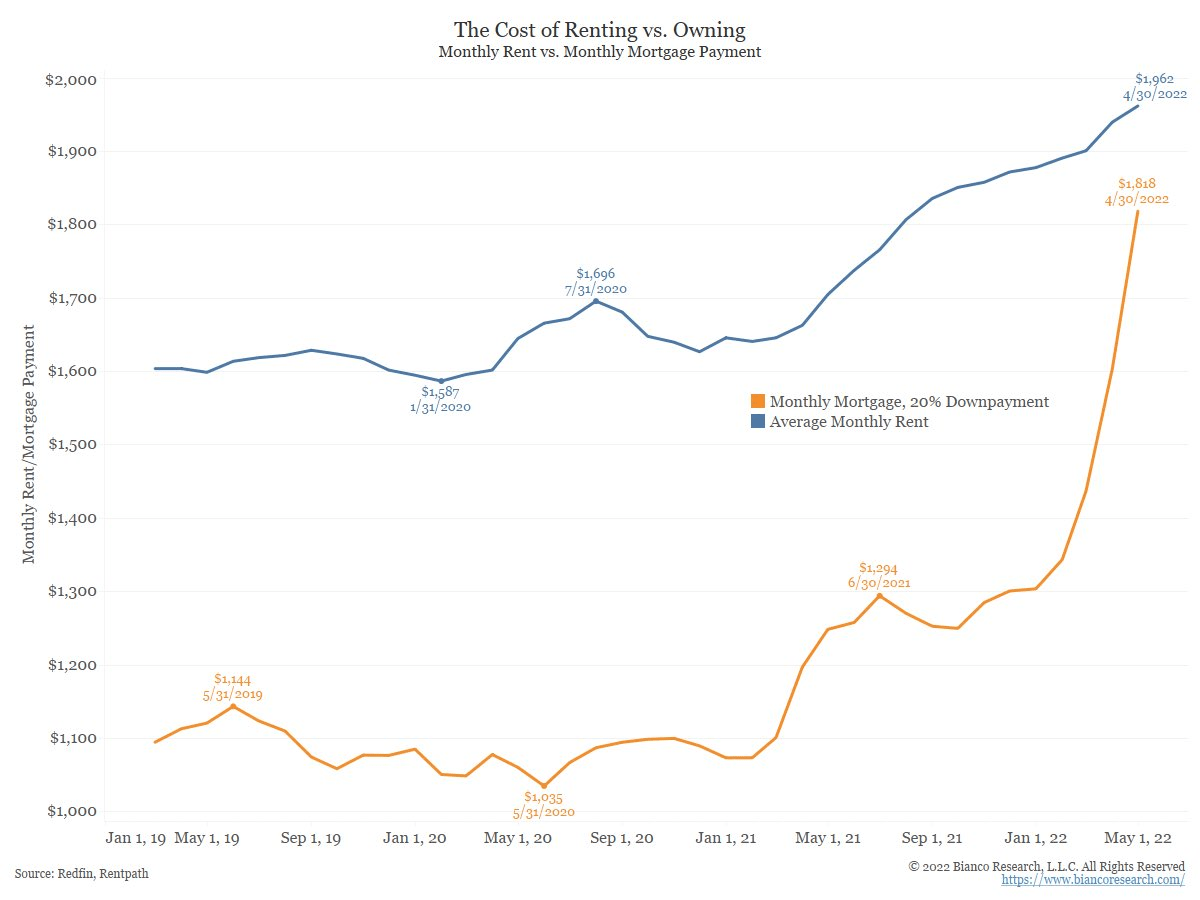
The Bottom Line
Commodities, particularly copper, point to solid disinflationary risks, but wages and the housing market still have work to do to buttress the narrative that a long-lasting decline in the CPI growth rate is imminent. There’s no doubt that we’re near peak inflation though – forward breakeven markets point to a massive drop in the rate of consumer price increases.
Breakeven Inflation Markets Show Dampening Inflation Risks
St. Louis Federal Reserve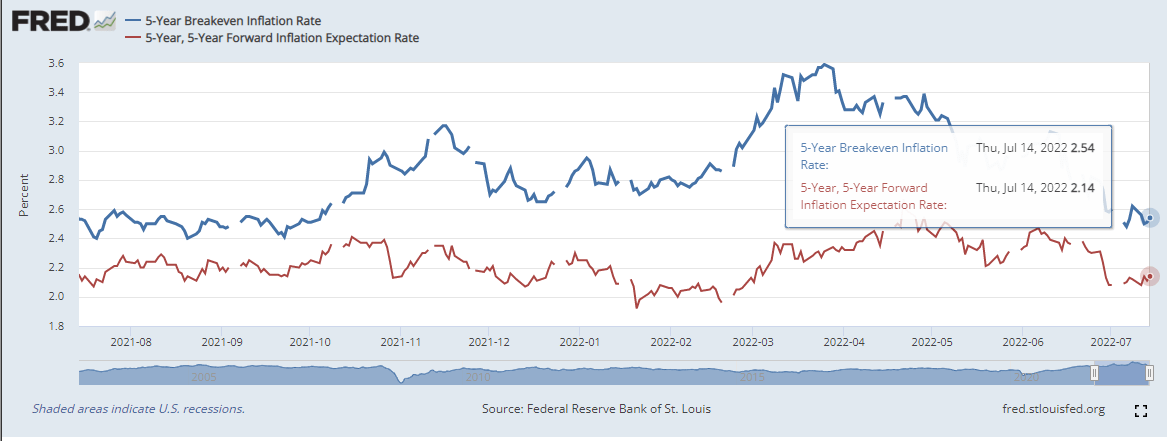
Be the first to comment