Stephen Brashear
Introduction: Why is Microsoft Stock Up?
Microsoft Corporation (NASDAQ:MSFT) stock rose 4.0% in aftermarket trading on Tuesday (July 26) after the company released Q4 FY22 results, but are still 25% below their 52-week high.
Microsoft has been a core holding in our portfolio since 2014, and we initiated our Buy rating on Seeking Alpha in December 2020. MSFT stock’s gain since our initiation currently stands at 18% (including dividends), despite the significant correction among Technology stocks in the past year:
|
Librarian Capital’s MSFT Rating History vs. Share Price (Last 1 Year)  Source: Seeking Alpha (27-Jul-22). |
Q4 results marked a strong finish to FY22, with full-year Non-GAAP EPS growing 15.5% (19.8% reported). The quarter itself saw double-digit revenue growth again, though EPS growth was just 2.7% due to currency and tax. There were some macro headwinds but most indicators in the business were strong. FY23 guidance implies another year of double-digit EBIT growth in local currencies. MSFT stock is at a P/E of less than 30x. Our forecasts indicate a total return of 90% (24.8% annualized) by June 2025. Buy.
Microsoft Buy Case Recap
Our Buy case on Microsoft is based on a combination of trends together driving a sustained low-teens EPS CAGR across multiple years:
- Technology spend as a percentage of GDP is expected to double in the next decade, driven by various structural trends, particularly digitalization.
- MSFT revenues will grow faster than Technology spend, as its many competitive advantages will help it to continue gaining market share.
- Earnings will grow faster than revenues, as costs on incremental revenues are low, giving MSFT natural operational leverage.
- Management will continue to return capital to shareholders in dividends (an approx. 1% yield) and buybacks (adding 1% to EPS growth each year).
Under current CEO Satya Nadella’s leadership, Microsoft has consistently delivered double-digit revenue growth, EBIT margin expansion and high-teens or higher EPS growth since FY18. Growth was further boosted by COVID-19 in FY21, creating what we believe to be a permanently higher earnings base.
We have been assuming a 37.5x P/E for the end of our forecast period. This previously represented a de-rating but, with the recent correction in Technology stocks including MSFT, now represents a significant re-rating upwards.
Q4 FY22 results and new FY23 guidance support our investment case.
Another Year of Double-Digit Growth in FY22
Q4 results marked a strong finish to FY22, with full-year Non-GAAP EPS growing 15.5% year-on-year (17% excluding currency). Non-GAAP EBIT grew 19.3% (21% excluding currency), but Net Income growth was lower due to some one-off tax benefits in FY21. EBIT growth was driven by revenues growing 18.0% and EBIT margin expanding slightly:
|
MSFT P&L (Non-GAAP) (FY22 vs. Prior Year) 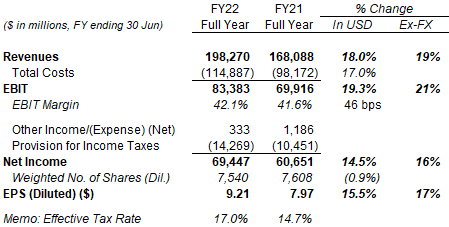 Source: MSFT company filings. |
GAAP EPS was higher at $9.65, thanks to a $3.3bn tax benefit related to the transfer of intangibles, and year-on-year GAAP EPS growth was 19.8%.
MSFT has continued to demonstrate consistent double-digit growth. FY22 revenue growth of 18.0% was in fact higher than in the COVID-boosted FY21. FY22 EBIT growth and EPS growth were moderately below the near-20% level seen in FY19-21, reflecting a normalization after the exceptional 32.0% growth in EBIT and 38.3% growth in EPS in FY21:
|
MSFT Revenue & Earnings Growth (FY15–22) 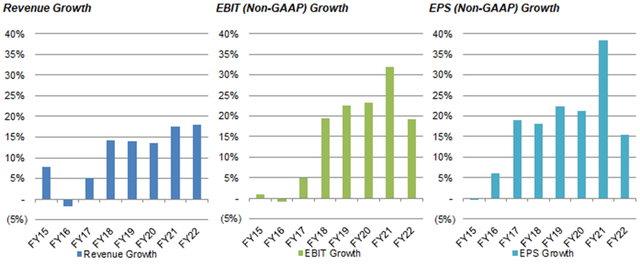 Source: MSFT company filings. |
Double-digit growth was also visible in many parts of Q4 FY22 results.
Double-Digit Revenue Growth in Q4
Double-digit revenue growth continued into Q4 FY22, though EPS growth was just 2.7% due to currency and tax.
In Q4 FY22, revenues grew 16% year-on-year in local currencies, but only 12.4% in USD. Total costs grew 15.8%, driven by a 22% increase in headcount that included 6 ppt from the Nuance and Xandr acquisitions. Costs also included 2 ppt of growth associated with the exit from Russia following its invasion of Ukraine. Despite these EBIT still grew 14% in local currencies, though only 7.5% in USD. Net Income again grew less than EBIT due to a higher tax rate. EPS growth, helped by a 1.0% year-on-year reduction in the share count, was 8% in local currencies but 2.7% in USD:
|
MSFT P&L (Non-GAAP) (Q4 FY22 vs. Prior Periods) 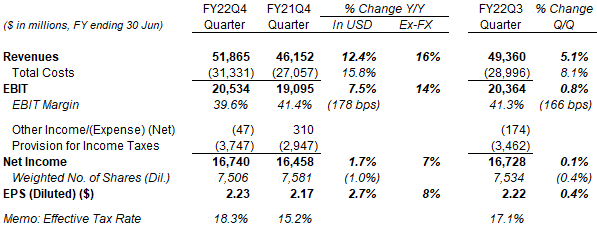 Source: MSFT company filings. |
Macro headwinds in Q4 included COVID-related extended production shutdowns in China, a deteriorating PC market in June and reductions in advertising spend. These reduced revenues by approximately $400m (or just under 1%).
On a segment level, Productivity & Business Processes and Intelligent Cloud both grew revenues and EBIT by double-digits year-on-year in Q4, but More Personal Computing was weaker, partly due to the headwinds described above:
|
MSFT Revenue & EBIT By Segment (Q4 FY22 vs. Prior Periods) 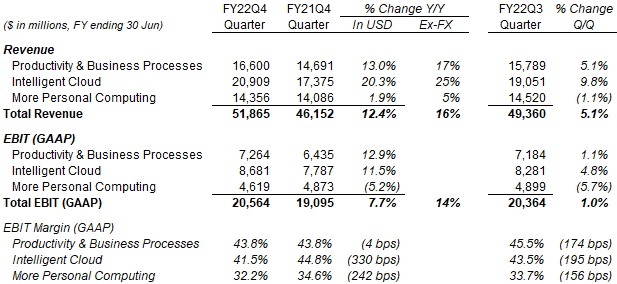 Source: MSFT company filings. NB. No difference in GAAP and non-GAAP figures here. Intelligent Cloud included 4 weeks of Nuance contribution in Q3 FY22. |
Underlying trends also remained strong in most Microsoft businesses, though a few did decelerate sequentially.
Mostly Strong Underlying Trends
Among Microsoft’s segments, Productivity & Business Processes and Intelligent Cloud have continued their long-term sequential growth, thanks to their high components of recurring or subscription-based revenues, while More Personal Computing appears to be experiencing one of its cyclical downturns:
|
MSFT Revenue By Segment By Quarter (FY19–22) 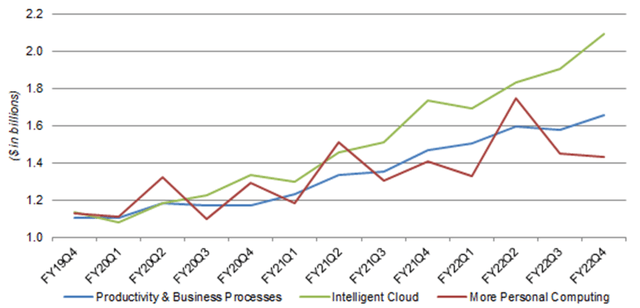 Source: MSFT company filings. |
Indicators at key individual businesses paint a similar picture, with mostly strong trends but some deceleration.
In Productivity & Business Processes, Office revenues (both Commercial and Consumer), Office 365 Commercial seats and Dynamics revenues all grew double-digits year-on-year in Q2, but with growth rates that were up to 2 ppt lower than in Q1. There was a “moderation” in new deal volume among SMBs in Office Commercial (outside of the E5 product). LinkedIn revenue grew 29% year-on-year (ex-currency), but this represented a 6 ppt deceleration from Q1, attributed to a “slowdown in advertising spend” as well as “weaker online job posts late in the quarter”:
|
MSFT Productivity & Business Processes KPIs (Last 5 Quarters)  Source MSFT results presentation (Q4 FY22). |
In Intelligent Cloud, Azure & Other Cloud Services revenues grew 46% (excluding currency), similar to prior quarters, but there was a “slight moderation in Azure consumption growth across customer segments”. Server Products revenue growth was just 1% in constant currencies, due to higher in-period revenue recognition in the prior-year comparable:
|
MSFT Intelligent Cloud KPIs (Last 5 Quarters) 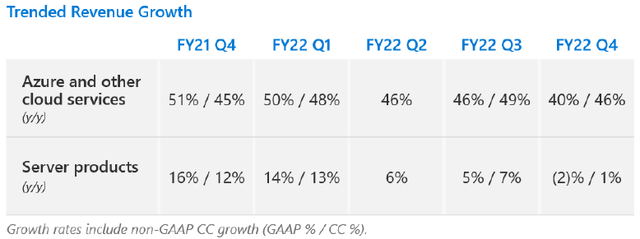 Source MSFT results presentation (Q4 FY22). |
In More Personal Computing, Windows OEM revenues declined year-on-year due to the China production shutdowns and weaker PC market described above. Xbox content and services revenues also declined, due to lower engagement hours (likely part of post-COVID normalization) and lower monetization of content, though Xbox Game Pass subscriptions grew. Windows Commercial, Surface and Search & New Advertising all grew double-digits, but at rates several points lower than in Q1:
|
MSFT More Personal Computing KPIs (Last 5 Quarters)  Source MSFT results presentation (Q4 FY22). |
We believe strong growth will continue in many of the businesses within Microsoft’s broad franchise, driving overall double-digit earnings growth. This view is supported by the new FY23 outlook provided by management.
Double-Digit Growth in FY23 Outlook
Management issued their first FY23 outlook, including double-digit growth in revenues and EBIT (in local currencies):
|
MSFT FY23 Outlook 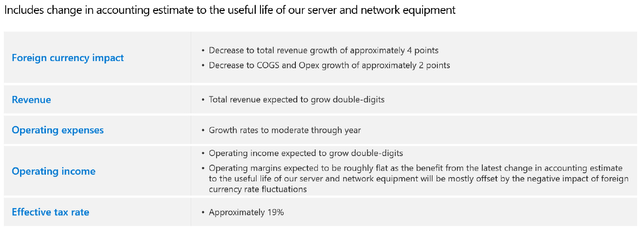 Source: MSFT outlook (Q4 FY22). |
This likely implies a double-digit EPS growth in local currencies, as the expected increase in the tax rate to approximately 19% (from 18.3% in FY22) implies just am 1% headwind to EPS, which should be offset by ongoing buybacks.
However, depending on what “double-digits” means, the guidance may imply only a high-single-digit EPS growth in USD. This is because the expected currency headwinds of 4% for revenues and 2% for COGS as well as OpEx imply a nearly 7% headwind for EBIT in USD.
The guidance includes an accounting change that lengthens the useful life estimate for server and network equipment assets from 4 to 6 years, which will spread the same depreciation charges over a longer period. However, management stated that EBIT margin will be flat in local currencies excluding the benefit of this accounting change.
The guidance does not include the pending Activision (ATVI) acquisition, expected to close by the end of FY23.
Q1 FY23 Outlook Represents Just A Start
Management provided a more detailed outlook for Q1 FY23, and its mid-point implies a year-on-year growth of 9.8% in revenues and 5.7% in EBIT in USD (Net Income is not comparable due to a prior-year tax benefit):
|
MSFT P&L Outlook (Q1 FY23) 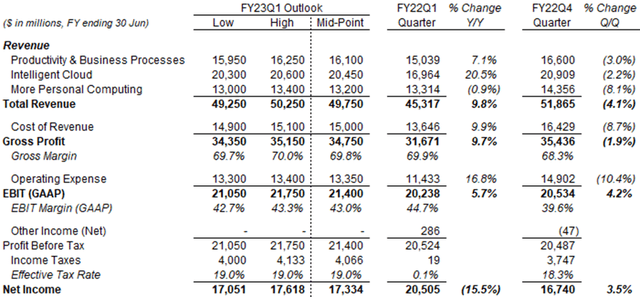 Source: MSFT company filings. |
The implied Q1 FY23 growth rates are lower than our long-term expectations. However, they are affected by currency headwinds, which are worth 5 ppt to total revenue growth and a high-single-digit to EBIT growth. In addition, Q1 FY23 only represents the start of the year, which is expected to get better over time.
Management expects Operating Expense growth to “moderate materially over the course of the year”; it is expected to be stronger in early FY23 due to existing hiring commitments and before Microsoft lapped the Nuance and Xandr acquisitions. Currency and prior-year OEM comparable are also expected to get better in H2.
Valuation: Is Microsoft Stock Undervalued?
At the post-market price of $261.90, on FY22 financials, MSFT shares are trading at a 28.3x P/E and a 2.8% Free Cash Flow (“FCF”) Yield; on CY21 financials, shares are at a 29.2x P/E and a 2.6% FCF Yield:
|
MSFT Earnings, Cash flows & Valuation (Since FY19) 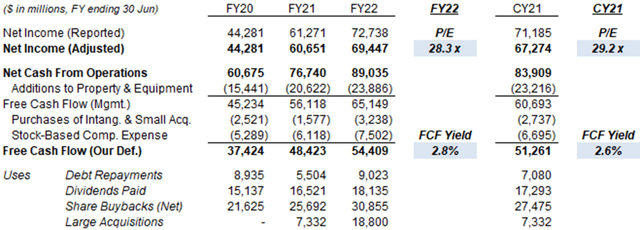 Source: MSFT company filings. NB. “Large acquisitions” excluded were Bethesda Networks ($8.1bn) in FY21 and Nuance ($18.8bn) in FY22. |
The dividend is $0.62 per share per quarter ($2.48 annualized), representing a Dividend Yield of 0.9%. It was raised 11% last September.
Microsoft repurchased $30.9bn of its shares in FY22, equivalent to 1.6% of its current market capitalization.
What Will Microsoft Stock Be Worth?
Our most recent FY22 EPS forecast was 1.4% too high ($9.34 vs.$9.21).
We keep the assumptions in the rest of our forecasts unchanged:
- Net Income to grow 11.0% each year from FY23
- Share count to fall by 1% each year
- Dividend growing with a 30% Payout Ratio
- P/E of 37.5x at FY25 year-end (June 2025)
Our FY25 EPS forecast is $12.98, 1.4% lower than before ($13.17):
|
Illustrative MSFT Return Forecasts 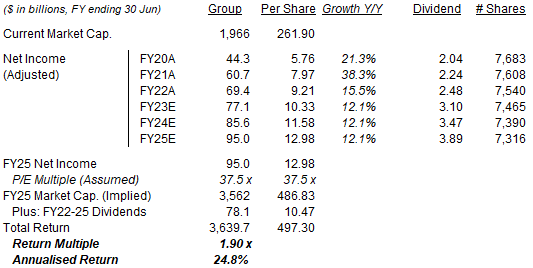 Source: Librarian Capital estimates. |
With shares at $261.90, we expect a total return of 90% (24.8% annualized) by June 2025, in just under 3 years.
Is Microsoft Stock a Buy? Conclusion
We reiterate our Buy rating on Microsoft Corporation stock.


Be the first to comment