

Lobro78/iStock Editorial via Getty Images
In our previous analysis of Microsoft Corporation (NASDAQ:MSFT), we analyzed the company’s planned acquisition of Activision Blizzard (ATVI) for $68.7 bln and estimated its revenue synergies of $484 mln in 2023 and a revenue contribution of 4% to the company’s 2023 revenues.
In this analysis, we looked further into the company’s growth driven by the Business & Productivity segment (comprised of Office Products, LinkedIn and Dynamics). This major segment makes up 32.1% of its total revenue in 2021. As Microsoft recently increased the pricing of its products, we analyzed its flagship office productivity software package, Microsoft 365, in terms of its pricing and the breadth of features and derived a positioning map of it with its competitors. In addition, we compared its LinkedIn business with competitors based on its user growth and average revenue per user (ARPU) growth.
Based on this comparison, we plotted a positioning map of the company with its competitors. Lastly, we analyzed the company’s financial ratios to identify their advantage based on Capex/Sales, ROCE, ROA and ROIC. We compared its Capex/Sales with our derived industry average to determine the efficiency of the company.
Microsoft, Khaveen Investments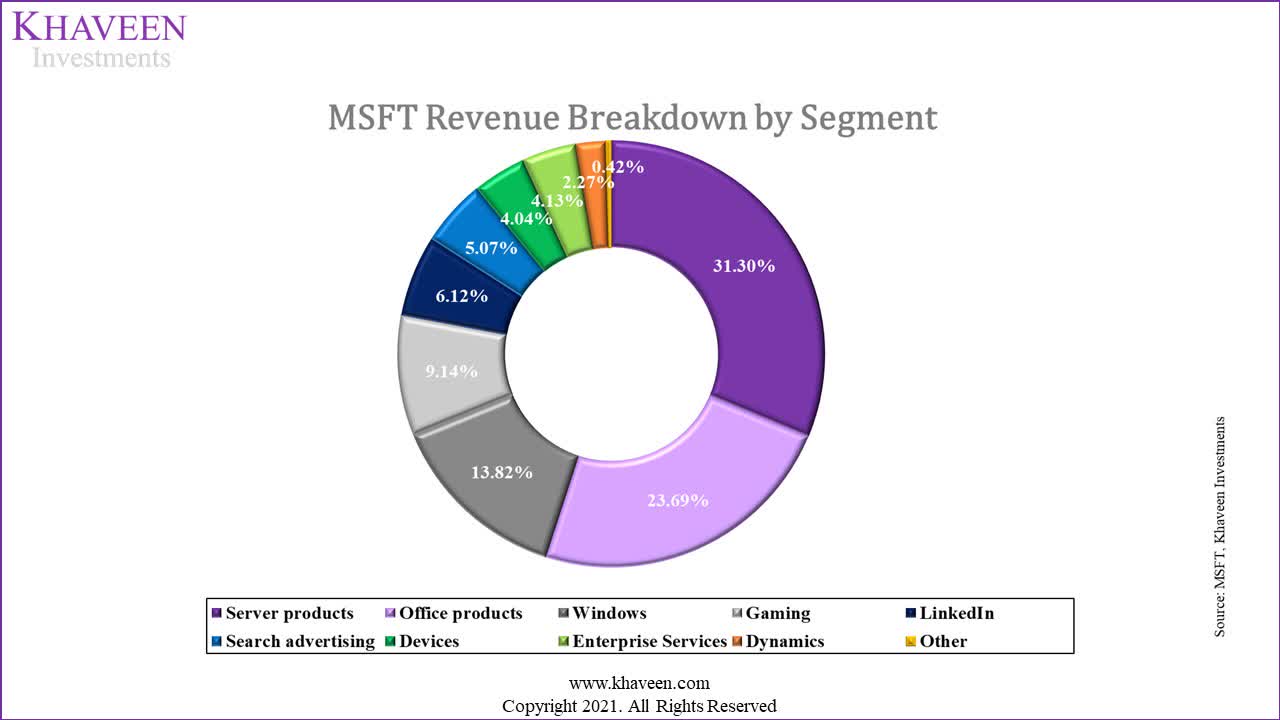
Cost and Product Leadership in Productivity Software Market
Based on its revenue breakdown, Microsoft’s Productivity and Business Processes segment is its second-largest segment accounting for 32.1% of revenue in 2021. In Q3 FY2022, its segment revenue grew by 17% YoY while Office 365 revenue grew by 17% YoY based on its earnings briefing. According to its annual report, this includes products and services such as Office products, LinkedIn and Dynamics. Specifically, Office Commercial is catered for organizations to increase productivity spanning categories such as “communication, collaboration, analytics, security, and compliance” from its annual report. According to Gartner (IT), Microsoft had dominated the productivity software market with a huge market share of 89.2%, well ahead of Google (GOOG, GOOGL), which trails behind with a market share of 10.3%.
Gartner, Khaveen Investments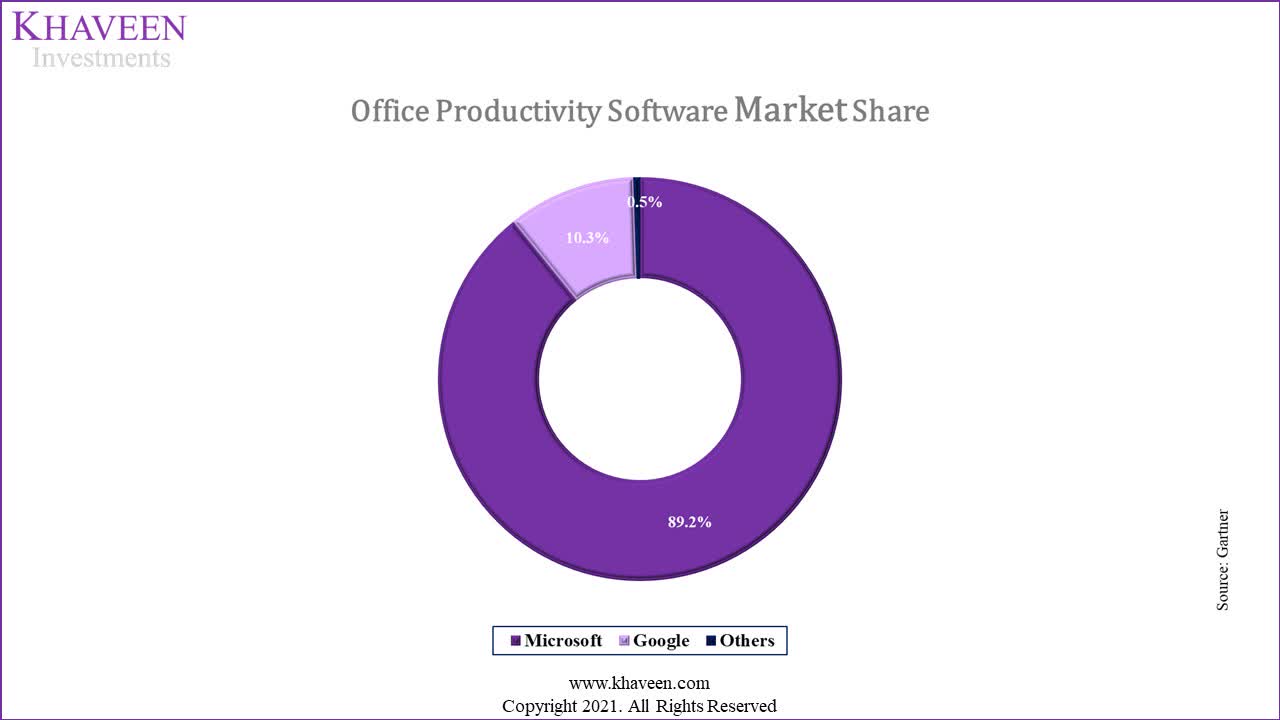
In addition, the company revised its commercial pricing for Microsoft 365 in March 2022 by 15.71% on average across Business and Enterprise products. While its price increase may affect its product attractiveness, we believe that its overall strengths in office productivity software may support the price increase. To determine its competitive positioning in the market, we analyzed Microsoft 365 product pricing by comparing the top tier product of each major productivity software competitor to determine which company has cost leadership. Also, we analyzed each product’s breadth of features available which allow users to carry on a range of activities such as “communication, workflow management, security, recruitment and remote access ability.” Combining the two factors, we created a positioning map based on cost leadership and features.
Trootech, GetApp, Microsoft, Google, Zoho, Slack, Dropbox, Zoom, SoftwareAdvice, Rackspace, Bitrix24, Citrix Workspace, Webex, Constant Contact, Box, Kissflow, Icewarp, Khaveen Investments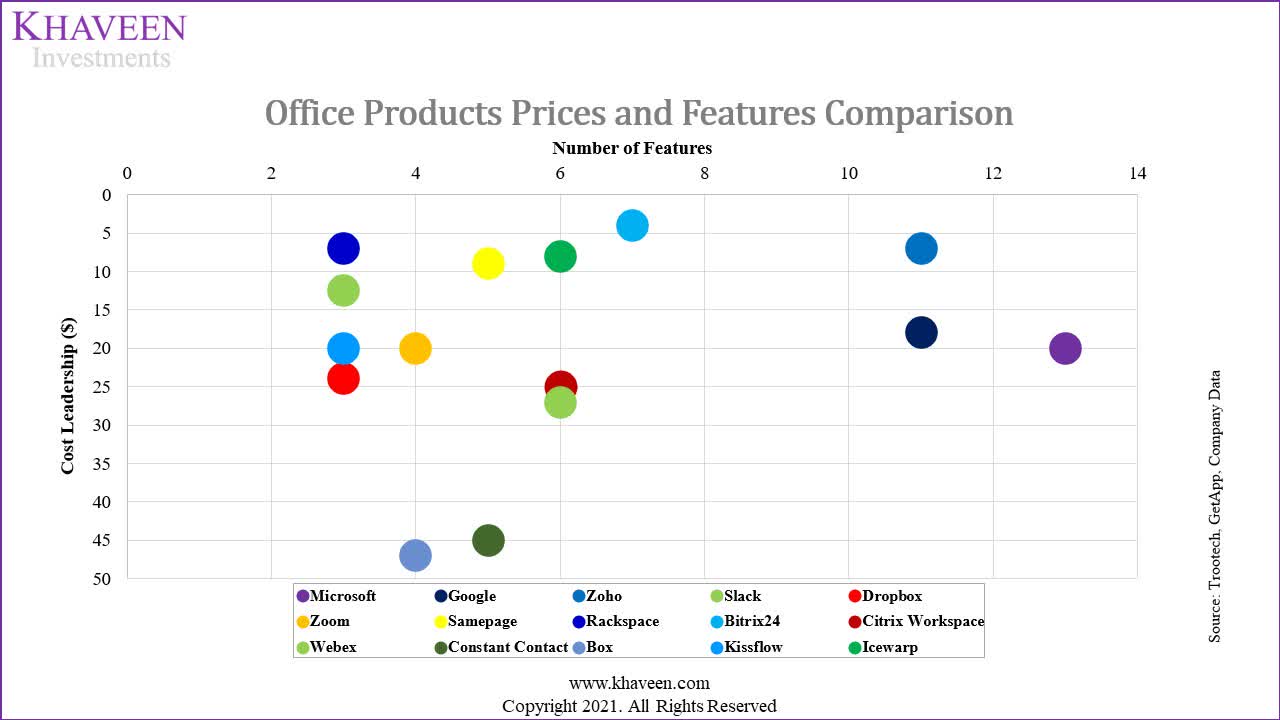
Trootech, GetApp, Microsoft, Google, Zoho, Slack, Dropbox, Zoom, SoftwareAdvice, Rackspace, Bitrix24, Citrix Workspace, Webex, Constant Contact, Box, Kissflow, Icewarp, Khaveen Investments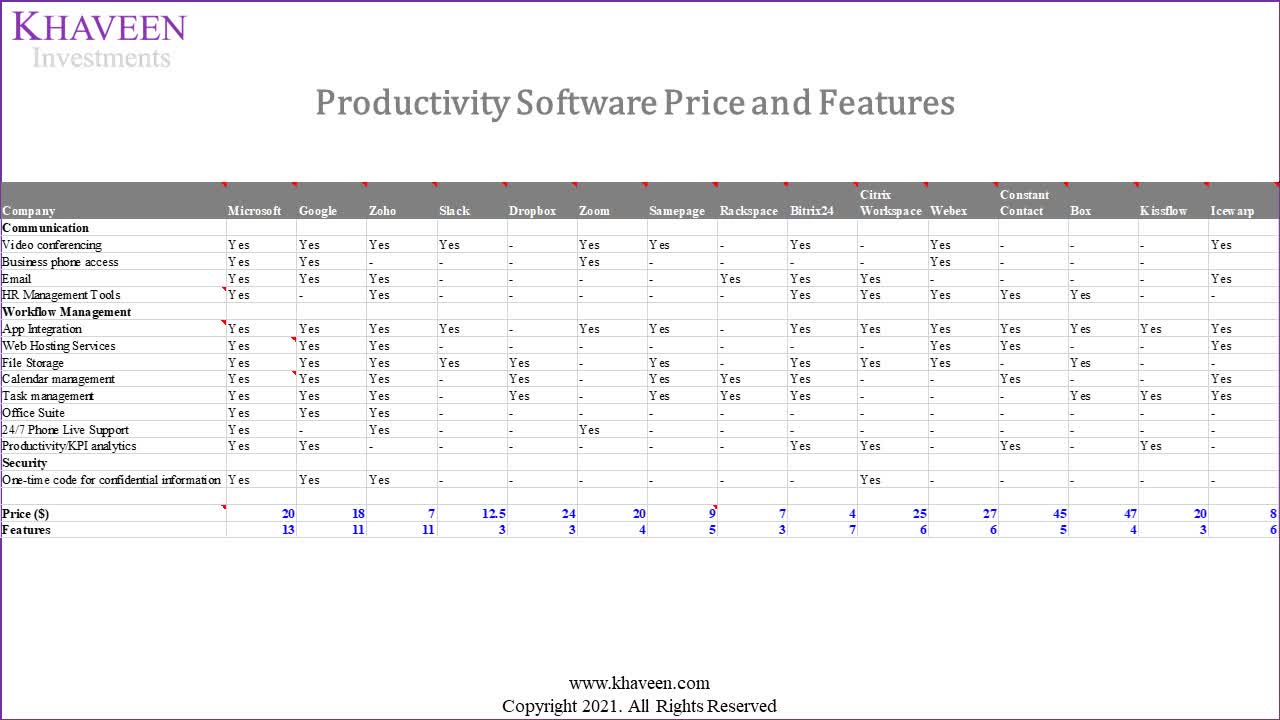
Based on the positioning map and the table above, Microsoft’s productivity software has the highest number of features (13) compared to its competitors making its software offering the most comprehensive while Google and Zoho trail behind with 11 features. The company’s features include various communication features such as video conferencing with Teams, business phone, and HR management tools as well as a wide range of workflow management features like web hosting, file storage and office suite. Moreover, Microsoft provides app integration with other Microsoft products such as Dynamics 365, Power Platform, and Synapse as well as 1,000 available third-party apps for Teams. Also, it also places emphasis on convenient customer support services as well as cybersecurity features to enhance the security of its solutions.
In terms of cost, several competitors such as Google ($18), Zoho ($7), Slack ($12.5), Samepage ($9) and Icewarp’s ($8) software have a lower cost than Microsoft ($20). While Microsoft’s software is not the lowest, its pricing is more competitive than competitors including Dropbox ($24) (DBX), Citrix ($25) (CTXS) and Webex ($27) (CSCO), and with a higher number of features. Thus, we believe its broad software features and competitive pricing to some competitors highlight its strength in productivity software. Based on its earnings briefing, the company claimed that Microsoft 365 customers can save as much as 60% compared to single-point solutions from competitors. Overall, we believe that Microsoft going forward could continue to maintain its market dominance with a share of over 80% in the productivity software market given its strengths against competitors.
Diversified LinkedIn Business Model Promotes Growth in Users
LinkedIn is also in the Productivity and Business Processes segment and was acquired by Microsoft in 2016 for $26.2 bln. It generates revenues based on four revenue streams from various segments such as Business, Talent and Marketing Solutions and Premium Subscriptions as summarized in the chart below from Feedough. Based on its earnings briefing, management highlighted that Talent Solutions revenue increased by 43% YoY.
Feedough, Khaveen Investments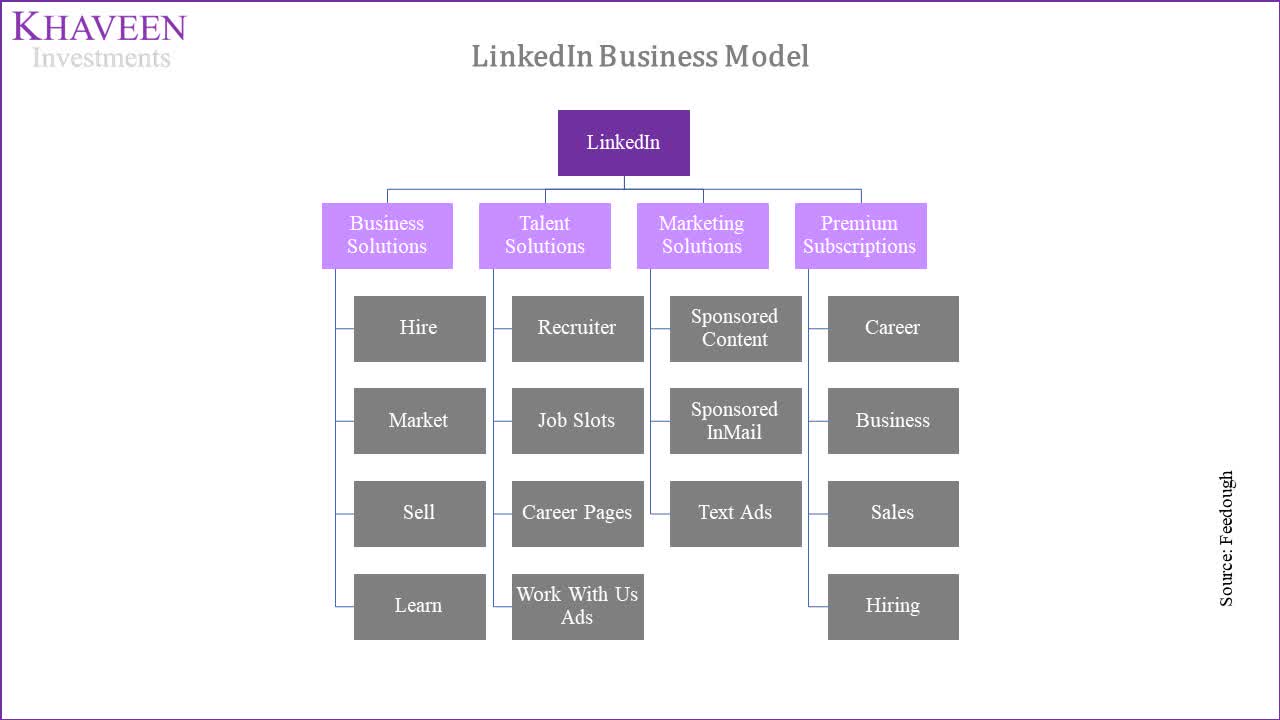
We considered LinkedIn part of the Social Networking Sites market because it allows users to network with other people through connections. LinkedIn leverages a network effect to attract users and build its user base as people use LinkedIn to connect with other working professionals as well as provide potential job applicants to gain access to job opportunities. By building up its user base, it could allow for opportunities to generate revenues through online advertisements by targeting its user base of working professionals. Thus, we believe LinkedIn could leverage its user base to attract more advertising revenues and provide talent-sourcing solutions to businesses.
BusinessofApps, Khaveen Investments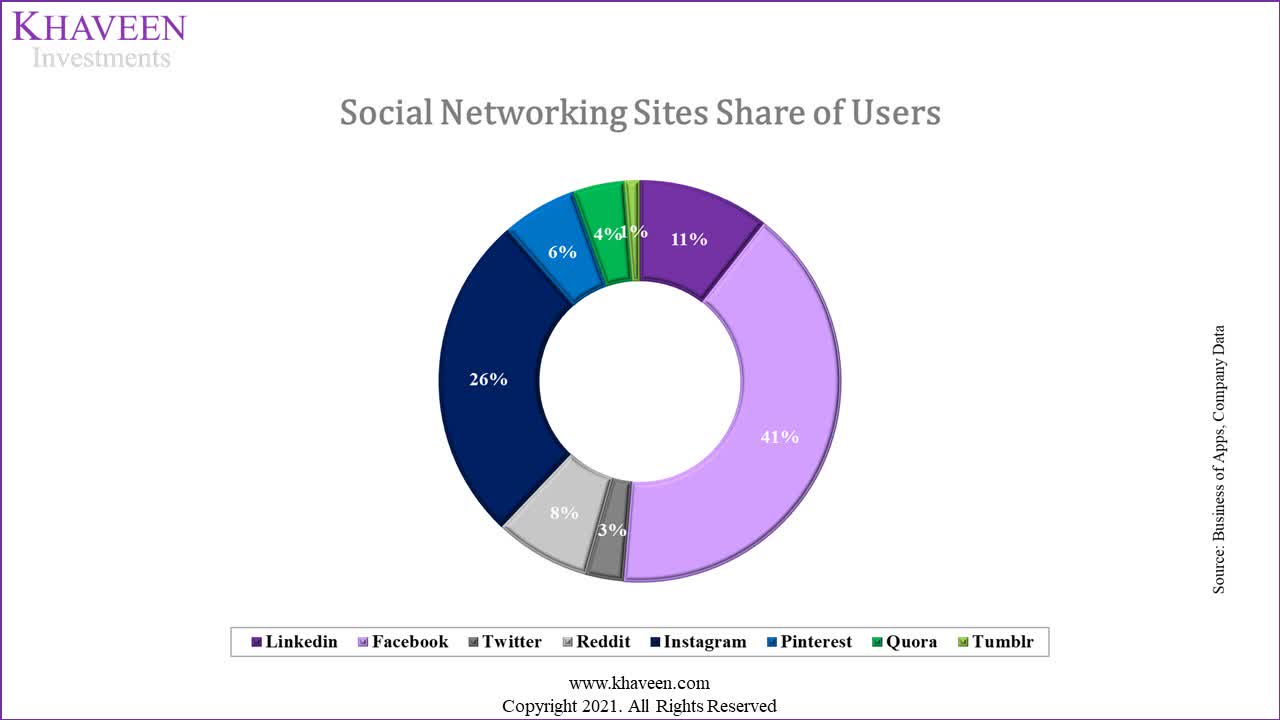
While LinkedIn only represents a small percentage at 11% of the selected Social Networking Sites’ total users which is dominated by Facebook (META) followed by Twitter (TWTR) and Reddit, LinkedIn stands out as a multi-sided platform combining social media with the recruiting platform. Compared to Facebook and Instagram, which has a higher growth rate in terms of average revenue per user, LinkedIn had a stable average ARPU growth of 23% since 2017.
BusinessofApps, Company Data, Khaveen Investments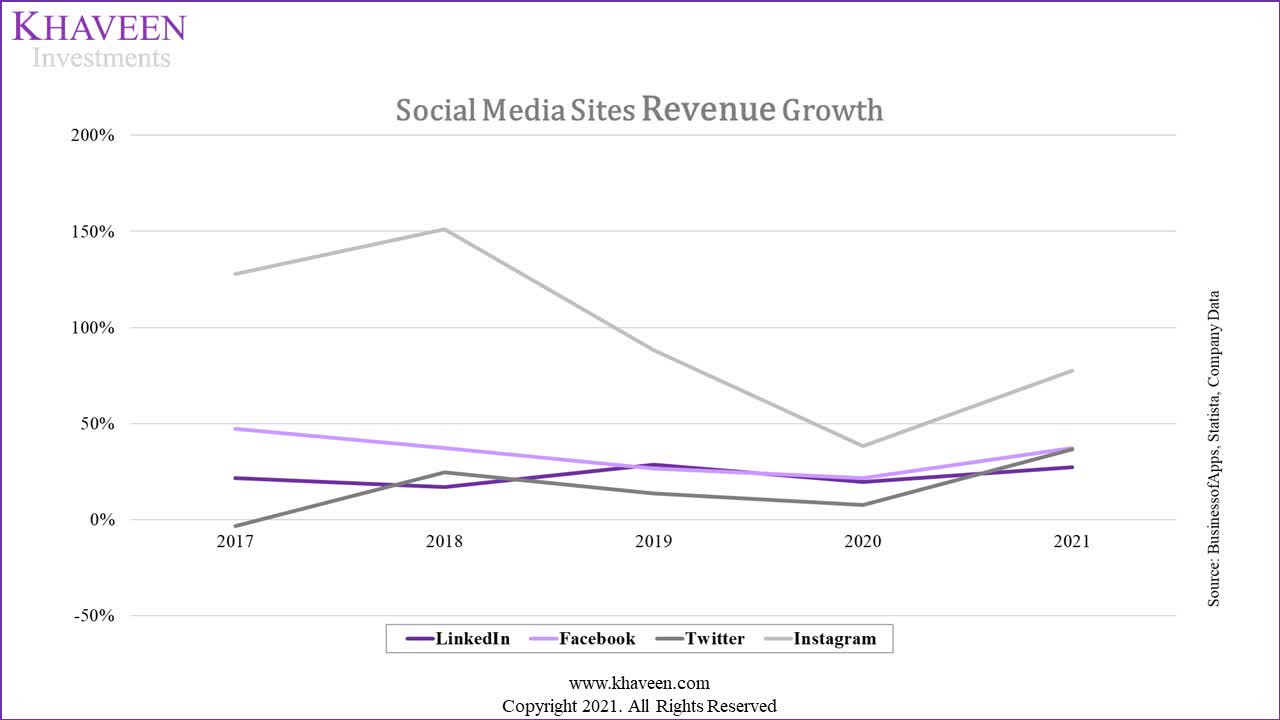
Additionally, LinkedIn had a higher cost per click on their advertisement services which was 4.4x higher than Facebook, 0.48x higher than Instagram and 12.84x higher than Twitter according to BrandWatch. Besides that, LinkedIn was 277% more effective at generating leads compared to Facebook and Twitter according to Hubspot. To find out the difference between LinkedIn’s revenue and user growth with its social media platforms competitors including Facebook, Instagram, Twitter and more, we compared their user growth % and ARPU.
| Social Media Platforms |
User Growth % |
ARPU ($) |
Total Users (‘mln’) |
|
|
9.6% |
13.61 |
756 |
|
|
7.8% |
40.53 |
2,910 |
|
|
13.0% |
23.40 |
217 |
|
|
28.5% |
0.31 |
553 |
|
|
24.3% |
25.19 |
1,890 |
|
Pinterest (PINS) |
-6.0% |
5.98 |
431 |
|
Quora* |
14.5% |
5.64 |
300 |
|
Tumblr* |
4.1% |
0.73 |
88.55 |
*Estimates based on 2020 figures
Source: BusinessofApps, Banklinko, Oberlo, FinancesOnline, TechJury, Company Data, Khaveen Investments
BusinessofApps, Banklinko, Oberlo, FinancesOnline, TechJury, Company Data, Khaveen Investments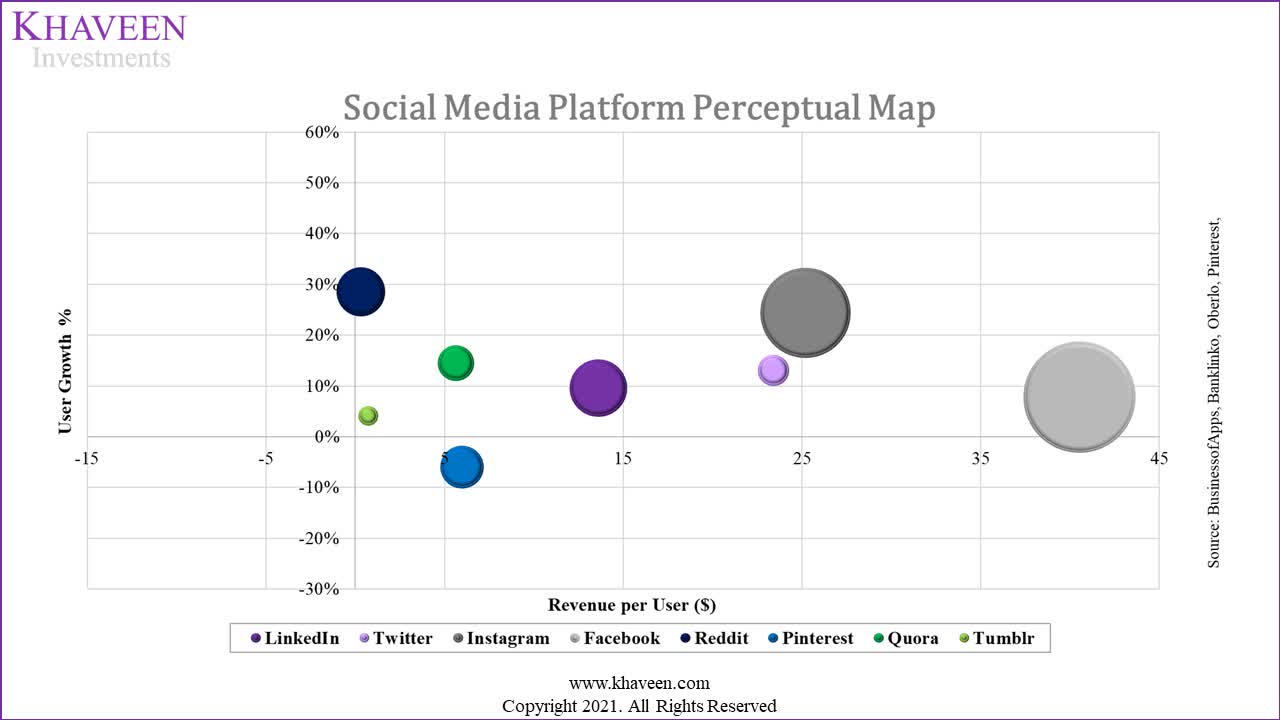
Based on the chart and table above, LinkedIn’s ARPU is higher than competitors Pinterest, Quora, Reddit and Tumblr despite only accounting for 11% of the market share of users. However, its ARPU is lower than Facebook which has the highest ARPU at $40.53, Instagram ($25.19) and Twitter ($23.40). However, LinkedIn (756 mln) had a higher user growth than Facebook but its user base is only 25% of Facebook’s users (2,910 mln).
|
LinkedIn Users & Revenue (‘mln’) |
2017 |
2018 |
2019 |
2020 |
2021 |
2022F |
2023F |
2024F |
2025F |
2026F |
|
LinkedIn Users (‘a’) |
490 |
556 |
604 |
690 |
756 |
839 |
931 |
1,033 |
1,146 |
1,272 |
|
Growth % |
8.9% |
13.5% |
8.6% |
14.2% |
9.6% |
11.0% |
11.0% |
11.0% |
11.0% |
11.0% |
|
LinkedIn Revenue per User (‘b’) |
9.18 |
9.46 |
11.18 |
11.71 |
13.61 |
15.08 |
16.70 |
18.50 |
20.49 |
22.70 |
|
Growth % |
11.7% |
3.0% |
18.2% |
4.7% |
16.3% |
10.8% |
10.8% |
10.8% |
10.8% |
10.8% |
|
LinkedIn Revenue (‘c’) |
4,500 |
5,259 |
6,754 |
8,077 |
10,289 |
12,646 |
15,544 |
19,105 |
23,482 |
28,862 |
|
Growth % |
21.6% |
16.9% |
28.4% |
19.6% |
27.4% |
22.9% |
22.9% |
22.9% |
22.9% |
22.9% |
* c = a x b
Source: Microsoft, BusinessofApps, Khaveen Investments
We believe that the growth of its ARPU and user base bodes well for its total productivity segment growth. Thus, we forecasted its growth based on its 5-year average user growth rate of 11% and ARPU growth of 10.8%. All in all, we projected LinkedIn’s revenues to grow at an average rate of 22.9% annually through 2024 as it attracts more users and monetizes its user base.
Productivity & Business Processes Segment’s Solid Efficiency
Furthermore, based on data from NYU, we calculated the industry average’s capital expenditures to sales and compared it with Microsoft to show the lean business model of the company. We calculated the industry average Capex / Sales consisting of software, electronics and advertising at 28.5%, whereas Microsoft’s Capex / Sales was significantly lower than the average at 12.3%. We believe the reason behind Microsoft’s low Capex could be due to the shift of technologies across different revenue segments as well as economies of scale.
NYU, Khaveen Investments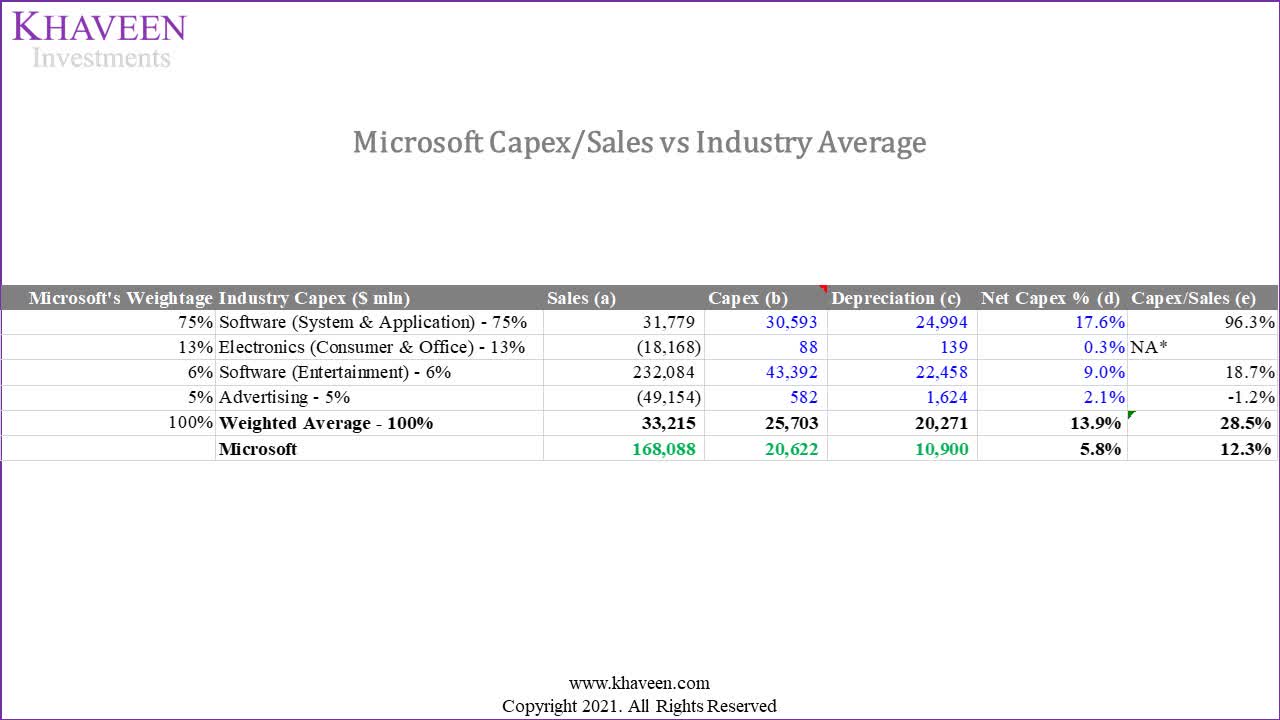
*a = (b – c) / d
*e = b / a
Furthermore, we analyzed Microsoft’s efficiency ratios trend in the past years which has remained strong. In 2018, its FCF margins were impacted by the acquisition of LinkedIn. Besides that, the ratios were further affected by tax law changes in the U.S. That said, Microsoft’s ratios have gradually and steadily improved since 2018. Additionally, its stable ROA and ROCE growth indicate its improving efficiency and we expect its efficiency ratios to continue to improve going forward.
Microsoft, Khaveen Investments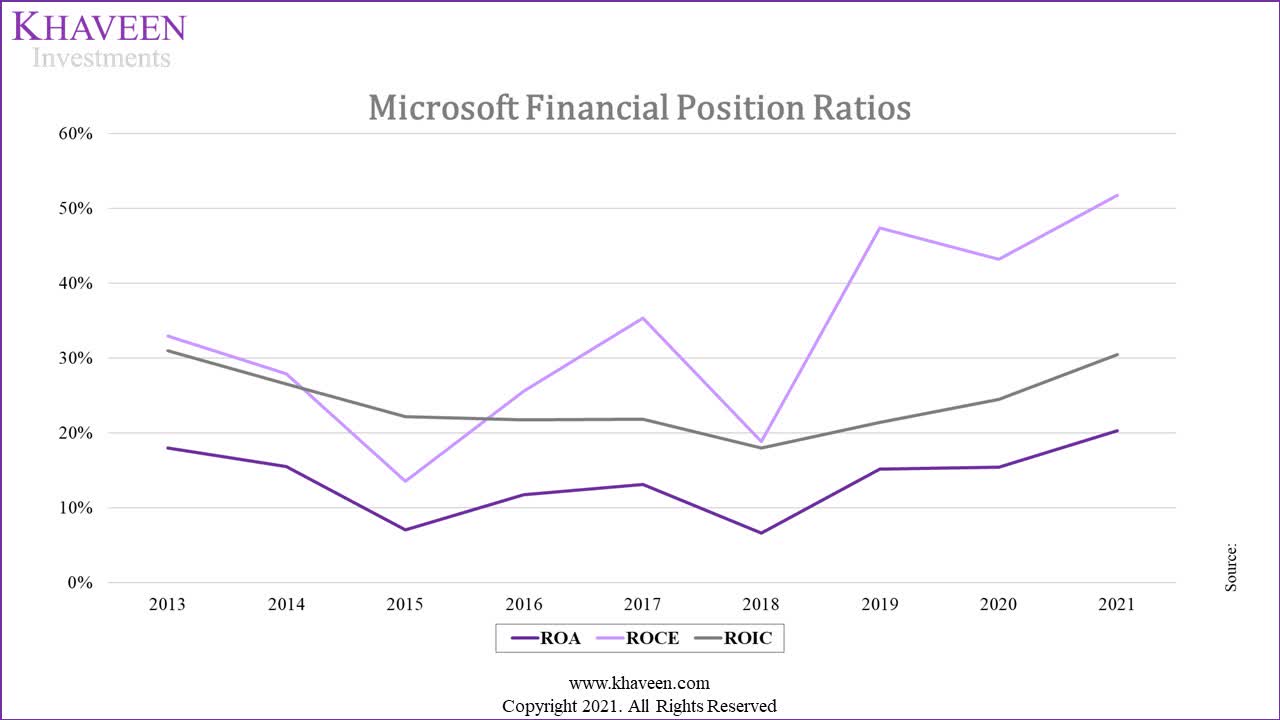
After Microsoft acquired LinkedIn for $26.2 bln in 2016, the growth of the Productivity and Business Processes segment returned to positive and continued to grow at an average of 16% from 2017 to 2021, as seen in the chart below. We believe this indicates that the LinkedIn acquisition could have provided a positive impact on Microsoft’s financials.
Microsoft, Khaveen Investments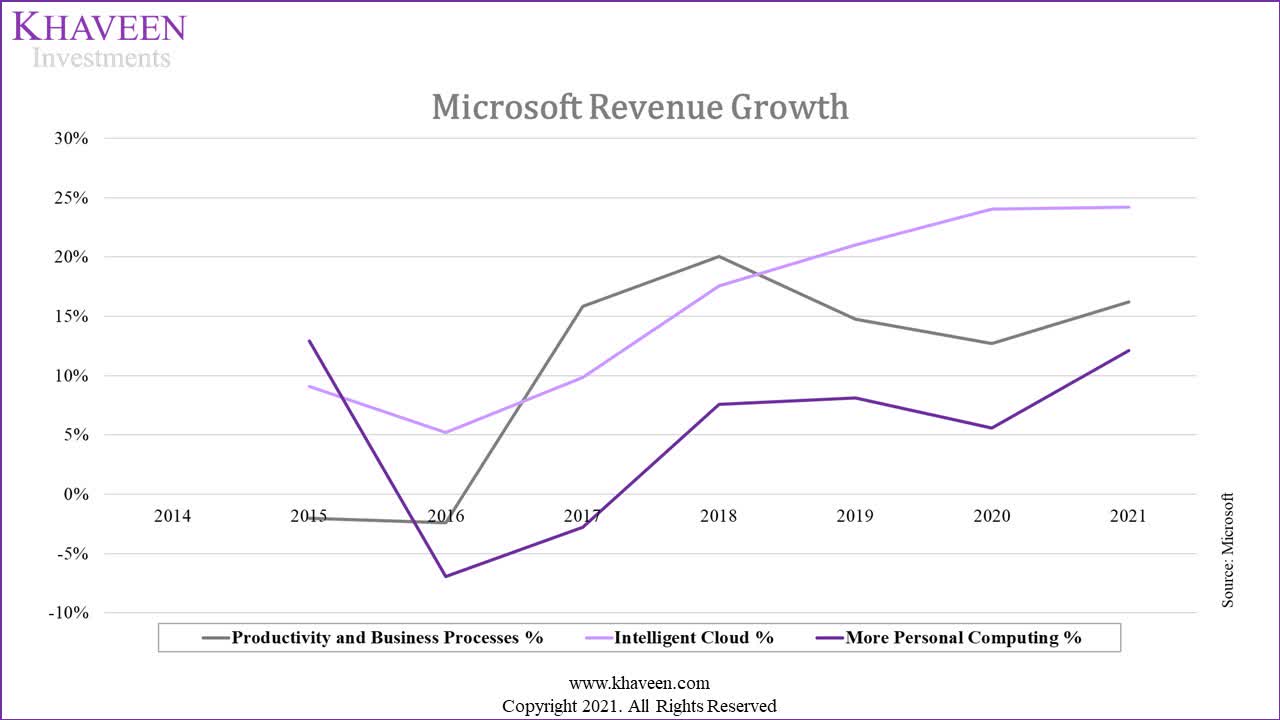
|
Microsoft Revenue Segment ($ mln) |
2014 |
2015 |
2016 |
2017 |
2018 |
2019 |
2020 |
2021 |
|
Productivity and Business Processes |
26,976 |
26,430 |
25,792 |
29,870 |
35,865 |
41,160 |
46,398 |
53,915 |
|
Productivity and Business Processes Growth % |
-2% |
-2% |
16% |
20% |
15% |
13% |
16% |
|
|
Intelligent Cloud |
21,735 |
23,715 |
24,952 |
27,407 |
32,219 |
38,985 |
48,366 |
60,080 |
|
Intelligent Cloud Growth % |
9% |
5% |
10% |
18% |
21% |
24% |
24% |
|
|
More Personal Computing |
38,460 |
43,435 |
40,410 |
39,294 |
42,276 |
45,698 |
48,251 |
54,093 |
|
More Personal Computing Growth % |
13% |
-7% |
-3% |
8% |
8% |
6% |
12% |
|
|
Others |
-338 |
– |
– |
– |
– |
– |
– |
– |
|
Total Revenue |
86,833 |
93,580 |
91,154 |
96,571 |
110,360 |
125,843 |
143,015 |
168,089 |
|
Total Revenue Growth % |
8% |
-3% |
6% |
14% |
14% |
14% |
8% |
Source: Microsoft, Khaveen Investments
Additionally, on the declining operating margin in the Productivity and Business Processes since 2014, the decline in 2017 and 2018 was due to LinkedIn’s contribution to operating expenses which include Research & Development expenses of 5.7%, Sales & Marketing expenses of 8.37% and General and Administrative expenses of 6.56% in 2017 and $1.5 bln of amortization of intangible assets in 2018. Meanwhile, the contribution of LinkedIn to its total revenue has increased from around 19% in 2021. With the gross margin percentage improvement in Office 365 Commercial and LinkedIn from 2019 onwards, we believe this could be the reason why the Productivity and Business Processes segment constantly remained as the segment with the highest operating margin.
|
Share of LinkedIn’s Revenues of Total Productivity & Business Processes Segment Revenue ($ mln) |
2018 |
2019 |
2020 |
2021 |
|
LinkedIn Revenue (‘a’) |
5,259 |
6,754 |
8,077 |
10,289 |
|
Productivity & Business Processes Segment Revenue (‘b’ |
35,865 |
41,160 |
46,398 |
53,915 |
|
LinkedIn Contribution % (‘c’) |
14.66% |
16.41% |
17.41% |
19.08% |
* c = a / b
Source: Microsoft, Khaveen Investments
Microsoft, Khaveen Investments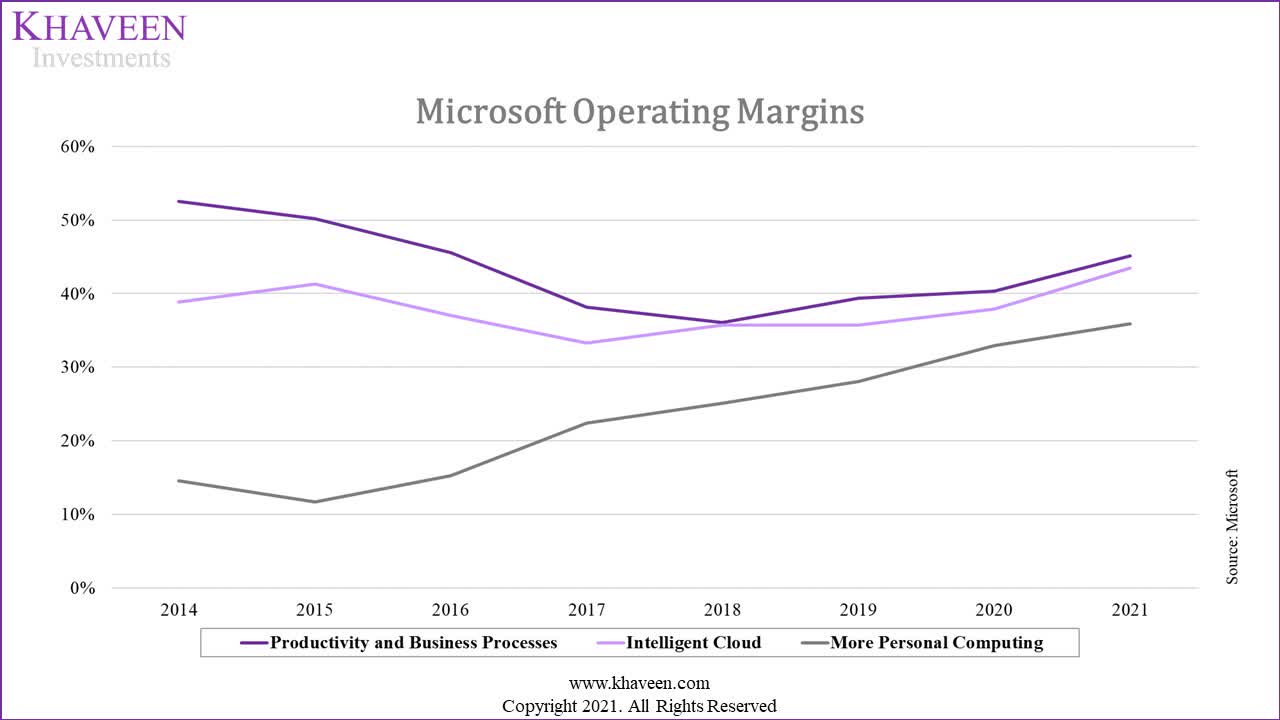
Risk: LinkedIn’s Exit from China
Apollo Technical, Microsoft, Khaveen Investments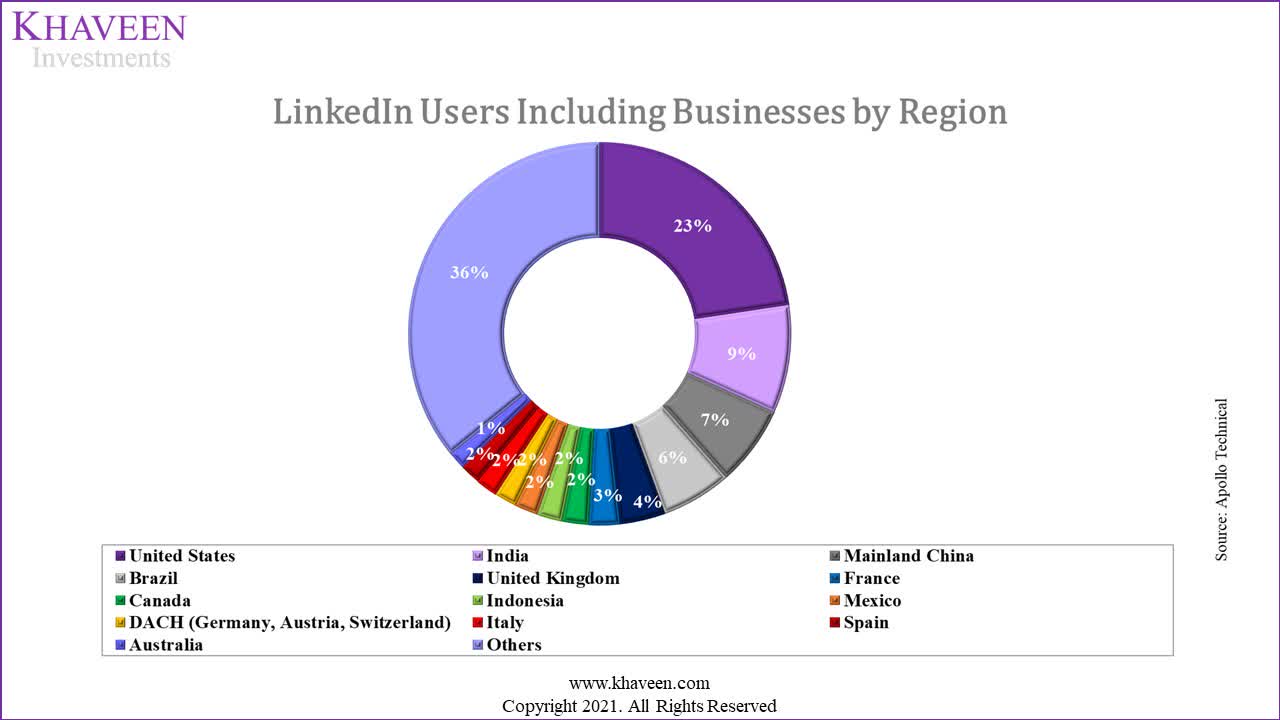
In 2021, LinkedIn had decided to exit the China market and cited a “significantly more challenging operating environment” in its decision which we believe could impact its growth. According to Apollo Technical, LinkedIn had 51 mln users in China which represented 7% of its total global user base of 756 mln. While the share of users in China is below 10%, China remains the third largest user base for LinkedIn following countries like the U.S. which accounted for 23% of users and India at 9% of total users. Although we believe the firm’s LinkedIn exit from China may pose a threat to its segment growth, we see LinkedIn’s user base as being well-diversified with users including businesses from more than 200 countries. The largest country of its user base, the U.S., represents just 23% of LinkedIn users.
Valuation
Driven by robust growth in its Productivity and Businesses segment and Cloud segment, the firm has maintained a steady average revenue growth rate of 13.09% over the past 5 years. The improving net margin indicates the ability of Microsoft to generate profits increasingly with an average of 28%.
Microsoft, Khaveen Investments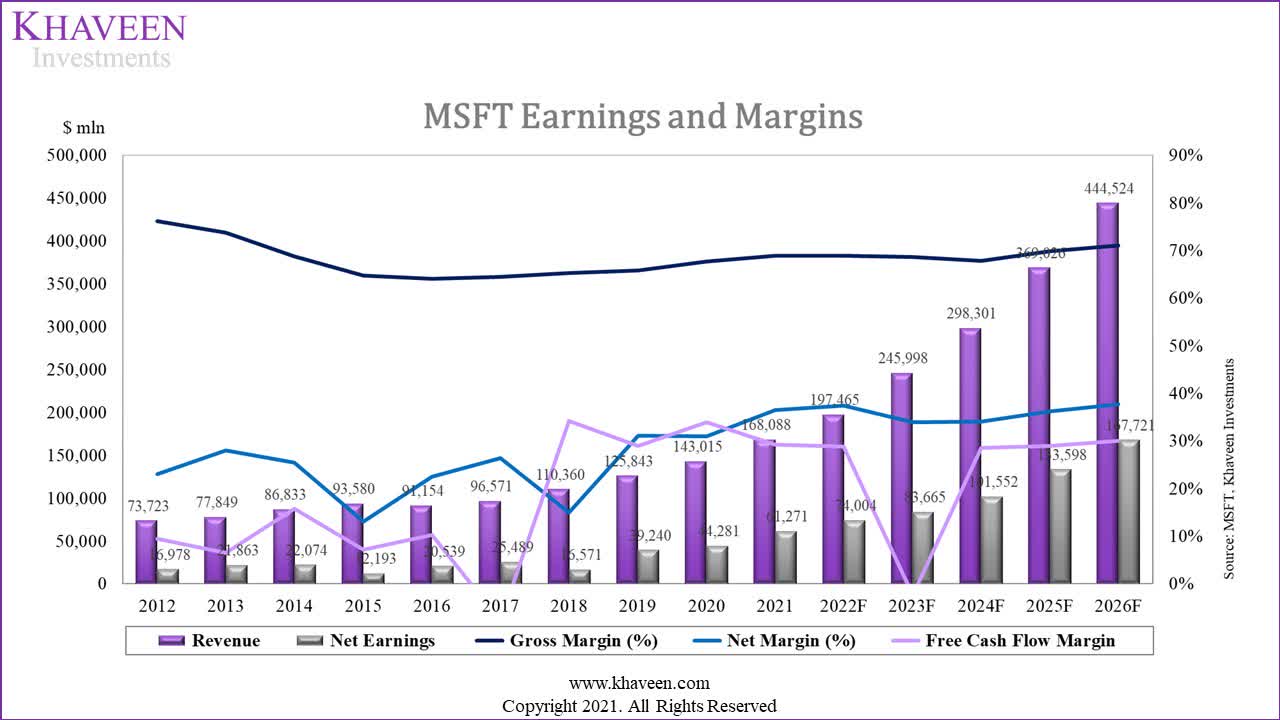
While Microsoft incurred more capital expenditure in 2017 due to LinkedIn’s acquisition which led to negative free cash flow, the company rebounded and continues to generate higher cash flow up to 2021. With lean business operations with low capex to sales, we forecasted its 5-year forward FCF margins to have an average of 23 % through 2026 accounting for the acquisition of Activision as covered in our previous analysis.
Microsoft, Khaveen Investments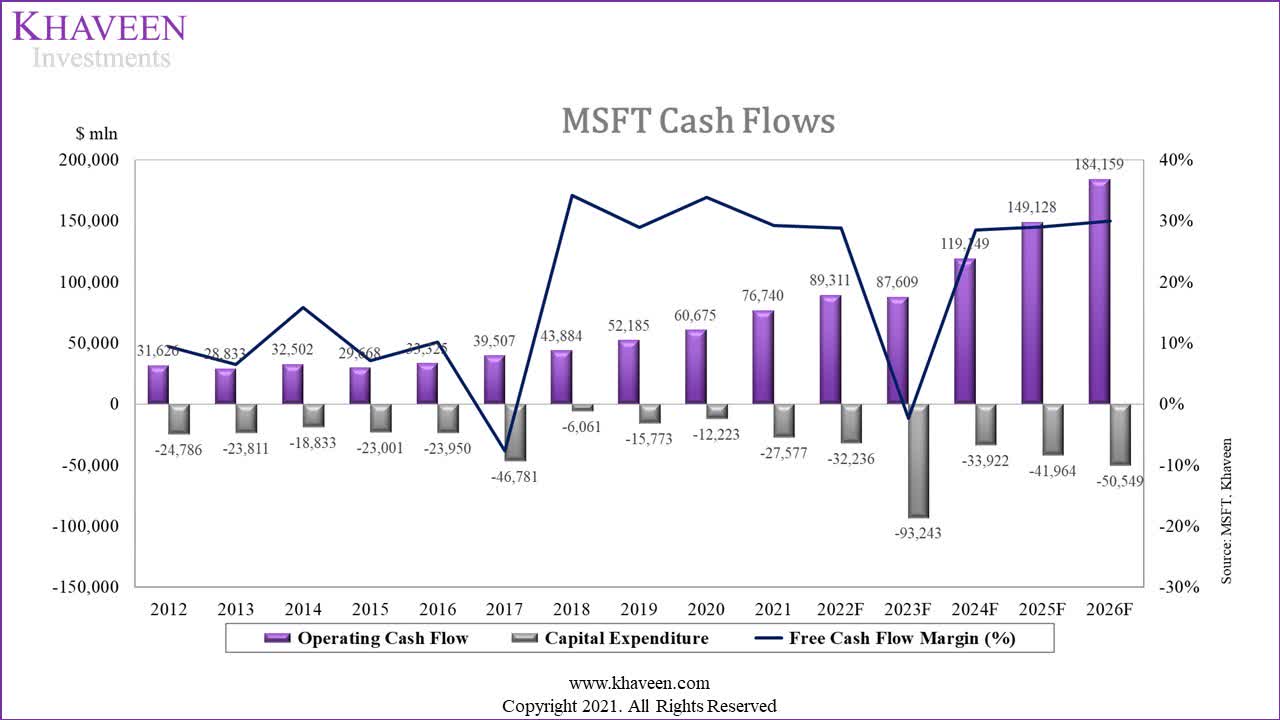
We updated our revenue projections for Microsoft through 2025 since our previous analysis of its planned acquisition of Activision Blizzard which we estimated its revenue and synergies contribution. For its Intelligent Cloud segment, we updated our forecast for its server products based on our forecast of Microsoft Azure from our Oracle analysis. Whereas for its Productivity and Business Processes segment, we updated our forecasted its Office products based on our projection of its share of the total global IT spending rising to 1.3% by 2026 growing at an average of 11.9% and LinkedIn at 22.9% based on user and ARPU growth as discussed above.
|
Revenue Projections ($ mln) |
2019 |
2020 |
2021 |
2022F |
2023F |
2024F |
2025F |
|
Server Products Revenues |
32,622 |
41,379 |
52,606 |
68,875 |
93,891 |
129,922 |
182,536 |
|
Server Products Revenues Growth % |
26.8% |
27.1% |
30.9% |
36.3% |
38.4% |
40.5% |
|
|
Office Products |
31,769 |
35,316 |
39,818 |
44,670 |
50,103 |
55,939 |
62,455 |
|
Office Products Growth % |
11.2% |
12.7% |
12.2% |
12.2% |
11.6% |
11.6% |
|
|
|
6,754 |
8,077 |
10,289 |
12,646 |
15,544 |
19,105 |
23,482 |
|
LinkedIn Growth % |
19.6% |
27.4% |
22.9% |
22.9% |
22.9% |
22.9% |
|
|
Dynamics |
2,637 |
3,005 |
3,808 |
4,402 |
5,089 |
5,883 |
6,800 |
|
Dynamics Growth % |
14.0% |
26.7% |
15.6% |
15.6% |
15.6% |
15.6% |
|
|
Windows Revenues |
20,395 |
22,294 |
23,227 |
25,311 |
25,879 |
26,774 |
27,684 |
|
Windows Revenues Growth % |
9.3% |
4.2% |
9.0% |
2.2% |
3.5% |
3.4% |
|
|
Other Segments |
31,666 |
32,944 |
38,340 |
41,561 |
45,134 |
49,100 |
53,507 |
|
Other Segments Growth % |
4.0% |
16.4% |
8.4% |
8.6% |
8.8% |
9.0% |
|
|
Total Revenues |
125,843 |
143,015 |
168,088 |
197,465 |
235,640 |
286,724 |
356,465 |
|
Total Revenues Growth % |
13.6% |
17.5% |
17.5% |
19.3% |
21.7% |
24.3% |
|
|
Activision Acquisition Revenue |
9,873 |
11,059 |
12,561 |
||||
|
Growth % |
12.0% |
13.6% | |||||
|
Synergies |
484 |
519 |
|||||
|
Total Revenue (Incl Activision) |
125,843 |
143,015 |
168,088 |
197,465 |
245,998 |
298,301 |
369,026 |
|
Growth % |
13.6% |
17.5% |
17.5% |
24.6% |
21.3% |
23.7% |
Source: Microsoft, Khaveen Investments
We used the DCF Valuation for Microsoft as we expect the company to continue to have strong cash flows. Based on the revenue projections and the industry EV/EBITDA with a discount rate of 8.2%, our model shows an upside of 92%.
Khaveen Investments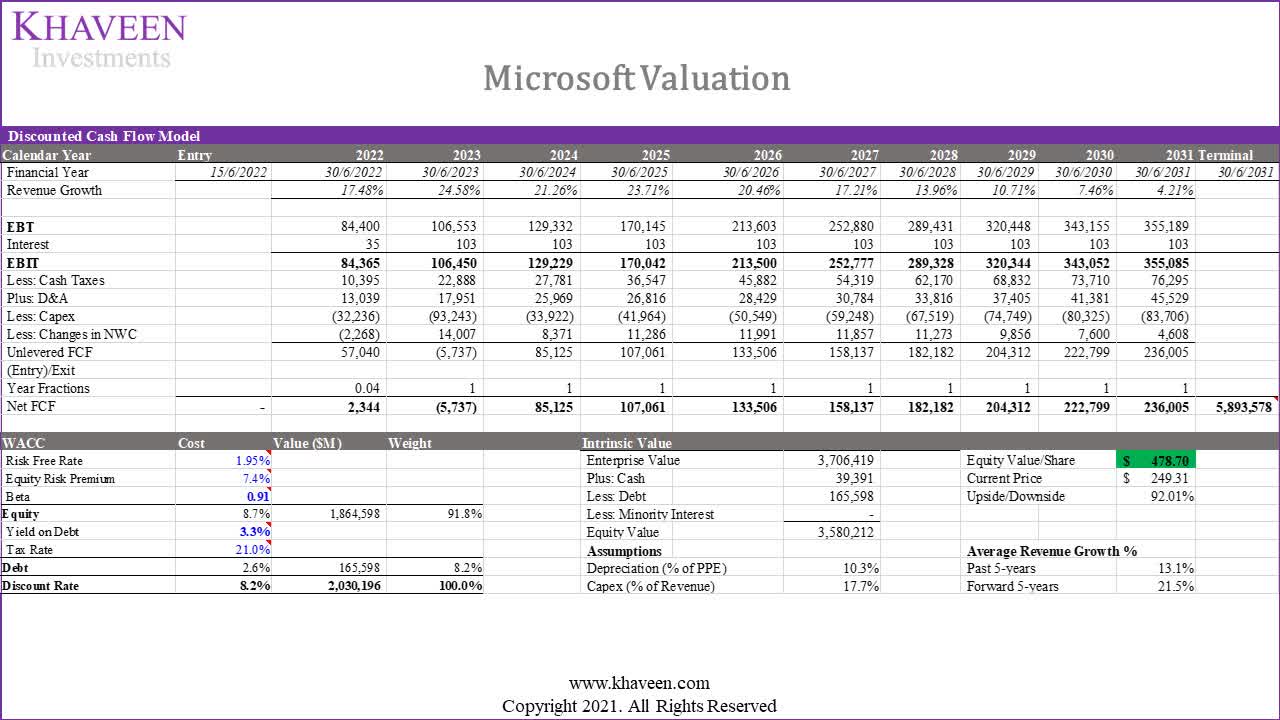
Verdict
We focused our analysis on Microsoft’s Productivity and Business Processes segment which we expect to grow based on the continuous ventures and development of its products. In productivity software, we compared the company’s flagship Microsoft 365 products against competitors in a positioning map by its pricing and features where we see Microsoft having the cost leadership against competitors with its comprehensive solution with a plethora of features and functionalities.
Based on the strong growth of the Productivity and Business Processes segment including Office products and LinkedIn, we expect that Microsoft will continue to maintain leadership in its productivity and business processes segment. Thus, we revised our revenue projections based on our forecasted segment revenues for LinkedIn at a higher average rate of 22.9% through 2026. In total, we see its revenues growing at a 5-year forward average rate of 21.5% which is higher than our previous analysis (18.7%), and obtained an upside of 92% based on DCF analysis. Overall, we rate the stock with a Strong Buy recommendation at a target price of $478.70.
Be the first to comment