

Crude Oil Talking Points:
- Crude oil prices have snapped back after an astounding run to start the month of March.
- WTI prices have since scaled back-below the 100 psychological level, with an approximate 26% pullback from the high set two weeks ago.
- The recent concern is depression of demand after China has started to lockdown portions of the country due to rising Covid numbers.
- This pullback brings a possible sense of relief for consumers, but is it sustainable?
- The analysis contained in article relies on price action and chart formations. To learn more about price action or chart patterns, check out our DailyFX Education section.
Crude oil prices launched into a parabolic-like move to start off the month, helping WTI to set a fresh 13-year high after temporarily touching above the 130.00 level, albeit briefly. Since then prices have snapped back aggressively with a 26% pullback.
With half of March now in the books the monthly chart for WTI has an elongated wick sticking out from prior years’ price action, highlighting just how pensive that theme has been in oil prices.
WTI Crude Oil Monthly Price Chart
Chart prepared by James Stanley; CL1 on Tradingview
Crude Oil: Supply Constraints v/s Demand Depression
While most are starting to see this price pop show up at the pump, the bigger question here is the trajectory of oil prices and there’s a possible driver on either side of the coin. On the supply side, there’s the prospect of continued disruption to global oil production which, of course, could impact prices. But, on the demand side there’s also concern as China has recently started locking down portions of the country as Covid numbers have risen.
How much this balances out remains to be seen and the Covid theme is still developing in China, so we may not even have a true scope of how much demand will be impacted at this point.
From the weekly chart we can get a better view of this recent reversal while also focusing in on some key levels of interest.
WTI Crude Oil Weekly Price Chart

Chart prepared by James Stanley; CL1 on Tradingview
Crude Oil – Next Supports
At this point WTI has essentially reversed the entirety of the early-March breakout and we’re back to the point of origination. So anything lower will be reflecting a net loss on the Monthly chart, and if the monthly bar closes in that manner, with an extended wick atop a bearish candle, there would be further scope for a deeper reversal.
We’re not quite there yet as that monthly bar still has two-plus weeks to go, and for now there’s support potential at a few key spots on the chart.
At this point, prices have been dropping aggressively so bullish strategies would be, in essence, reversal scenarios of the short-term move. And there’s a few such spots to look for such a theme.
My next support is around 91.77 which is a prior swing low from late-2013 trade. This level gave a bit of resistance on the way up during the recent breakout. Below that is another spot of interest around 84.05, which was a prior swing-low-turned-resistance. Another similar spot exists around 76.90 and there’s a last drop of support on my chart at 66.60.
WTI Crude Oil Daily Price Chart
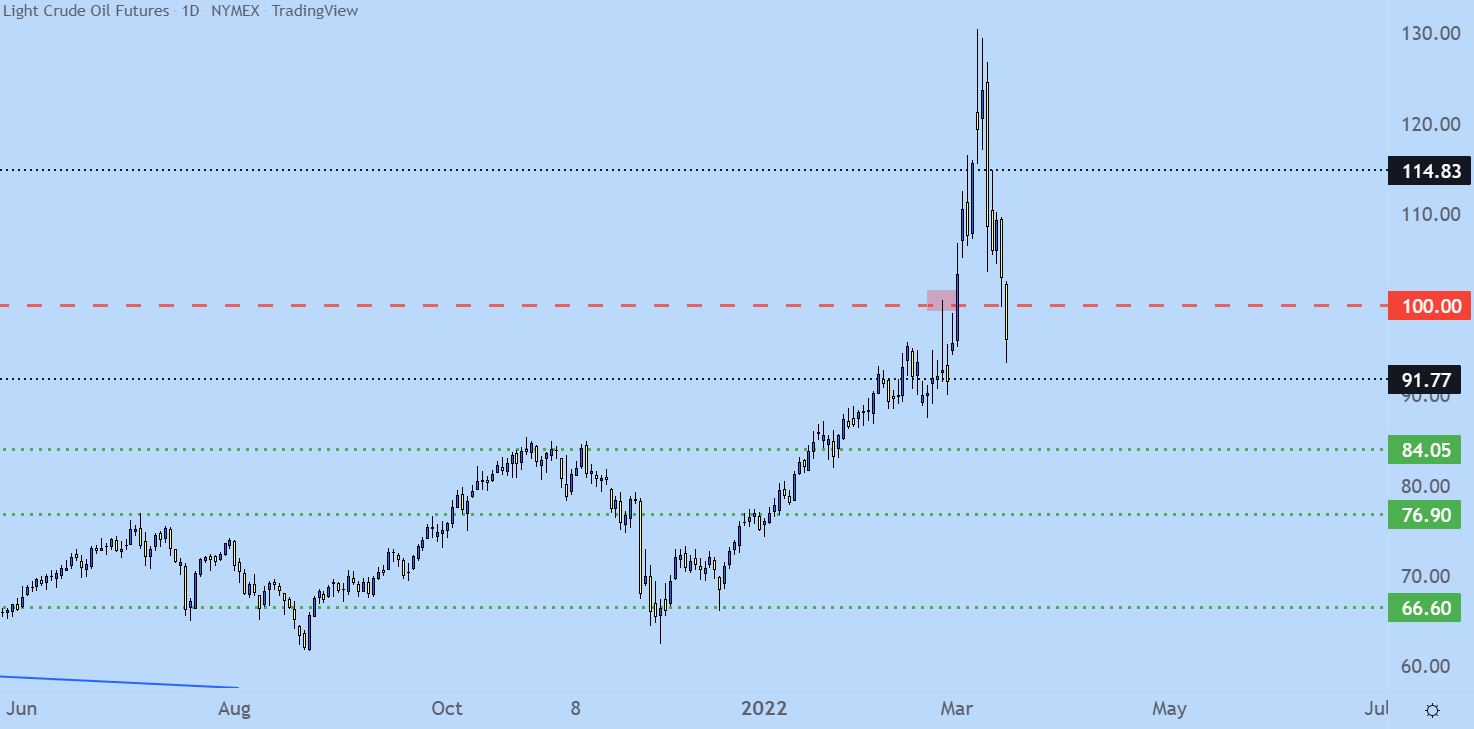
Chart prepared by James Stanley; CL1 on Tradingview
— Written by James Stanley, Senior Strategist for DailyFX.com
Contact and follow James on Twitter: @JStanleyFX
Be the first to comment