

Chip Somodevilla
Thesis
I have been cautioning readers about the valuation risks of Microsoft (NASDAQ:MSFT) since I first started writing for Seeking Alpha more than a year ago. For example, my first article on MSFT was published on August 9th, 2021. At that time, it was trading at $289.75, right before it peaked and started its decline. The article, entitled “3 Charts To Put MSFT’s Valuation Into Perspective”, cautioned readers about the limited upside at that point. My view on it has essentially remained the same since then: it is undoubtedly a great business and I see no quality risk at all. But I see considerable valuation risks.
Until now. I begin to see its valuation risks decreasing with a combination of the price correction (by more than 20% as you can see from the chart above and also its earnings growth since then.
Source: Seeking Alpha data
Especially if you are like Buffett, who is not afraid to apply risk-free interest rates as the discount rate for perpetual compounders like MSFT. I re-read some of his annual letters recently and came across the following paragraph from the 1996 BRK annual meeting (the emphases were added by me):
… But we believe in using a government bond-type interest rate. We believe in trying to stick with businesses where we think we can see the future reasonably well — you never see it perfectly, obviously — but where we think we have a reasonable handle on it.
If you say I’m going to stick an extra 6 percent in on the interest rate to allow for the fact — I tend to think that’s kind of nonsense. I mean, it may look mathematical. But it’s mathematical gibberish in my view.
You better just stick with businesses that you can understand, use the government bond rate. And when you can buy them — something you understand well — at a significant discount, then, you should start getting excited.
The key takeaway is twofold in my mind. First, for a business that you can see its future earnings well enough, do not be afraid to apply risk-free rates as discount rates. Second and equally importantly, for a business that you do not understand well to see its future earnings well, massaging the discount rates is just mathematical gibberish (and it can get you any answer you want).
And in the remainder of this article, I will elaborate on why MSFT deserves the application of risk-free rates as its discount rates and how the end results show a fair valuation now.
CAPM and profitability
As a corollary of the above key takeaways, my view is that Buffett does not think in terms of other more “accepted” discount rates like the capital asset pricing model (“CAPM”). So here I am going to start with the CAPM model and see why it does not make sense to apply the CAPM in MSFT’s case. The CAPM model has been detailed in my earlier articles and the chart below is programmed based on these steps:
This analysis uses the Weighted Average Cost of Capital (“WACC”) to evaluate its cost of capital. The WACC is calculated as:
WACC = portion of equity * cost of equity + portion of debt * cost of debt * (1- tax rate)
We already have all the inputs above for the WACC calculation from the capital structure evaluation. So the next chart directly shows the WACC results. Note that the cost of equity is calculated using the Capital Asset Pricing Model (“CAPM”), considering the volatility of the stock (the beta) and the risk-free return (the 10-year treasury bond yield).
As seen, the cost of equity for MSFT has been quite stable between 8.8% to 9.6% in the past decade based on this model. It is a bit lower than the typical 10% used in practice due to its lower volatility (I assigned a beta of 0.95 based on Seeking Alpha data) and its lower borrowing case with its superb credit rating.
Source: author based on Seeking Alpha data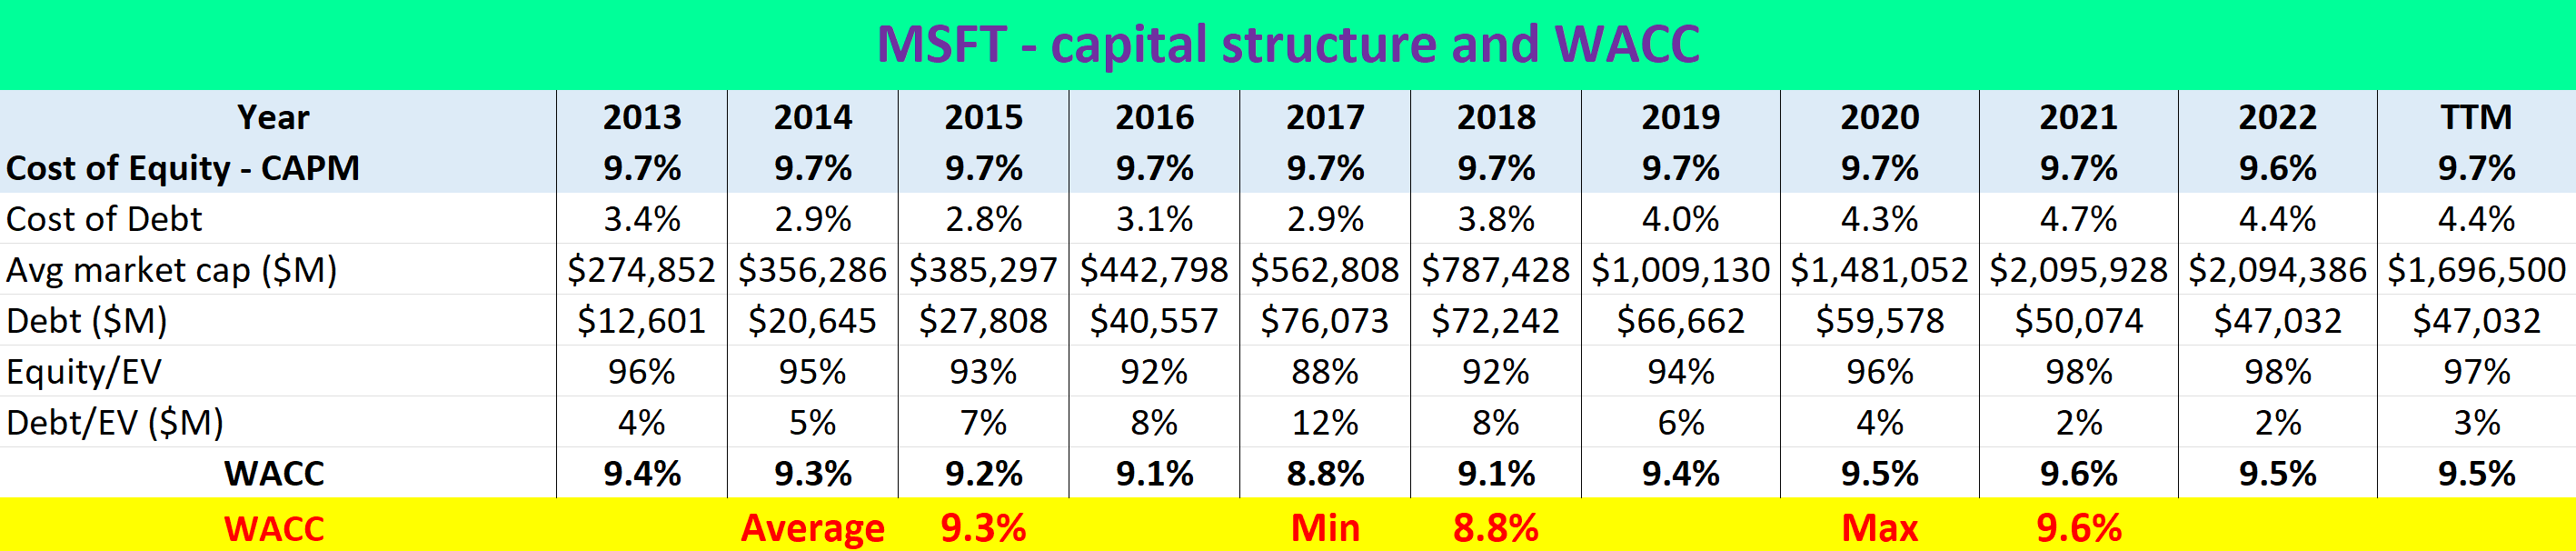
The next chart also compares the WACC against the return on capital employed (“ROCE”) and return on equity (“ROE”) for MSFT. And this comparison illustrates why MSFT deserves royal treatment on the discount rates and also the limitations of common metrics like ROE and WACC. In particular,
- As seen, its ROE has been consistently exceeding its WACC, a classical sign of a business with a stable and strong moat. Its ROE has been on average 28.5%, far above its average WACC of around 9.3%.
- Then even the ROE itself underestimates its profitability. The ROCE is more important and fundamental in my view as detailed in my blog article because the ROCE considers capital ACTUALLY employed. While in MSFF’s case, a large part of the equity is not needed in its actual operation (such as idle cash). To wit, its ROCE has been on average 67.3%, substantially and consistently higher than both the average ROE and WACC.
- As a result, its superb ROCE dwarfs any variation in the WACC, which renders the details in the WACC model irrelevant.
Source: author based on Seeking Alpha data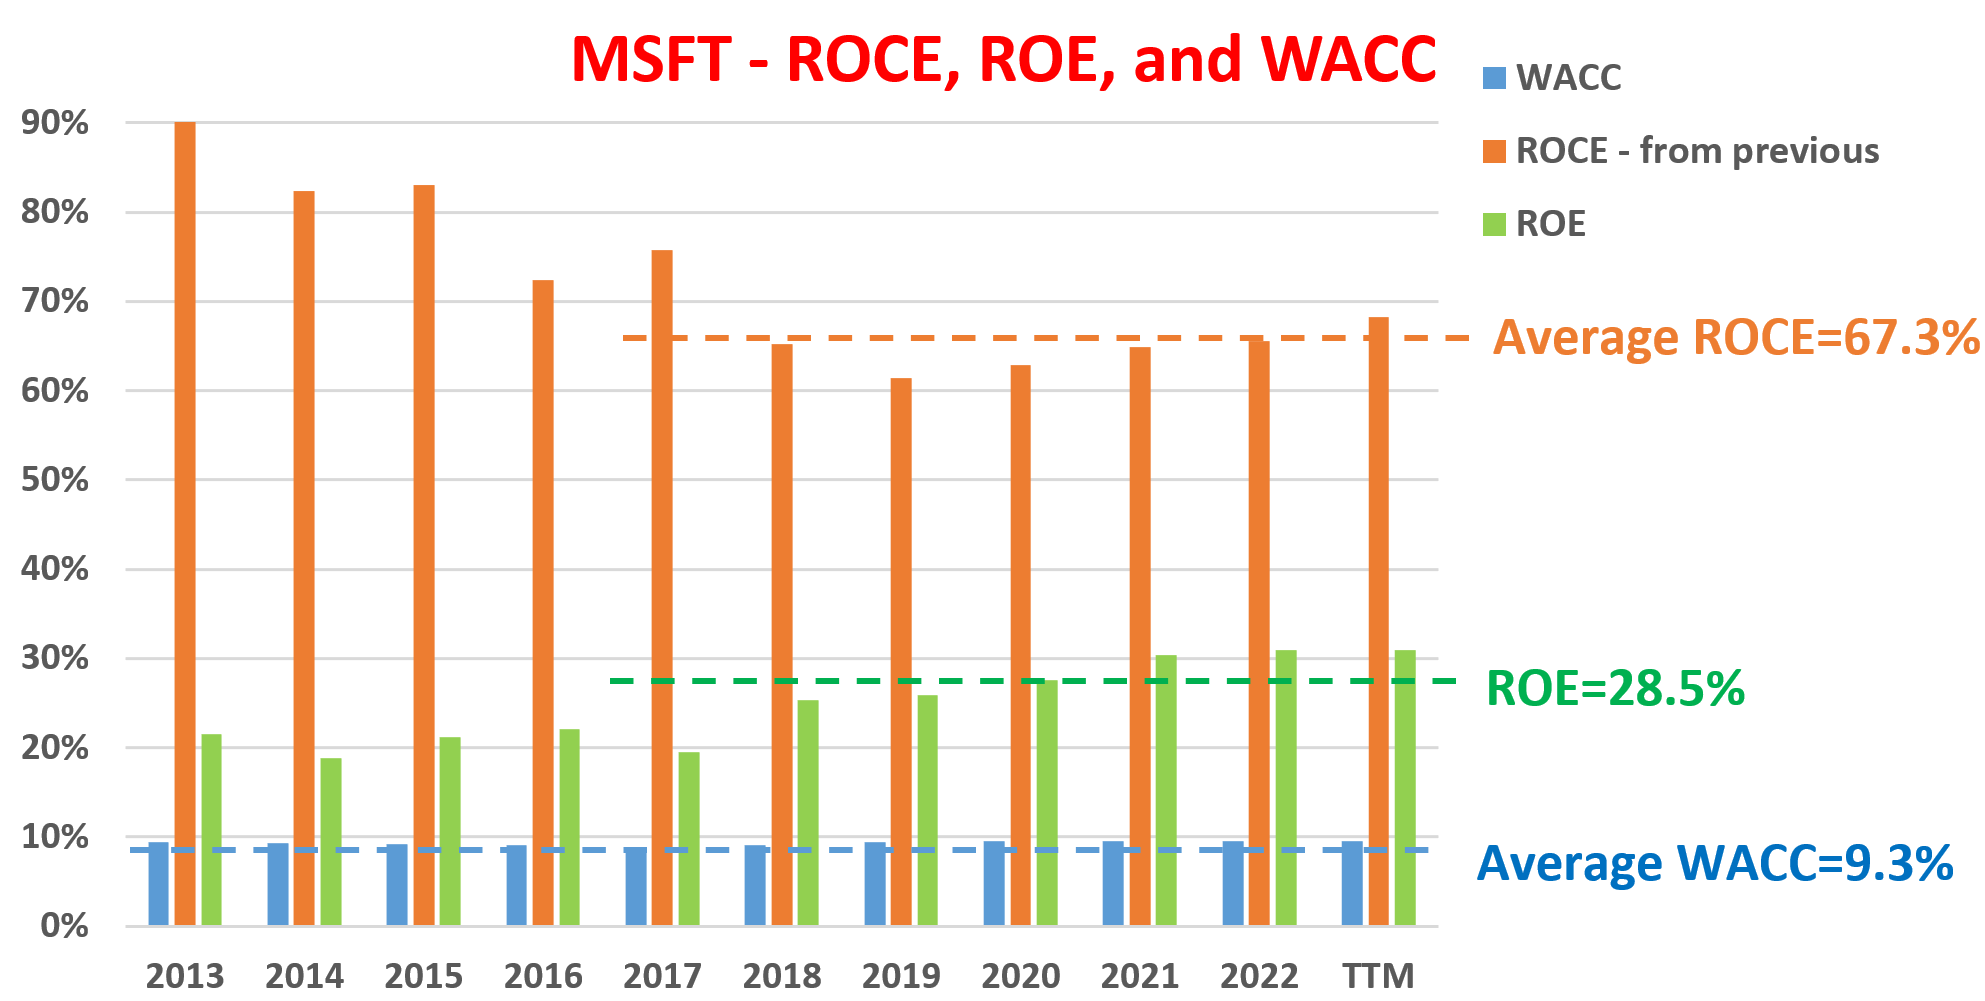
Valuation and expected return
Based on the above, here I will use the discounted dividend model (“DDM”) given MSFT stable dividends. And the key assumptions here are:
- I will apply a long-term risk-free rate of 4.5% as the discount rate, which is consistent with the Fed’s current dot-plot and also consistent with average 10-year treasury rates in the long term (say over a 30 to 50 years period spanning a macro debt cycle).
- By invoking the DDM model in the first place, I am assuming its dividend represents its dispensable owners’ earnings. And more specifically, I will use its TTM dividend rate of $2.48 per share in the analysis.
- I will estimate its terminal dividend growth rate by the product of its average ROCE (67.3% as shown above) and its reinvestment rates (assumed to be 5% based on its long-term historical average). To wit, the results turned out to be 3.38% (67.3% ROCE x 5% reinvestment rate = 3.38% perpetual growth rates).
With the above inputs, the DDM model shows its fair value to be $220 ($2.48/ (4.5% – 3.38%)). Compared to its current price of $226 as of this writing, it is now trading quite close to its fair value.
In terms of total returns, investors can expect a long-term return in the upper-single-digit around 8% per annum, a quite solid return given its first-rate financial strength and safety. The total returns consist of 3.38% of growth as just mentioned and about 4.5% of owners’ earnings yield (at an FY1 of 22.5x).
Risks and final thoughts
MSFT faces a range of risks, both macroscopic risks general to the entire economy and also risks specific to itself. And all such risks have been detailed by other SA authors and also my other articles. So here I will just focus on the risks specific to the particular approach presented in this article.
The main risk is the thin (or lack of) margin of safety as seen above. The DDM shows a fair value of $220 even with the use of the risk-free rate as the discount rate, leaving no margin of safety given its current price of $226. A comparison against Apple (AAPL), a stock Buffett does hold, further highlights the lack of margin of safety. As seen from the chart below, AAPL’s ROCE is on average over 100% in recent years. So assuming the same 5% reinvestment rate, AAPL could maintain a perpetual growth rate of over 5% (100% ROCE * 5% reinvestment rate = 5% perpetual growth rate). Of course, when the growth rate is higher than the discount rate (if we keep using 4.5% risk-free interest rates as the discount rate), any valuation is justifiable IN THEORY. But of course, in practice, I won’t pay any price and I would only interpret the gap as a sign of a large margin of safety. And Buffett has already told us (if you recall from his earlier quote and the emphases were added by me):
“You better just stick with businesses that you can understand, use the government bond rate. And when you can buy them — something you understand well — at a significant discount, then, you should start getting excited.”
Source: author based on Seeking Alpha data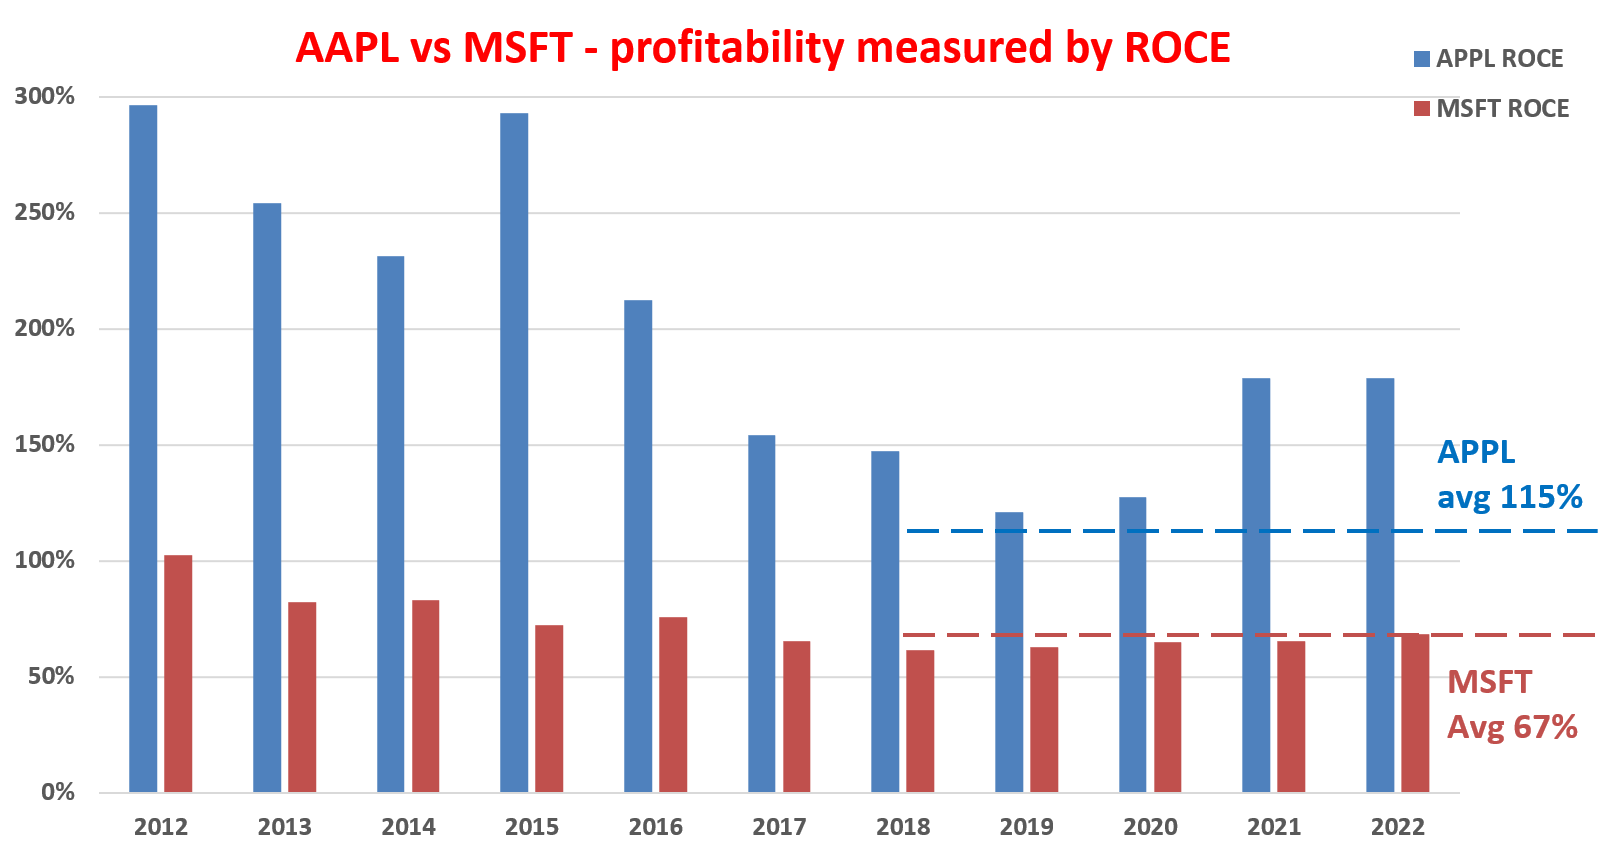
Be the first to comment