

Pgiam/iStock via Getty Images
Micron Technology (NASDAQ:MU) is set to report earnings after the market close on Aug. 29. Shares of Micron have been nearly halved in 2022 as memory prices have plunged. The stock has been subject to downgrades at numerous firms, including Mizuho, amid concerns on demand dynamics.
Micron pre-announced its August quarterly financials on Aug. 9, 2022. It should provide analysts/investors/traders some visibility on Thursday.
According to the company’s 8-K and signed by Mark Murphy, Executive Vice President and Chief Financial Officer:
“Recently, due to macroeconomic factors and supply chain constraints, we have seen a broadening of customer inventory adjustments. As a result, our expectations for CY22 industry bit demand growth for DRAM and NAND have declined since our June 30, 2022 earnings call, and we expect a challenging market environment in FQ4 22 and FQ1 23.
To address the near-term environment, today we are announcing new FY23 wafer fab equipment (WFE) capex reductions adding to the WFE capex reductions discussed in our June 30 earnings call, and now expect FY23 total capex to be down meaningfully versus FY22. “
Succinctly summing up the current macroeconomic environment and the Fed’s “take no prisoner” attitude, BMO Capital Markets economists reported:
“Dow industrials fell into its first bear market in more than two years on Monday, joining the S&P 500 index and Nasdaq Composite which have already been in one; the dollar added to more than 20-year highs, wreaking havoc around the world; and lending conditions tightened further as more Treasury yields rose above or touched 4% – the level some see as sending shivers through investors.
Financial markets failed to find positive momentum on Monday, adding to Friday’s weekly losses in U.S. stocks. Meanwhile, the 10-year Treasury yield reached its highest level since April 2010, at 3.878%, as 2- and 3-year rates climbed to 4.3% and 4.4% respectively.”
I discuss in this article several important issues that investors need to consider, presenting a deep dive into these issues revealing some metrics that are not obvious. In addition, Micron’s pre-announcement notes that “we expect a challenging market environment in FQ4 22 and FQ1 23.” At issue is whether this challenging market environment will extend beyond FQ1 23. This too will be discussed in this article.
Financial Metrics
Micron’s Share Price Compared to the S&P
While sentiment has been weak for MU, specifically since stock price is down 15% in the past one-month period, share price had held up well when compared with the S&P Technology sector (^IXT), as shown in Chart 1.
So, for most of the past year period, MU shares outperformed the S&P but underperformed since the last earnings call. The S&P is down 21% versus 32% for MU, but delta is attributed to the last earnings call, which it suggests was due to a mis-step by MU in not lowering F4Q guidance during a time when consumer electronics products sales were dropping.
Chart 1
YCharts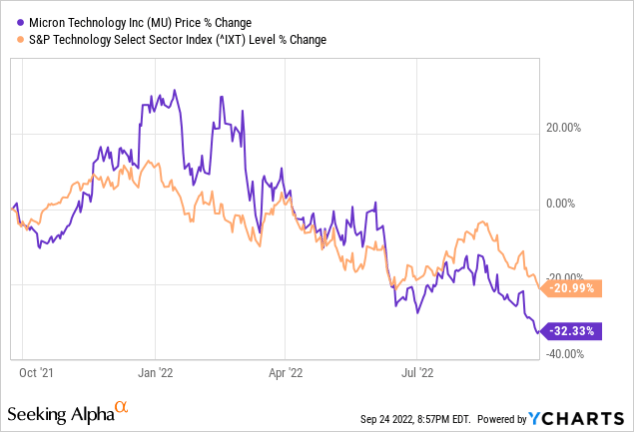
Micron’s Share Price Compared to Peers
Homing in on MU’s peers, which are part of the S&P above, Chart 2 shows that despite share erosion in the past two months, MU’s shares have outperformed many of its peers in the past one-year period. MU (-32.33%) outperformed Advanced Micro Devices (AMD) (-35.98%), Taiwan Semiconductor (TSM) (-36.42%), and Applied Materials (AMAT) (-40.27%), and slightly underperformed Marvell (MRVL) (-31.76%).
Chart 2
YCharts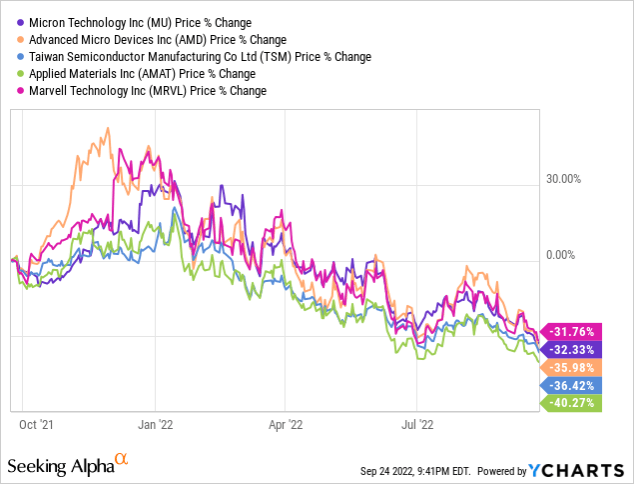
Data show several important observations. The most important is a comparison of business models,
- MU makes memory chips,
- TSMC makes logic chips for other companies,
- AMAT makes processing equipment,
- AMD designs chips made by TSMC, and
- MRVL makes logic chips for its own use.
In other words, the only commonality among these companies is that they’re in the semiconductor industry.
Share price spread is just 8.5% after a one-year period, which is astonishing. One possibility is that investors/traders buy/sell on a sector base without intimate knowledge of the individual stocks. This is substantiated in Chart 3 above, showing that when MU reported F3Q earnings on June 30, all the shares were similarly impacted.
Macroeconomics A Significant Factor
There’s also a correlation between the 10-year Treasury rate and MU share price. As seen in Chart 3, since 12/17/21, the 10-year Treasury rate has increased while MU share price has decreased starting on 12/27/21. Treasury yields have climbed to multi-year highs as interest rates rise.
We also see that on 6/16/22, the MU reached a low after the 10-year Treasury rate reached a peak on 6/14/22.
This relationship has been extremely strong in 2022. As you can see in Chart 3, the sharp ascent in the 10-year throughout this year has directly led to a strong drop in tech stocks.
Chart 3
YCharts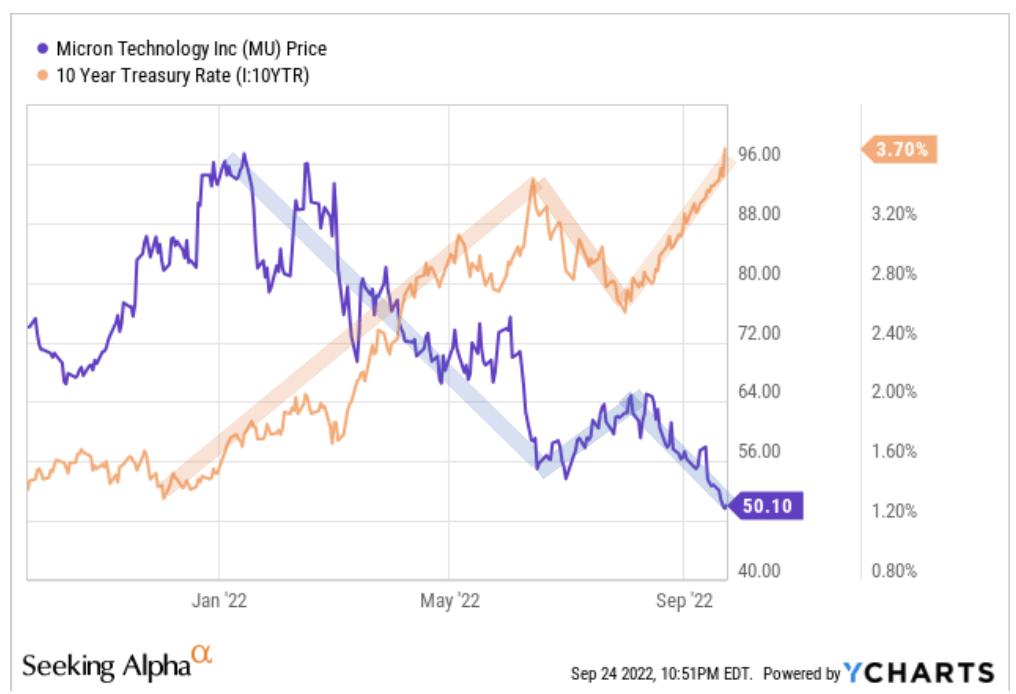
Macro Factors Are Not Just Affecting Micro
Kevin Noh, Chief Marketing Officer of SK Hynix, noted in its Q2 2022 earnings call he expected a slowdown in server memory demand due to inventory adjustments in the 2H of the year.
Micron’s CEO Sanjay Mehrotra reported inventory issues in its F3Q earnings call:
“Data center end demand is expected to remain strong in the second half of calendar 2022, driven by robust cloud capex growth. Despite the strong end demand, we are seeing some enterprise OEM customers wanting to pare back their memory and storage inventory due to non-memory component shortages and macroeconomic concerns.”
Inventory adjustments at Micron and SK Hynix are tremendously important. Data center is the largest market for memory and storage today, and inventory corrections will be a strong headwind for Micron. Its F3Q data center revenue grew by a double-digit percentage sequentially and well over 50% year-over-year.
The grim economy has broadened from a consumer electronics (smartphone, PC) issue to the data center, and to industrial and automotive markets. Micron is reacting by adjusting capex spend, which will keep chip supply in check by not expanding capacity.
Mehrotra noted:
“Additionally, we are planning for a reduced level of bit supply growth in fiscal 2023 and will use inventory to supply part of the market demand next year. This approach will enable us to reduce wafer fab equipment CapEx for fiscal year 2023 versus our prior plans, and we now expect our fiscal 2023 wafer fab equipment capex to decline year-over-year.
Capital expenditures were $2.5 billion during the quarter. We expect fiscal 2022 CapEx to be approximately $12 billion.”
CFO Mark Murphy noted:
“We’re looking to reduce utilization on some older nodes to maintain supply and drive capex for use and shift production to more cost-effective nodes.
Just to be specific, we’re talking about WFE for manufacturing, and that’s what I was addressing would go down year-over-year. We did not commit to going down year-over-year on construction, nor on technology development.”
Investor Takeaway
Table 1 presents my analysis of Micron’s capex spend between 2019 (top row) and following its guidance on lowering capex following the slowdown in consumer electronics products that has impacted the company.
Table 1 also shows that since the beginning of 2022 when Micron provided guidance (“old”) Micron increased capex spend from planned $11.3 billion in 2022 to 11.8 billion. Now, Micron will reduce capex by 20% in 2023 (bottom row). As the CFO noted, the capex cut will be for equipment.
The Information Network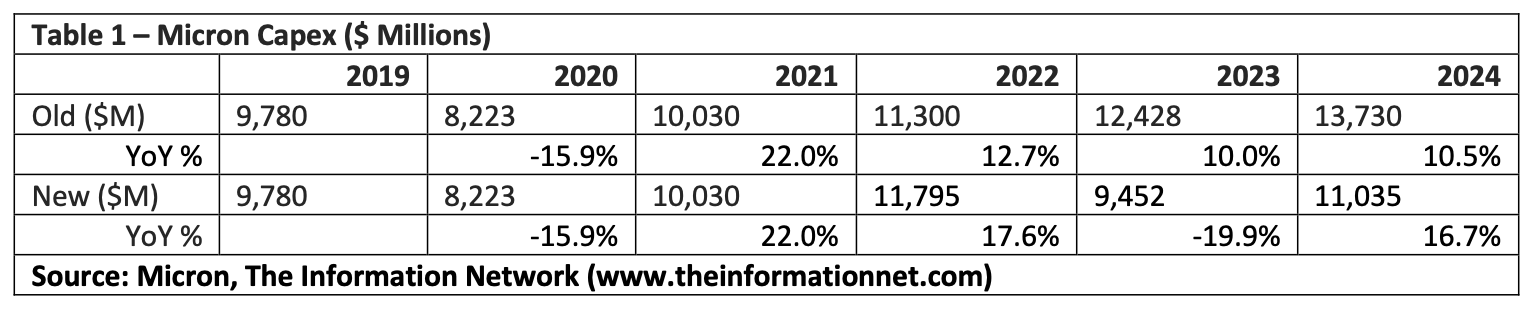
Can Micron Reduce Level of Bit Supply?
Micron revised its industry bit demand expectations lower for 2022,
- Expecting DRAM bit demand to increase just mid- to high-single digits, which is below long-term growth of 17%.
- Expecting NAND to increase low- to mid-teen digits, which is below long-term growth of 28%.
Micron, and peers, got to this point of higher than demanded memory growth by not judiciously monitoring capex, which was the cause of the memory crash of 2019. I cautioned investors about this in several of my Seeking Alpha articles in 2017 and 2018.
But the process of reducing inventory is difficult:
- Tech migration will raise capacity 12-13%
- Reduced capex will lower capacity growth to 8-9%
- Reduced utilization rates will lower growth to 4-5%
Micron raised its supply/demand ratio not only by increasing capex but by increasing technology migration to be the leading DRAM and NAND supplier on a technology basis. While being the technology leader is a plaudit for Micron, it is counterproductive when trying to reduce inventory, as transitioning to a new node increases bit density.
Capex spend cuts will negatively impact equipment companies. Consumer electronics products contain memory chips, which has been impacting memory companies. But they’re also filled with logic and processor chips, which means a strong impact on Applied Materials (AMAT) with greatest exposure to foundries/logic, and Lam Research (LRCX), according to our report entitled “Semiconductor Equipment: Markets, Market Share, Market Forecasts.”
On Sept. 8, 2022, I wrote a Seeking Alpha article entitled “Micron: Memory Chips Won’t Recover Until 2024.” In the three weeks since the article, the Fed has tightened another 75 basis points and the S&P has dropped 8%.
Macroeconomics is a key factor in the inventory problem facing Micron. In Chart 4, I show the dramatic rise of the US Inflation Rate over a five-year period that started expanding rapidly at the beginning of 2021 (blue line). It also shows the US Index of Consumer Sentiment (orange line) and the inverse relationship between the two.
Consumer Sentiment is an economic indicator that measures how optimistic consumers feel about their finances and the state of the economy. And that’s the key issue of this memory downturn. As prices have risen, consumers had to choose between food, gasoline, or electronic products.
Inflation has dropped as gasoline prices have dropped on less demand and emptying the strategic reserves, resulting in an increase in Consumer Sentiment.
Chart 4
YCharts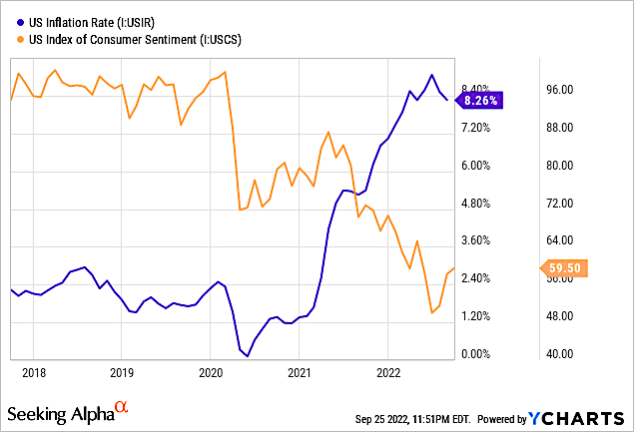
How Long Will the Pain Last?
“Even with the likelihood that inflation has peaked, inflation will still remain elevated for some time, as supply chain issues persist and there is still plenty of instability with the Ukraine war, which has caused significant swings in energy prices,” says Zach Stein, Chief Investment Officer at Carbon Collective, an investment advisory firm.
In Chart 5, I show Current inflation at 8.26% and its dramatic rise over the past three-year period.
I also show US One-Year Ahead Inflation Expectations is at 5.75%, compared to 6.22% last month and 5.18% last year. This is higher than the long-term average of 3.25%.
Finally, US Three-Year Ahead Inflation Expectations are at 2.76%, compared to 3.18% last month and 4.00% last year. This is lower than the long-term average of 2.99%.
Chart 5
YCharts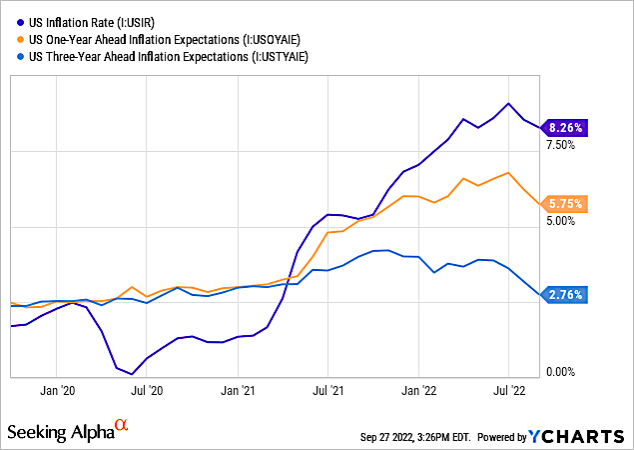
The one-year outlook, in addition to a down stock market, according to the NY Fed in August 2022 Survey of Consumer Expectations are:
- Expectations about year-ahead price changes for food (5.8%), for rent (9.6%).
- Median one-year-ahead expected earnings growth remained unchanged at 3.0% in August for the eighth consecutive month.
- The median expected growth in household income 3.5% in August.
- Median household spending growth expectations to 7.8%.
- The average perceived probability of missing a minimum debt payment over the next three months increased by 1.4 percentage points to 12.2%, its highest reading since May 2020. This increase was broad-based across demographic groups.
How long the pain at the Street, the pump, and the home last remain to be seen, but these percentages are high compared to what they were two years ago.
Given the macro-driven weakness, I maintain my hold rating on Micron.
Be the first to comment