

syahrir maulana
Investment Thesis
Over the last three, five, and ten years, the Invesco S&P SmallCap 600 Revenue ETF (NYSEARCA:RWJ) was the best-performing small-cap ETF on the market. Yet, RWJ struggles to attract new money due to its high 0.39% expense ratio and above-average historical volatility. I’ll discuss these issues in more detail in this article and highlight the positives, including a reasonable allocation to Energy stocks and an ultra-low 12.5x forward earnings valuation. Given the many uncertainties today, I’m not ready to recommend this high-beta ETF yet. However, if the stock market declines continue, RWJ will be well set up to reap the benefits.
ETF Overview
Strategy, Sector Exposures, and Performance
RWJ tracks the S&P SmallCap 600 Revenue-Weighted Index, selecting stocks from the S&P SmallCap 600 Index and reweights based on their trailing four-quarter revenues. The Index rebalances quarterly, and S&P Dow Jones Indices defines a small-cap stock as having a market capitalization between $850 million and $3.6 billion. Today, 186 stocks fall outside those bands, representing about 20% of the portfolio. Such a reshuffling would be consistent with past portfolio turnover rates between 15-20% since 2017.
Morningstar places RWJ in the Small Value category, but that’s a bit questionable when looking at its sector exposures. RWJ is 23.86% Consumer Discretionary, about double the exposure for SLY, SLYV, and SLYG. It’s also underweight Financials, often a favorite for value strategies. However, its 9.05% exposure to Technology stocks is low, so maybe it’s best to call RWJ a small-cap blend ETF.
Morningstar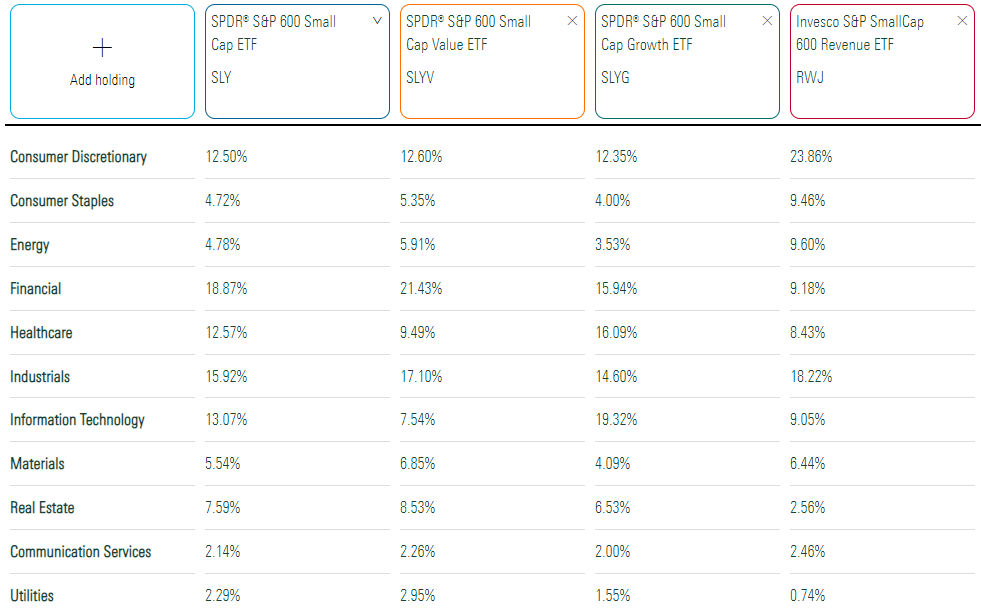
Ultimately, the category doesn’t matter because RWJ has been the best-performing small-cap ETF over the last three, five, and ten years. It’s also second-best over the previous year against 77 peers. I couldn’t squeeze them all into the table below, but here are 30 of the largest by AUM. RWJ barely qualifies, ranking 29th in size.
The Sunday Investor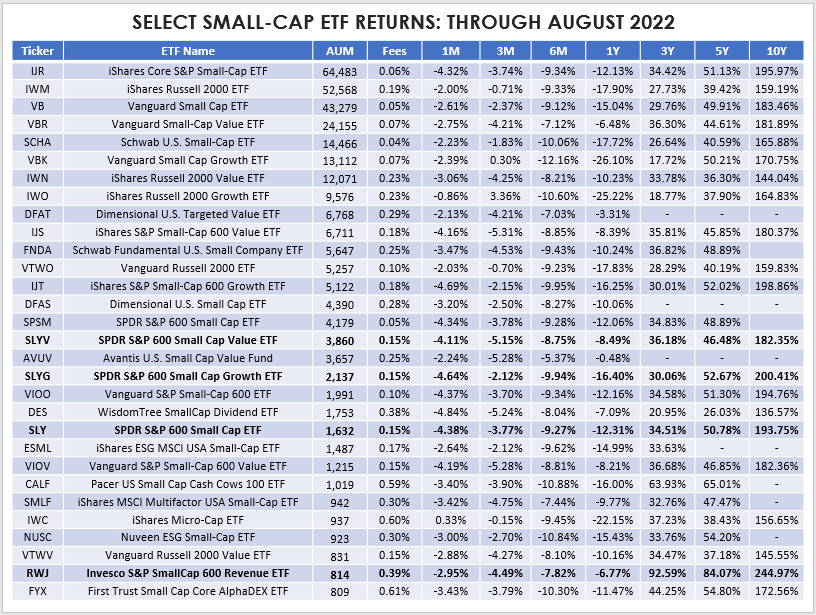
RWJ’s 244.97% ten-year return trounces SLYG’s 200.41%, the next best performer. Its 84.07% five-year return soundly beats the Pacer US Small Cap Cash Cows 100 ETF (CALF) by 19.06%. Finally, its three-year 92.59% is also ahead of CALF by 28.66%. Even just over the last year, RWJ’s 6.77% decline is ahead of the three S&P 600 ETFs, so the strategy appears to have merit.
Looking back to RWJ’s inception in February 2008, it’s up an annualized 11.26%, 0.90% better than SLYG. However, the following graph reveals a higher beta, which puts downward pressure on its risk-adjusted returns (Sharpe and Sortino Ratios). RWJ still looks good, but remember that this was mainly during a bullish market.
Portfolio Visualizer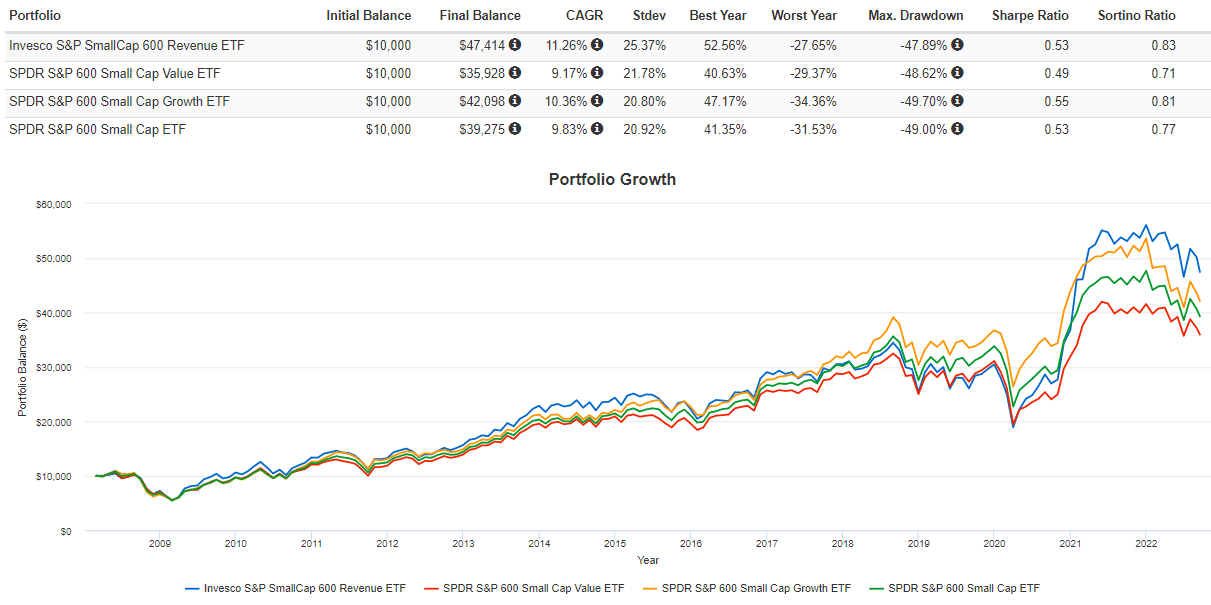
It’s easy to cherry-pick return periods, and graphs like the above can potentially mislead investors. Instead, I ask you to consider the following three-year rolling returns chart for the four ETFs. We can see that RWJ shareholders underperformed from around 2014-2020. You can get that confirmation at this link, which shows RWJ lagging SLYV, SLY, and SLYG by 0.22%, 2.19%, and 3.89% per year, respectively.
Portfolio Visualizer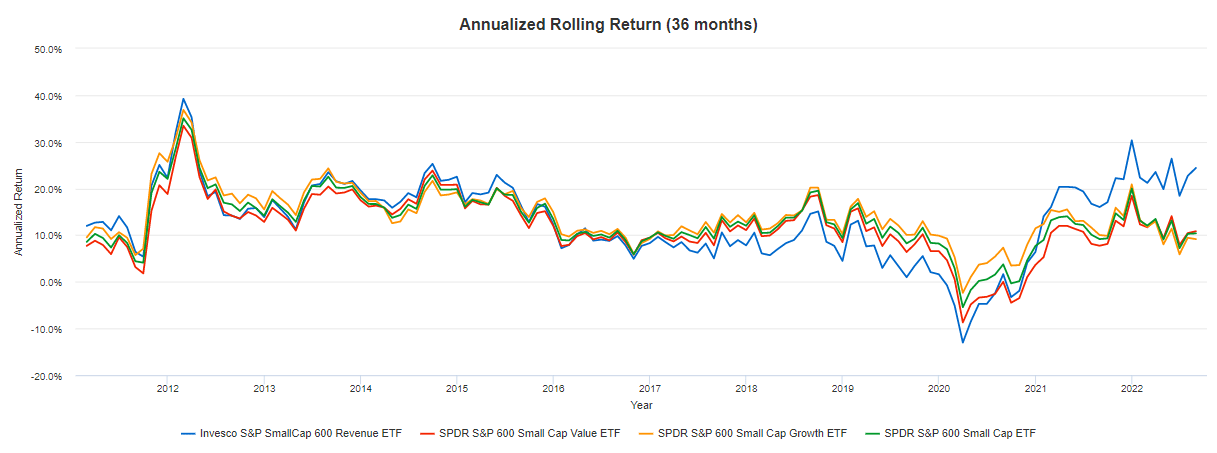
Finally, if I were writing this article in January 2020, I’d present this chart suggesting RWJ isn’t anything special.
Portfolio Visualizer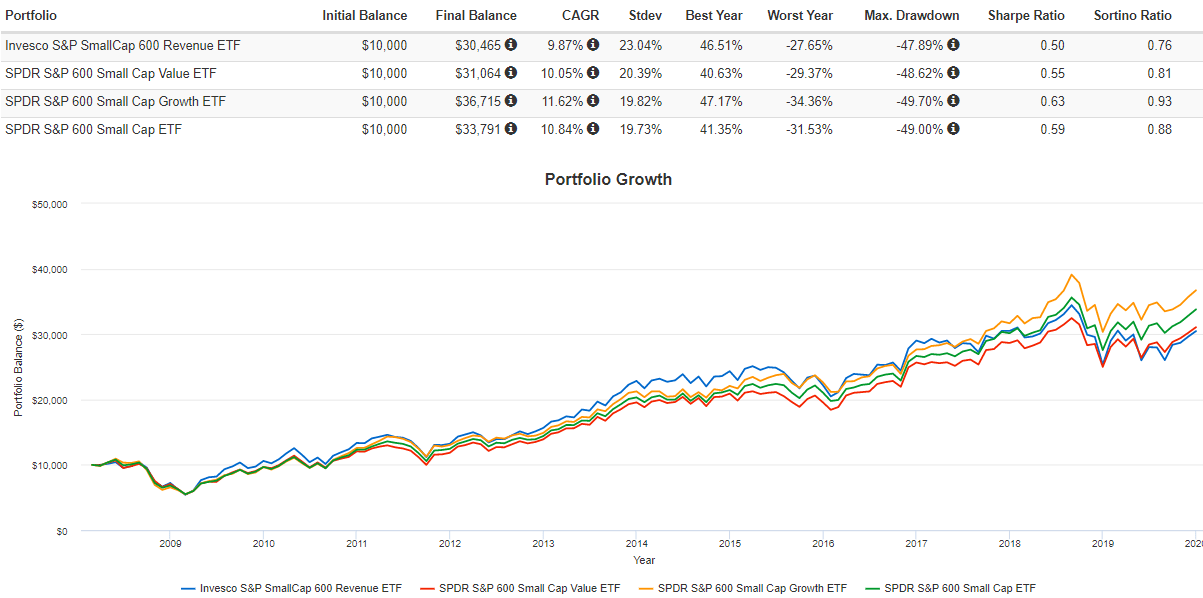
In short, we should be cautious about how to interpret RWJ’s long-term historical returns. Portfolios change, and so do the factors that the market favors. That’s why most of my ETF analysis focuses on the fundamentals of the current portfolio. Let’s do that next.
ETF Analysis
Composition By Industry
RWJ’s top 25 industries comprise 61% of the ETF, with the Oil & Gas Refining & Marketing industry the most dominant at 7.20%. World Fuel Services (INT) and PBF Energy (PBF) are the key holdings, and I expect their weightings to rise when the Index rebalances as their revenues have substantially increased. I feel these are pretty good anchor stocks, and RWJ’s 9.62% allocation to the Energy sector is close to what I think is appropriate.
The Sunday Investor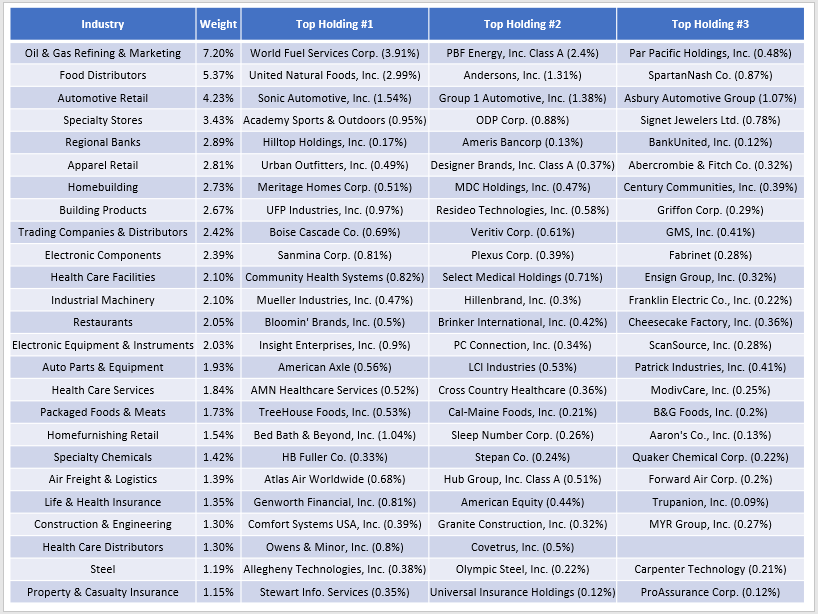
Food Distributors, led by United Natural Foods (UNFI), is next at 5.37%, and this industry has held up pretty well over the last year. All holdings (UNFI, ANDE, SPTN, CHEF) had positive sales and earnings surprises last quarter and earned Seeking Alpha EPS Revisions Grades ranging from B+ to A+.
RWJ’s five Automotive Retail stocks have value written all over them. Sonic Automotive (SAH) and Group 1 Automotive (GPI) have annual revenues of $13.5 billion and $14.9 billion, yet both remain firmly in the small-cap territory. Sonic disappointed investors last quarter but continues to ramp up what looks to be an aggressive stock buyback program.
These three industries are the ones RWJ overweights the most relative to SLY. In exchange, RWJ underweights Regional Banks (7.62%), Biotechnology (1.89%), and Retail REITs (1.74%).
Fundamentals: Excellent Valuations, High Volatility
The following table highlights selected fundamental metrics for these same top 25 industries. This analysis shows that RWJ has similar sales and earnings growth levels as SLY but trades at a much cheaper valuation. RWJ is 4.94 points cheaper on forward earnings, 1.93 points cheaper on trailing sales, and 2.79 points cheaper on trailing cash flow.
The Sunday Investor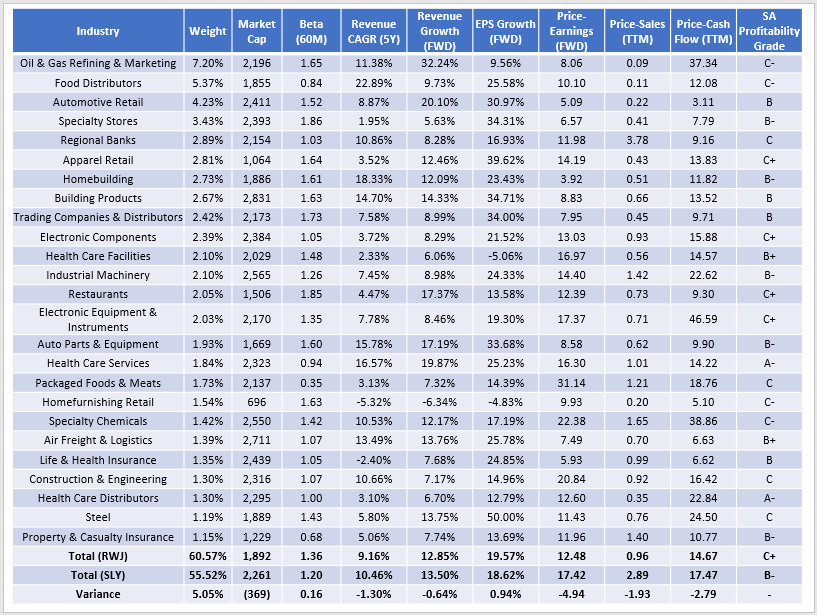
However, there are risks in buying such discounted funds. Consider that RWJ is the tenth cheapest small-cap ETF and the second most volatile. The cheapest ETFs by forward P/E are CALF, XSVM, and AVUV, and they also have high five-year betas. Perhaps the reason for their great returns is that they’re riskier, and we’ve been in an upward-trending market for much of the last decade.
The other significant risk is that re-weighting small-cap stocks by revenue results in a lower quality portfolio, as suggested by a weaker Profitability Score (C+ vs. B-). RWJ ranks 53/78 on this metric, which could spell trouble if market sentiment remains poor. RWJ’s drawdowns are generally more substantial than SLY’s, but it often has a much faster recovery time. Given that both ETFs are down a similar amount YTD, it’s probably wise to wait for signs that a recovery is underway.
Portfolio Visualizer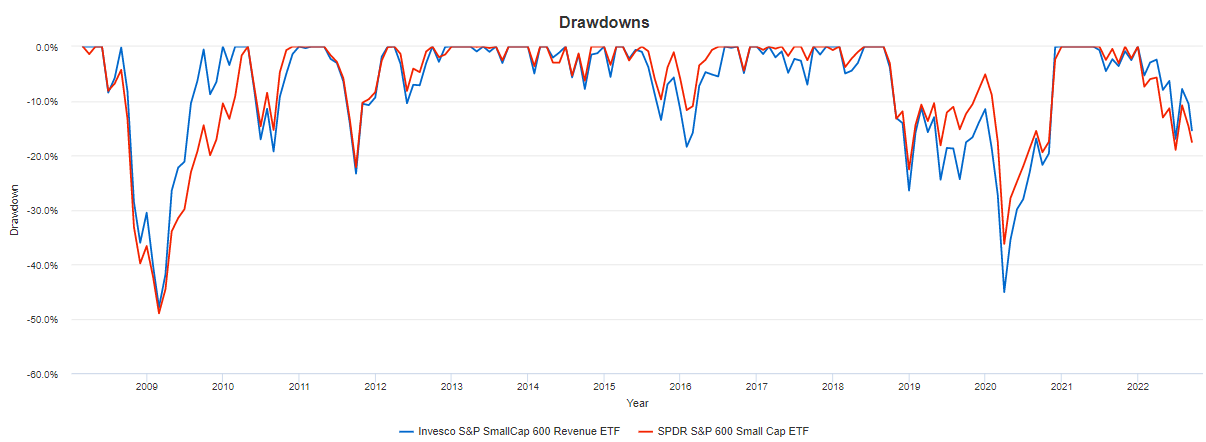
How The Mid- And Large-Cap ETFs Performed
Invesco also offers mid- and large-cap revenue-weighted ETFs. The following graph highlights their rolling returns relative to their benchmarks.
Portfolio Visualizer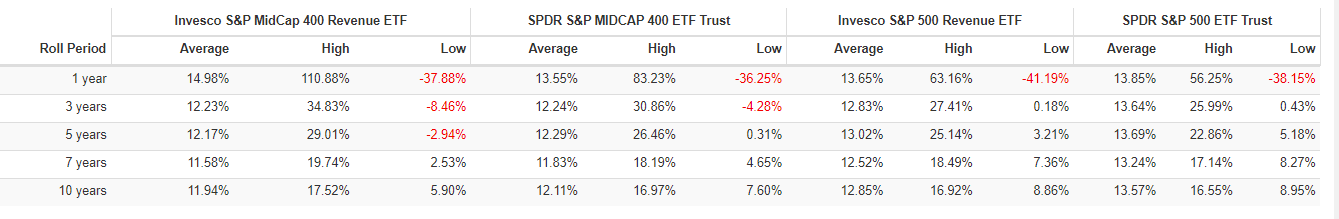
The Invesco S&P MidCap 400 Revenue ETF (RWK) reached higher highs and lower lows than the SPDR S&P MidCap 400 ETF (MDY) across all roll periods. However, as you increase the holding period, average returns look progressively worse. One-year holders outperformed MDY by 1.43% per year (14.58% vs. 13.55%), but that advantage disappears for the 3Y, 5Y, 7Y, and 10Y roll periods.
The large-cap ETFs, RWL and SPY, follow a similar pattern as the mid-caps, but there’s no average advantage for any rolling period. One-year average returns are close (13.65% vs. 13.85%), but RWL trails by 0.72% over ten years.
Finally, here are the same metrics for RWJ and SLY. One figure that stands out is the 173.48% gain RWJ achieved from April 2020 to March 2021, beating SLY by 77.01%. I’m cautious about relying on such returns to repeat, even if it’s inevitable once every five or ten years. They’re more likely to happen after a substantial market decline, and I don’t think the YTD 15-17% drop qualifies.
Portfolio Visualizer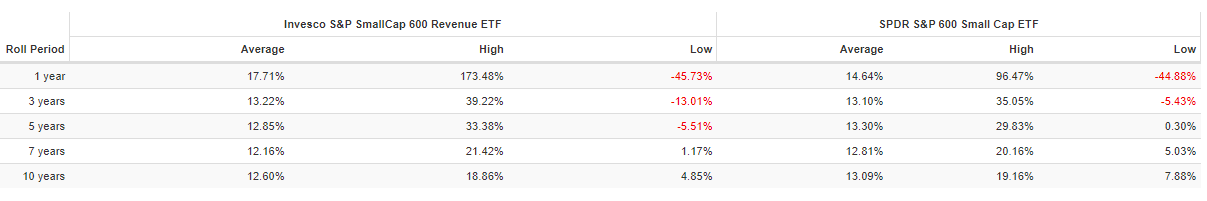
Investment Recommendation
RWJ has an impressive long-term track record, but it’s driven by post-pandemic returns that I don’t think will likely repeat anytime soon. The key negatives are a 0.39% expense ratio, high volatility, and a weaker profitability score. Still, its low 12.5x forward earnings valuation and still-strong sales and earnings growth rates are positives worth highlighting. I think RWJ is a good fund, but I’m much more comfortable recommending it after a more considerable stock market decline. Should that happen, I look forward to providing an update at that time.
Be the first to comment