


bunhill
U.S. equity markets have been in a rally since late June. The release of July CPI data has pushed the market even higher when MoM CPI reported at 0.0%, the lowest in nearly three years. The thinking is that inflation is peaking so the Federal Reserve can stop monetary tightening and consider easing. It should not be overlooked that YoY inflation is still 8.5%. If inflation stayed even for the rest of the year, the U.S. would still experience 6.5% YoY inflation in 2022, nowhere close to the Fed’s target of 2-3%.
Perhaps that is one reason why Michael Burry, the famed investor from The Big Short, has sold all but one holding in his managed portfolio at Scion Asset Management, LLC. The company filed its 13F form on Monday and in shocking form it revealed that all the equity positions were sold except for The Geo Group Inc (GEO). The liquidated positions include Alphabet (GOOG), Bristol Myers Squibb (BMY), Meta Platforms (META), Cigna Corp. (CI), and put positions on Apple (AAPL), among others.
This unsettling development comes after an unsettling Tweet that Burry published on August 12, 2022. The Tweet, below, has since been deleted, in typical Burry fashion:
Nasdaq now up 23% off its low. Congratulations, we now have the average bear market rally. Across 26 bear market rallies from 1929-1932 and 2000-2002, the average is 23%. After 2000, there were two 40%+ bear market rallies and one 50%+ rally before the market bottomed.
The reason for Scion Asset Management’s move is not clear and could, perhaps, be inconsequential. However, Burry is clearly comparing today to the equity markets of 2000 and 2008. It’s got me wondering, what is Burry looking at and how concerned should I be?
It Starts With The Consumer
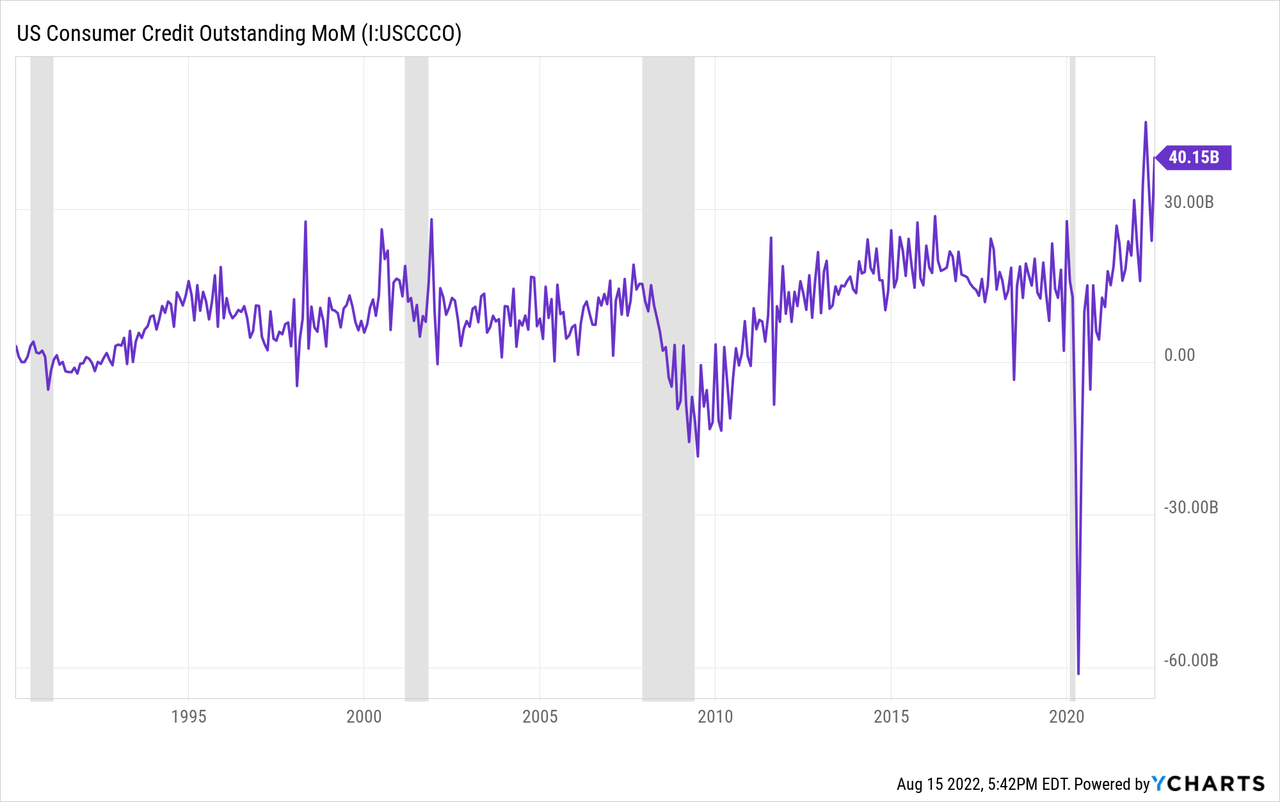
Lately, one of Burry’s vocal concerns has been regarding consumer credit. As he points out, the monthly increase in consumer credit in June was over $40 billion, the second highest on record. March 2022 was the highest at $47 billion. It is a sign that consumers are having difficulty maintaining their lifestyles on income alone.
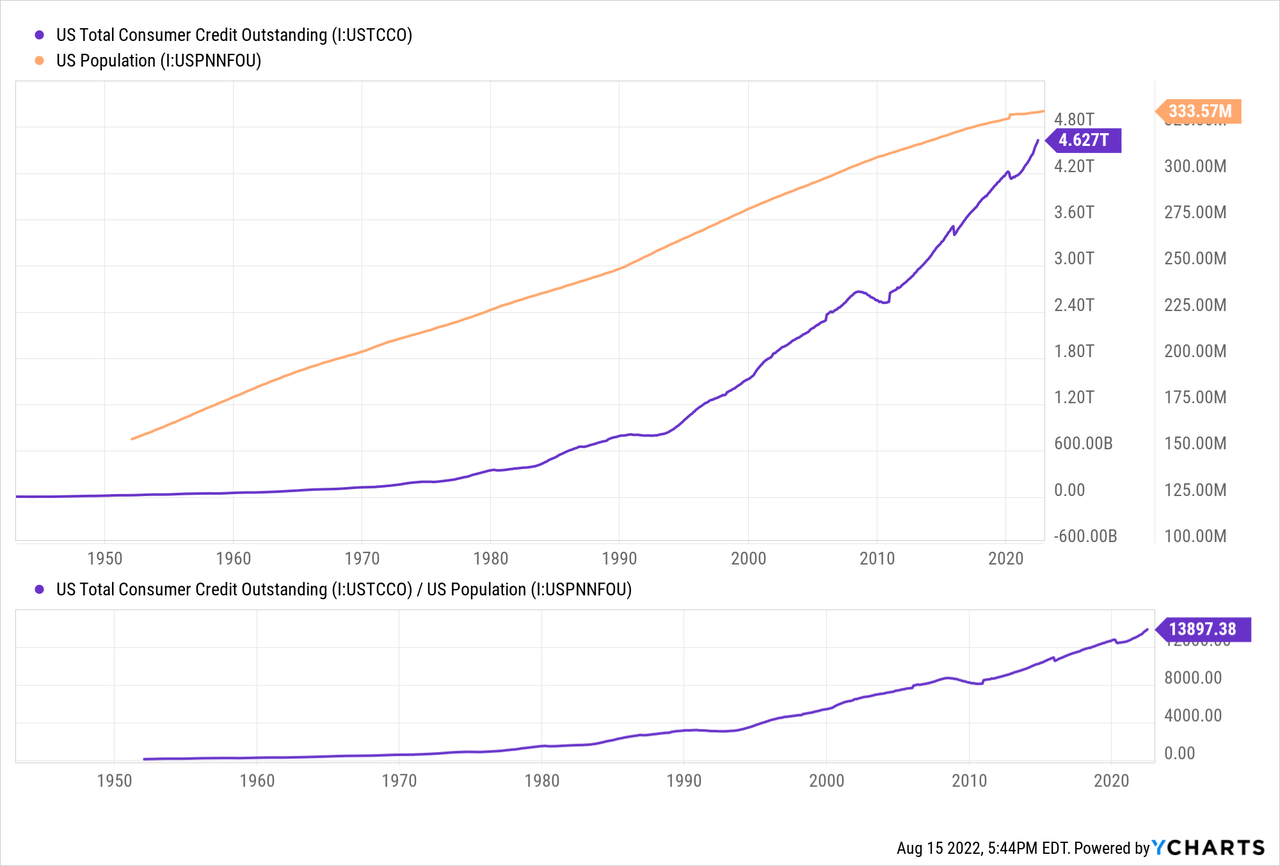
For decades the amount of credit outstanding per capita in the U.S. has been growing. Today, it stands at $13,897 per person. Over the last 10 years, growth of total consumer credit has been outpacing inflation 2 to 1.
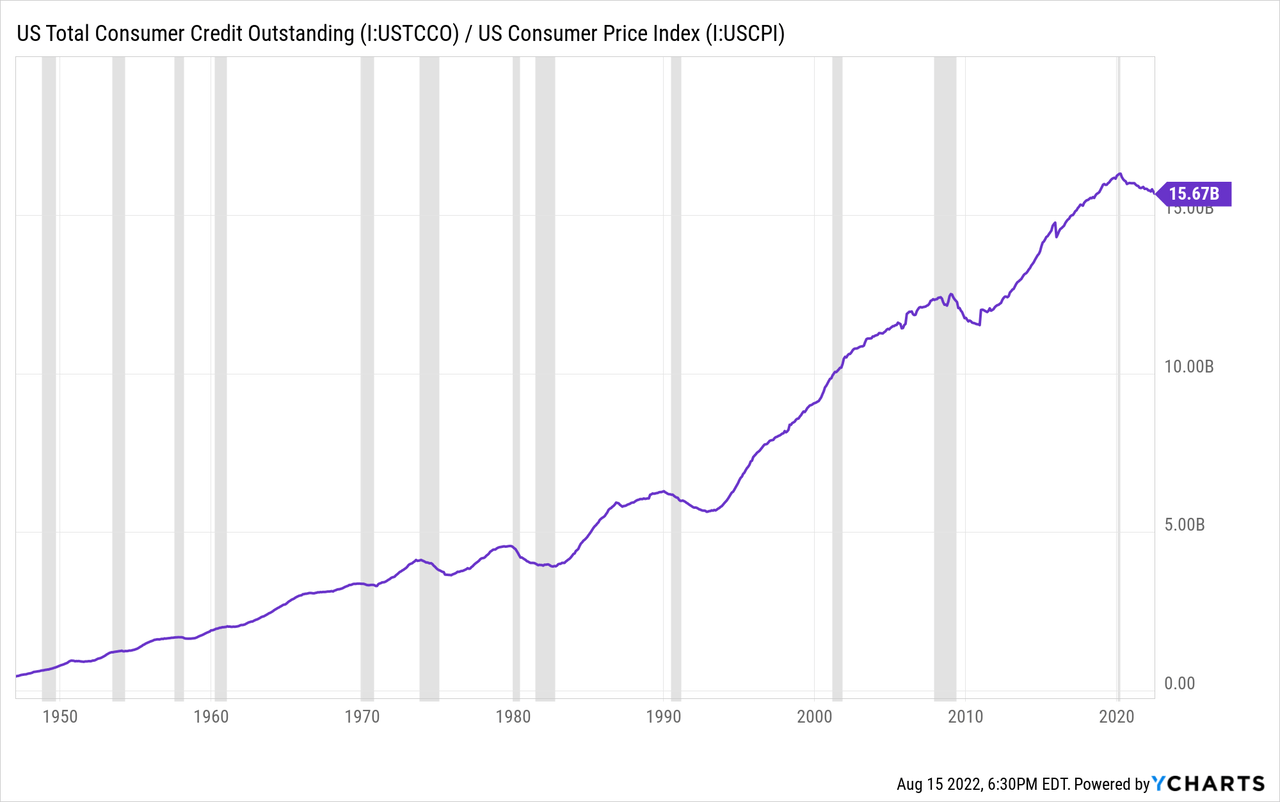
Adjusting for inflation consumer credit outstanding has been in decline since 2020. While a decrease in real credit may seem to indicate strength, history shows that declining real credit often occurs during recession.
Part of the issue is that student loan balances have not been decreasing. Data from the New York Fed Consumer Credit Panel & Equifax suggest that 55% of student loan balances have not declined since 2019. This is partially a consequence of the pause on student loan payments that took effect during the pandemic. That pause is set to expire August 31, although it would not be surprising to see an extension.
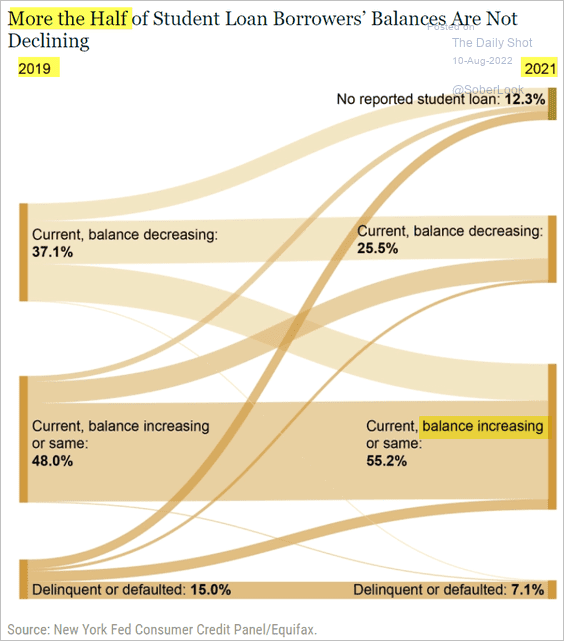
The Daily Shot (used with permission)
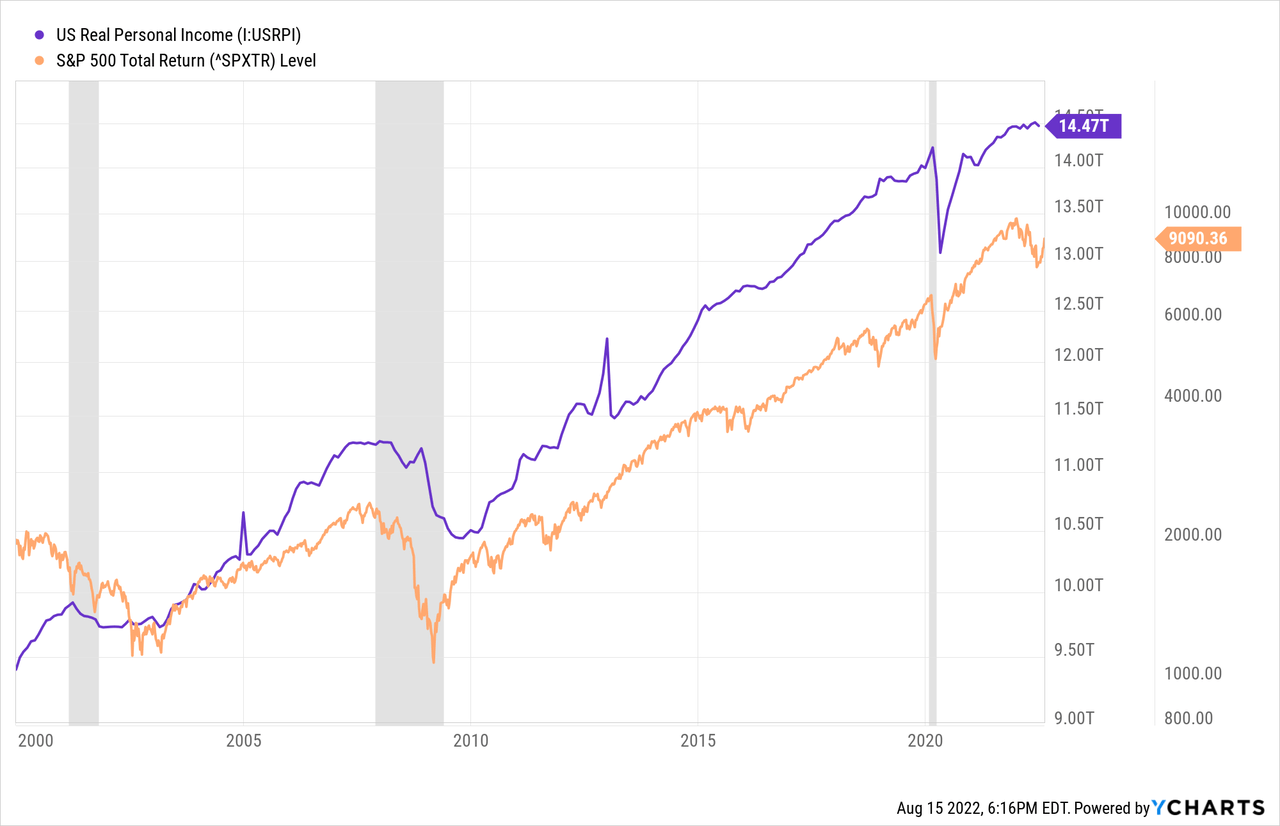
The issue is that a combination of over-leveraged households and decreasing real personal income is a dangerous combination for the economy. It has the potential to weigh on consumer spending and company earnings. It is also a precursor to credit market issues. Real personal income has grown by 0% in 2022. Weakness in the job market would lead to a decline in real income which, as history shows, is correlated with S&P 500 returns.
Business Conditions are Very Weak
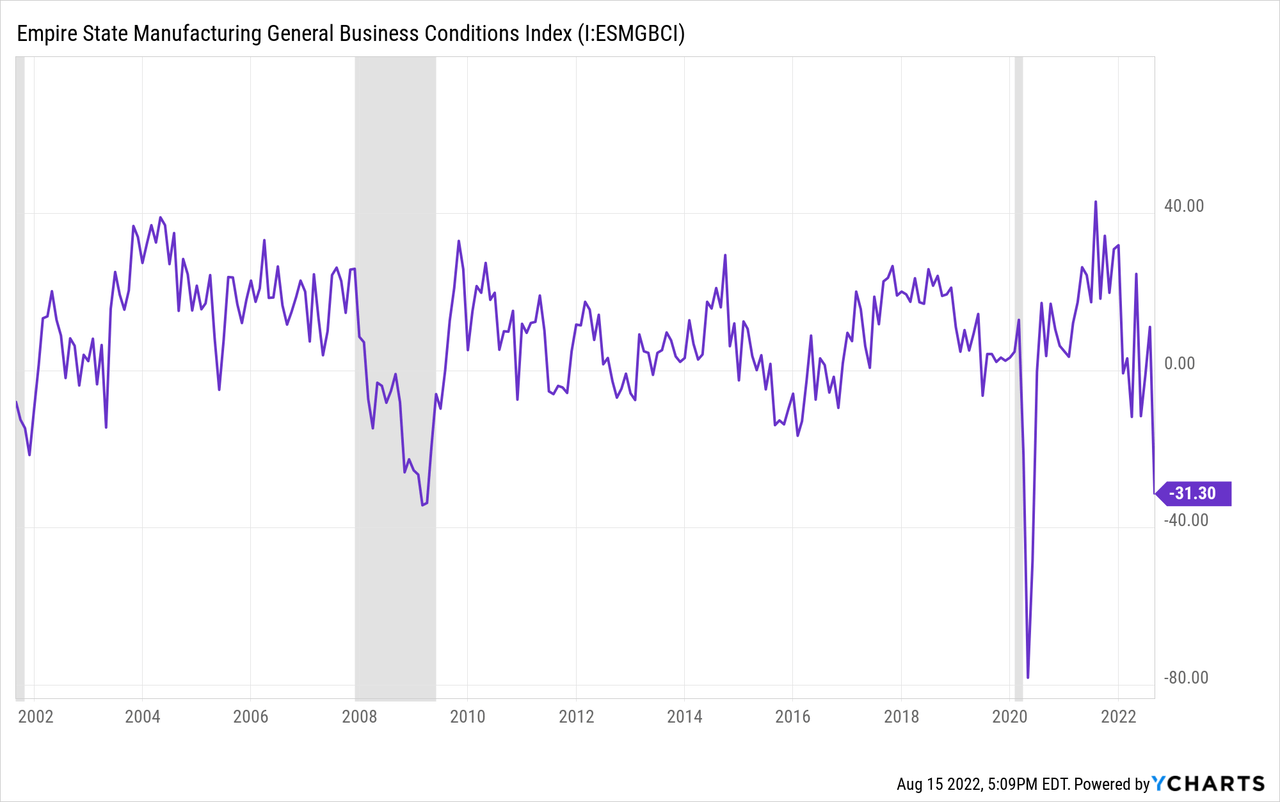
The jobs market appears strong right now. I recently wrote about why that’s not the whole truth and that it may be in decline. This week we received more data that supports that view. The Empire State Manufacturing Index misses expectations by a wide margin and printed at -31.3. This is the lowest level since 2020 and 2009.
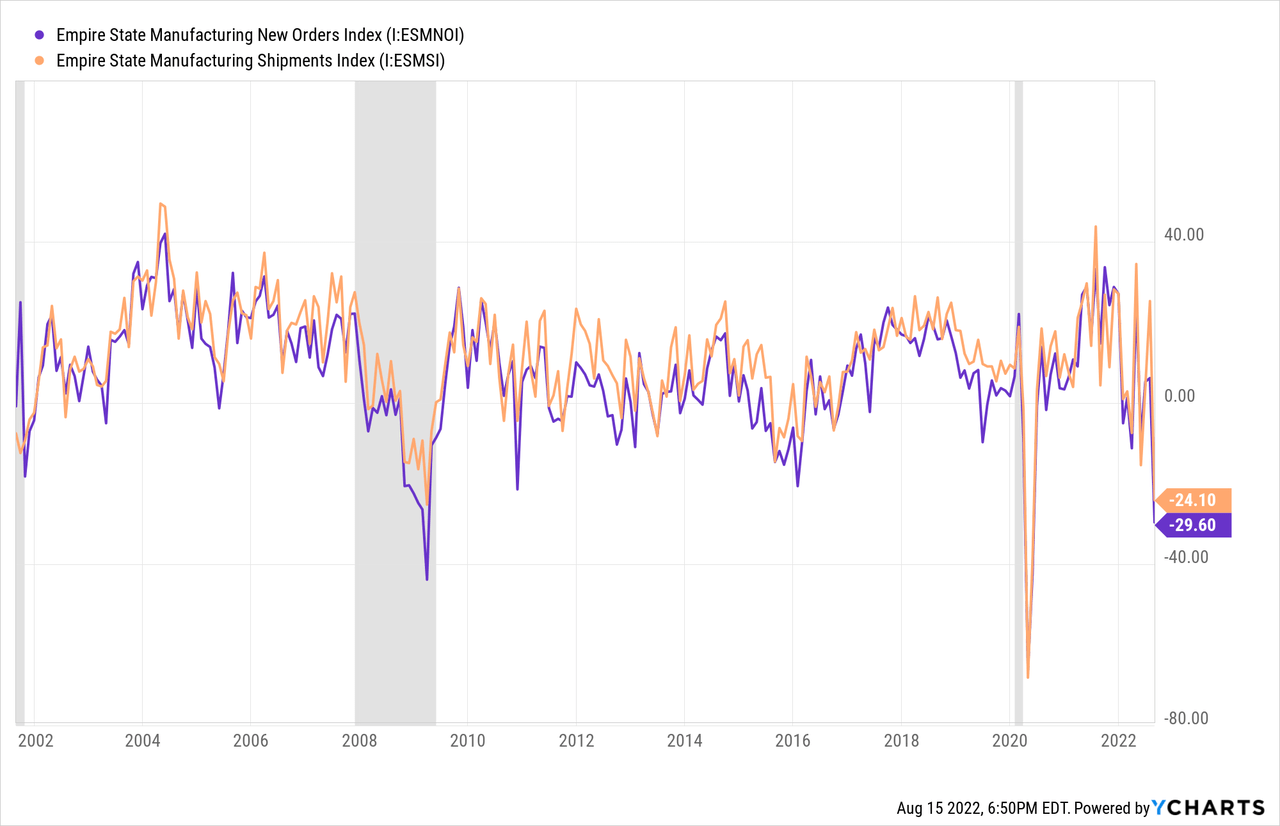
Likewise, the ESM New Orders Index and ESM Shipments Index both experienced steep declines to -29.6 and -24.1. This data is exhibiting significant economic weakness.
We also received the latest NAHB Housing Index data which was poor. The index has dropped 8 consecutive months to 49. This index is negatively correlated with the U.S. unemployment rate because housing is a significant industry of the U.S. economy.
Below is a chart of the NAHB index inverted compared to the U.S. unemployment rate. The NAHB index has diverged from unemployment this year. The last three times this divergence occurred was 2000, 2006, and 2018, with the exception of the COVID crash. The NAHB index is currently implying an unemployment rate of approximately 4.2% compared to the current rate of 3.5%. The question is whether this is the start of another 2000/2008 or simply a 2018 scenario.
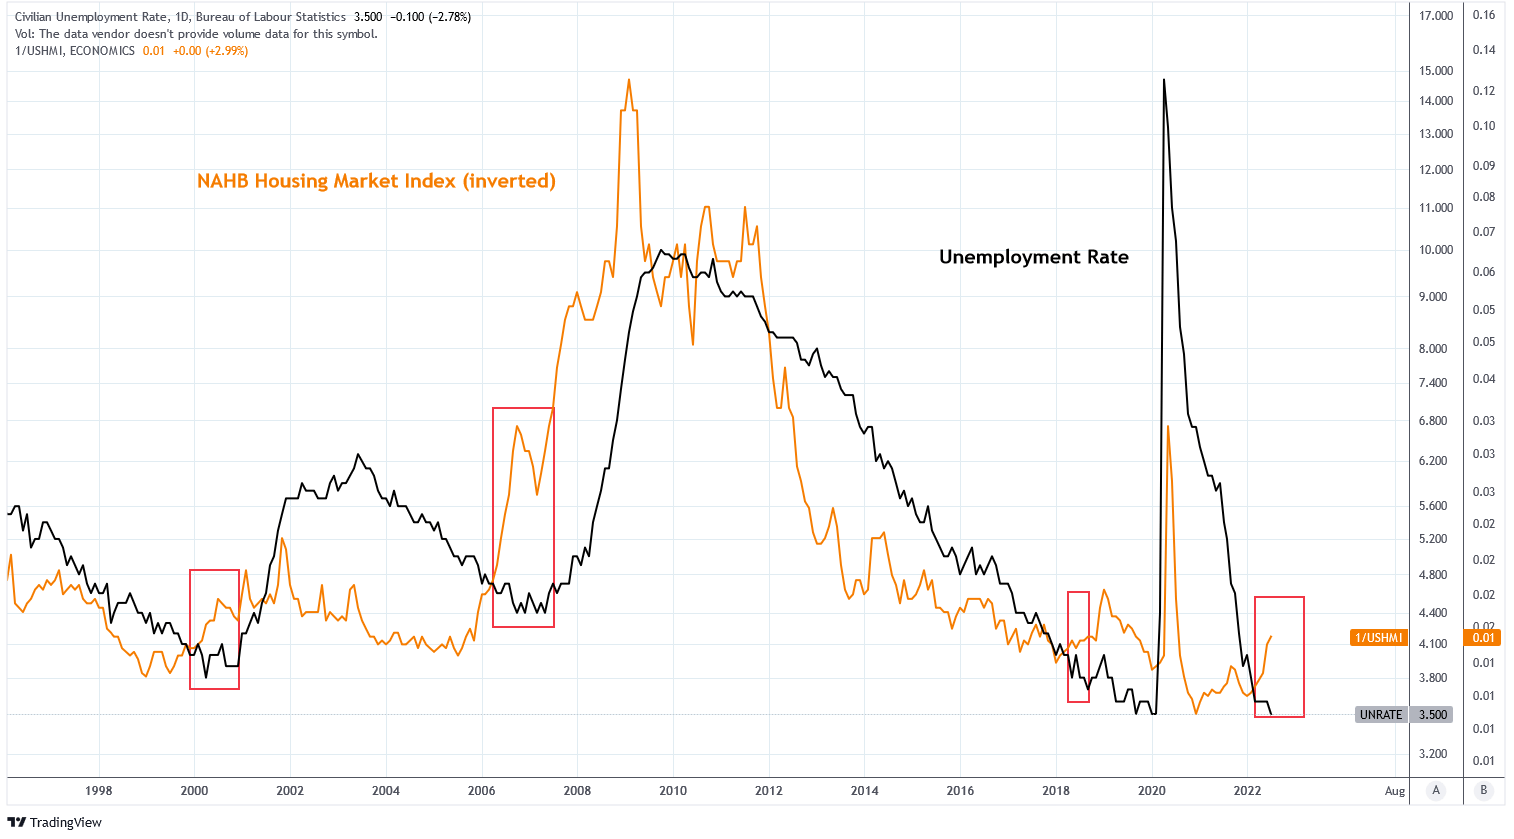
Charts by TradingView (adapted by author)
Is The Market Overpriced or Underpriced?
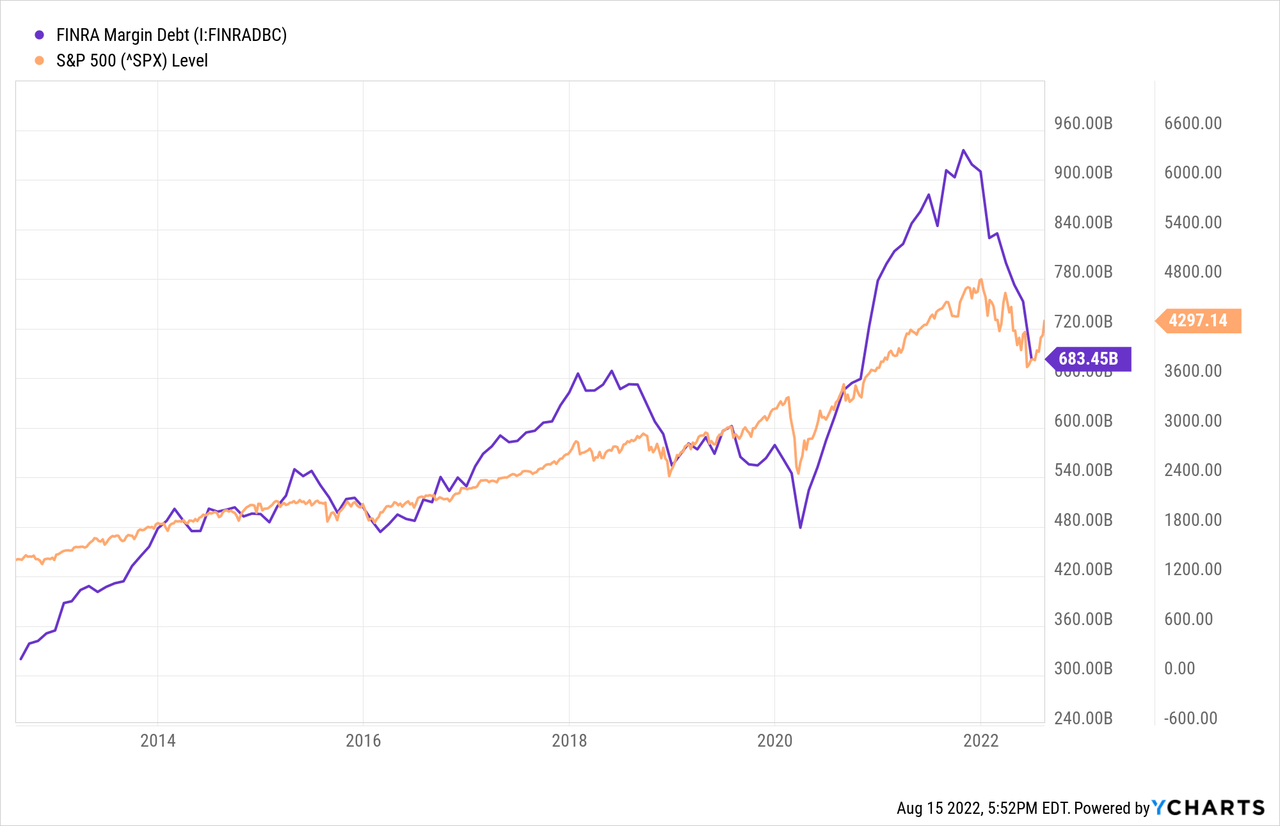
The bear market in equities that began this year coincided with a decline in margin debt, which is a common occurrence. The model by Currentmarketvaluation.com finds that the decline in margin debt is about 1 standard deviation from the average margin debt increase of 0.1% per year since 1970. Stock market corrections that would be considered mild, such as those of 2018, 2011, and 1990 have bottomed around this level. Major events, including the Dotcom crash of 2000 and Great Financial Crisis of 2008, reached 2 standard deviations from average.
There are two significant reasons why this bear market may be more like the major events than the mild ones:
- Unexpected Decline in Earnings
- The Buffett Indicator
Earnings Decline
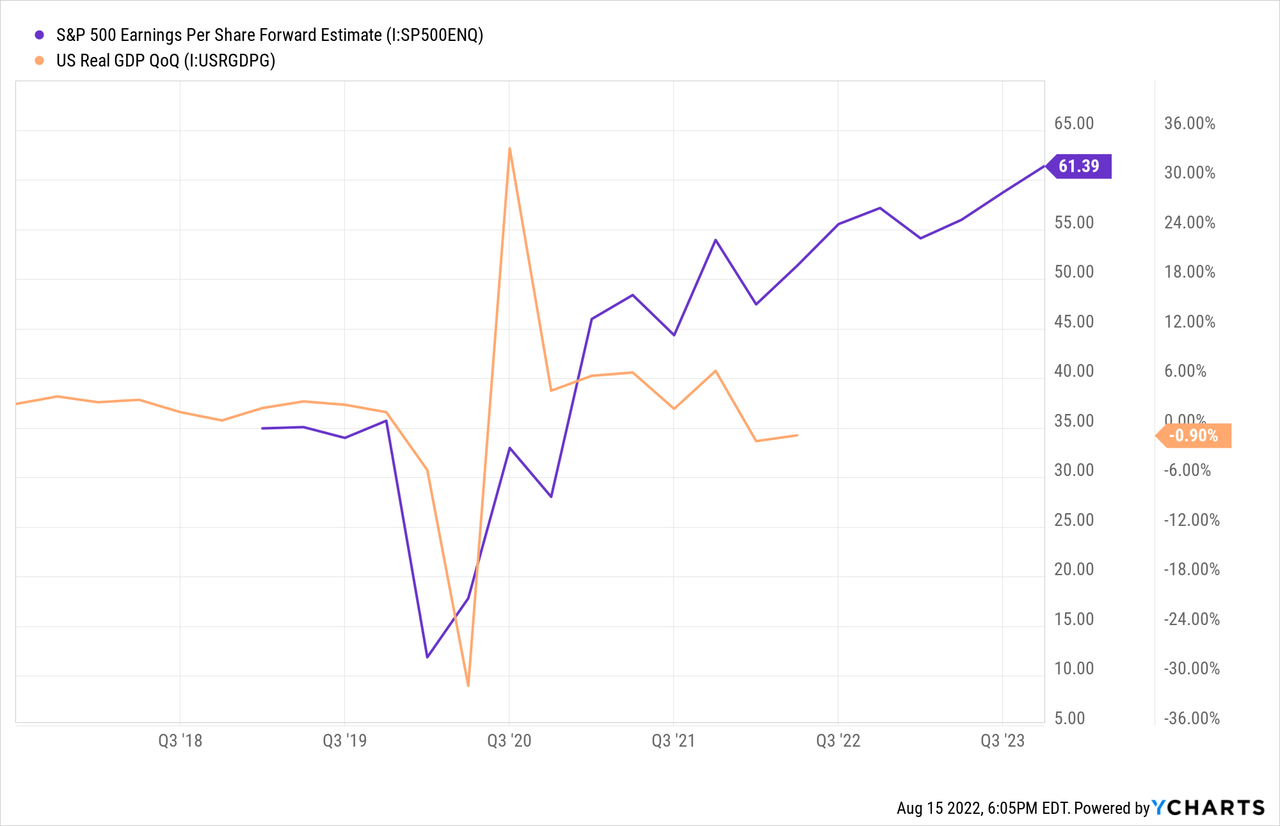
Revenues and earnings estimates for the S&P 500 and equity markets remain resilient in the face of degrading economic data. For example, forward estimates of S&P 500 earnings per share are forecasting a 29% increase from Q1 2022 to Q4 2023. This is while Real GDP has already posted two quarters of negative growth.
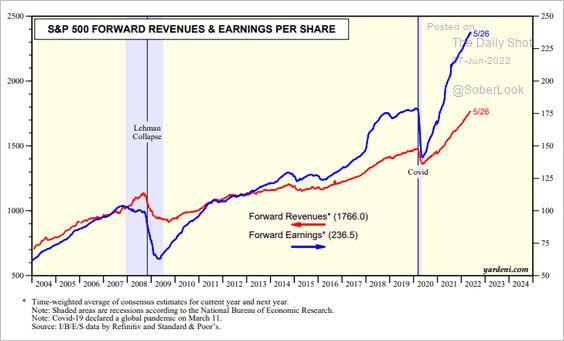
The Daily Shot (used with permission)
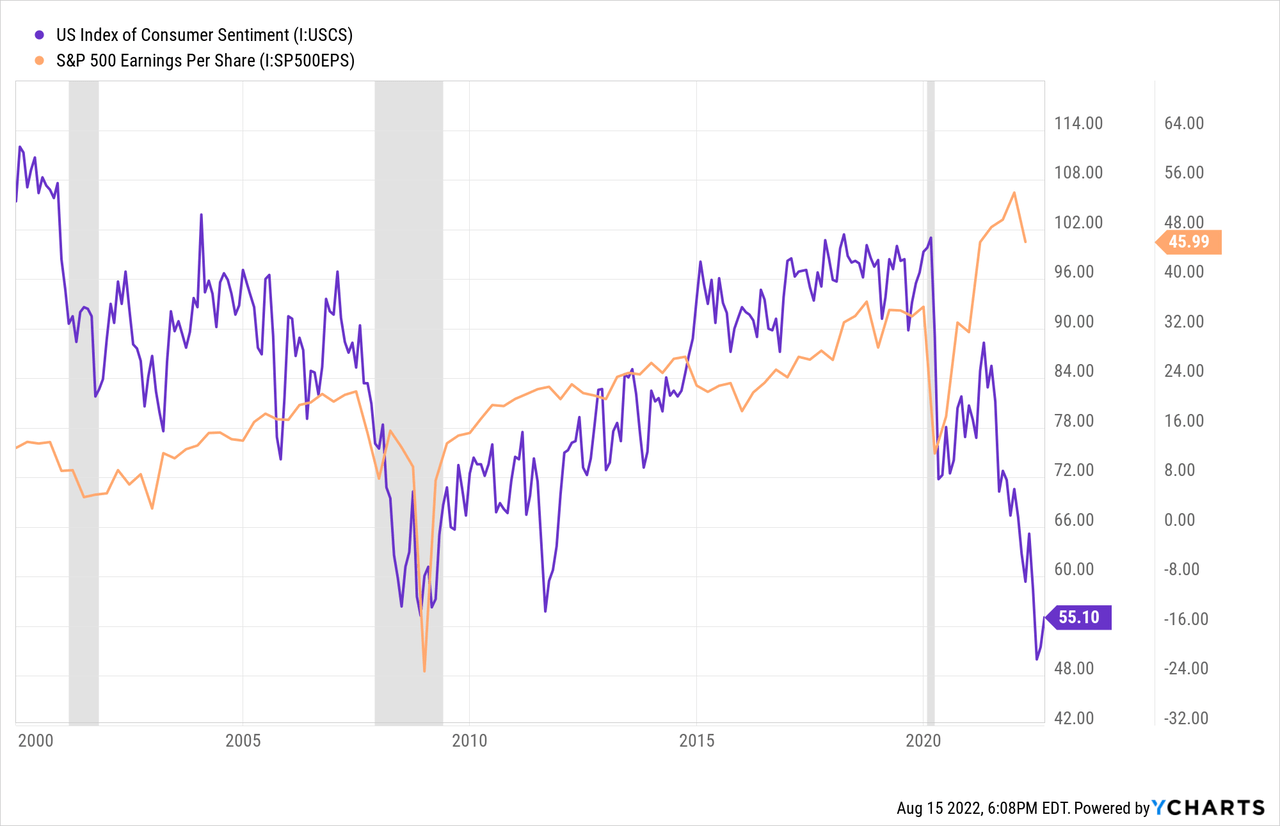
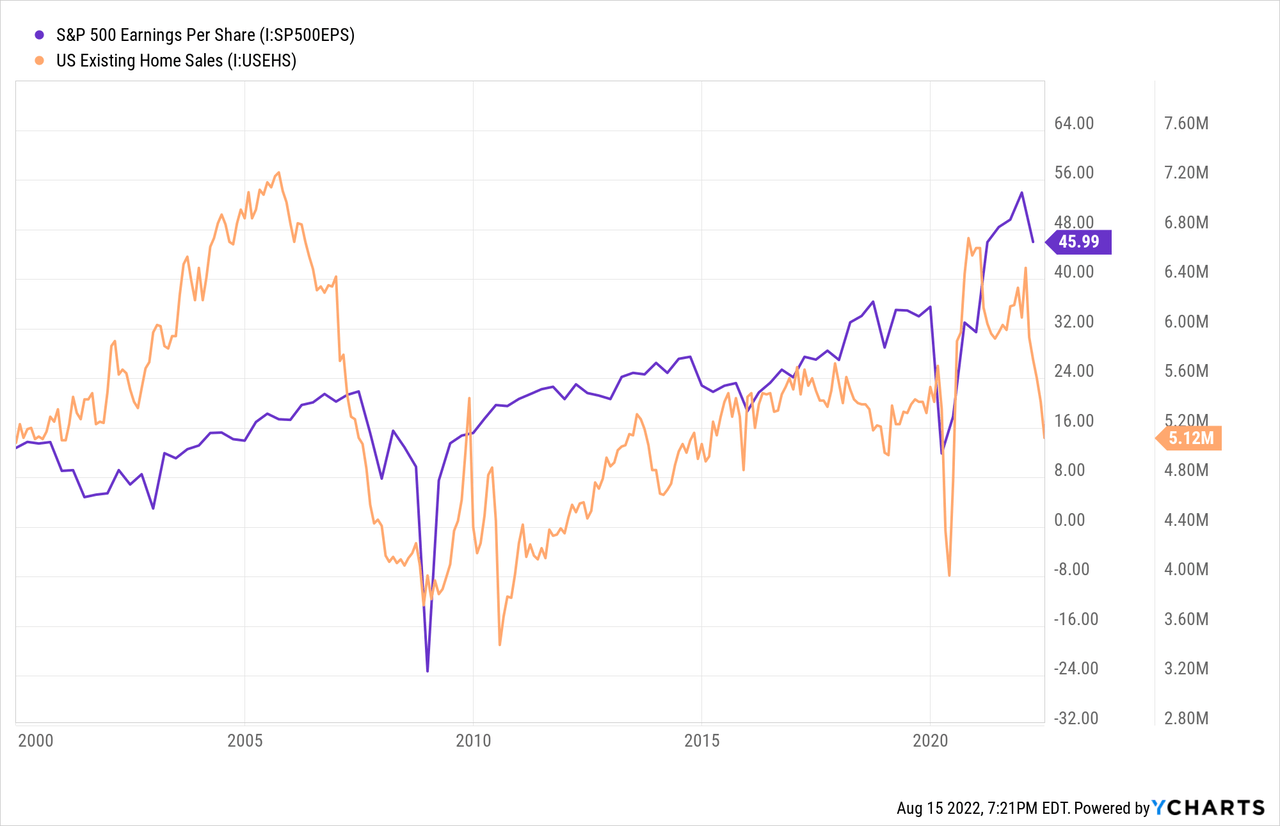
The US Index of Consumer Sentiment is not forecasting higher earnings. It reached an all-time low last month, lower than 2009 when earnings were deeply negative.
U.S. existing home sales are not as bad as consumer sentiment but they have also been in decline by dropping from 6.49 million in January to 5.12 million in June. Seasonally, that’s a very bad look. Home sales are forecasting a potential drop in S&P 500 earnings per share of 10-30%.
The DXY U.S. Dollar Index also supports lower earnings as dollar strength impacts company profits, especially those that earn profits from outside the U.S. which includes much of the S&P. The inverse relationship between DXY and S&P 500 earnings is forecasting a 10-30% decline in revisions breadth.
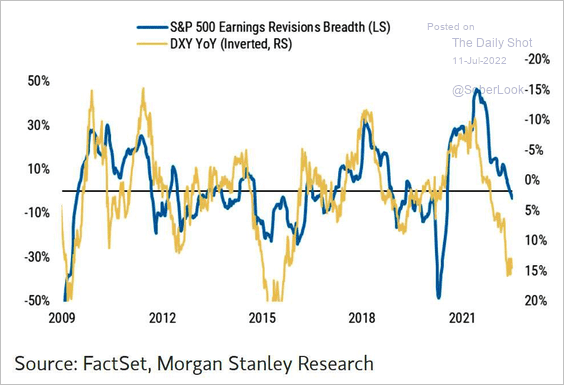
The Daily Shot (used with permission)
The S&P 500 was overvalued in 2021 according to price to adjusted operating earnings multiple. The S&P has a normal Ad. Op. P/E of 21.89 and traded up to 25 at the peak. The market decline has reduced the current multiple to 20.7.
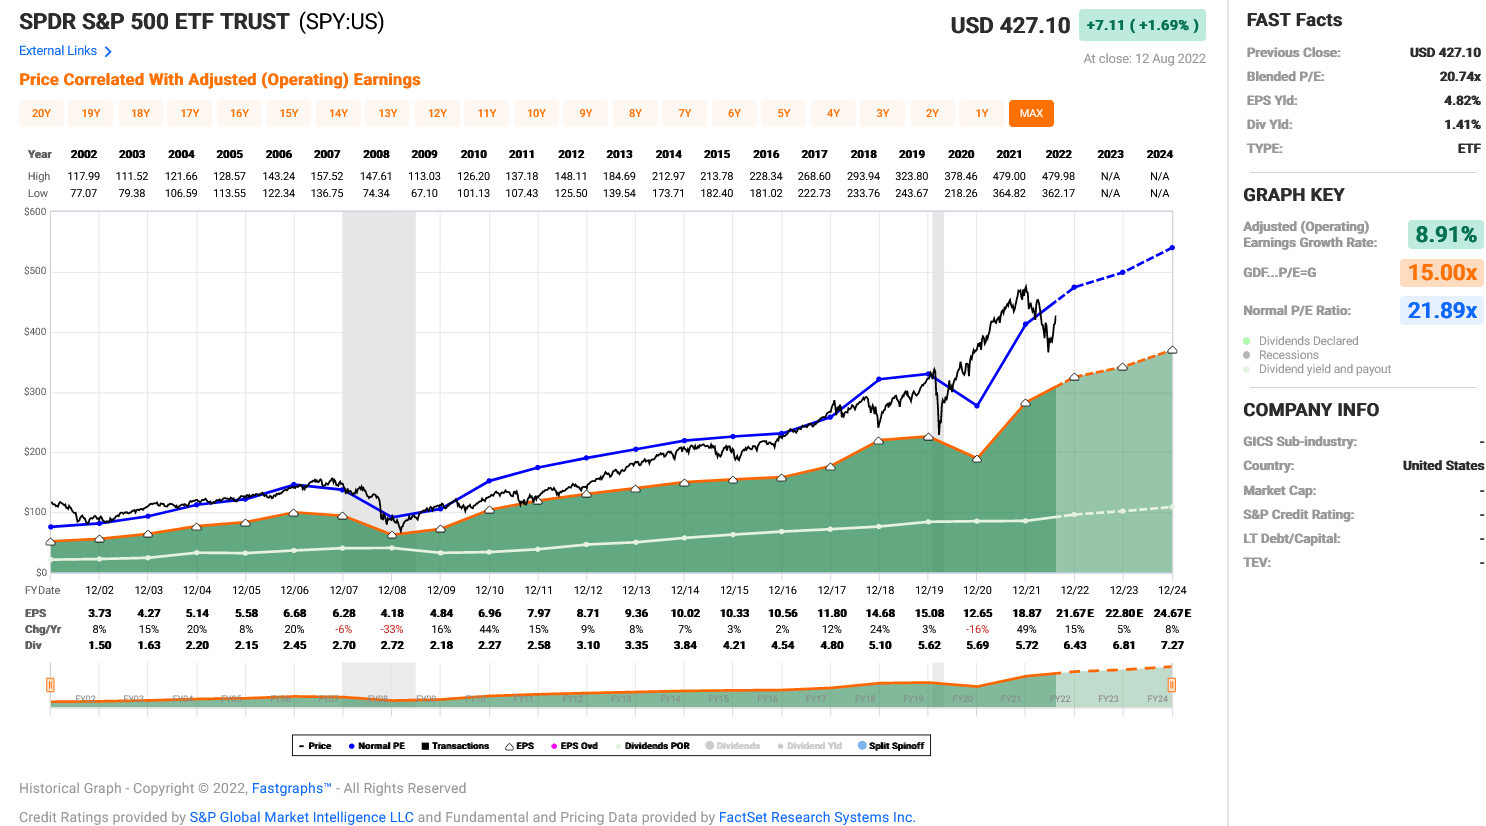
FAST Graphs
If forward estimates are correct, investors could buy the S&P today and expect 11.7% CAGR returns if price rises to its normal P/E multiple by 2024.
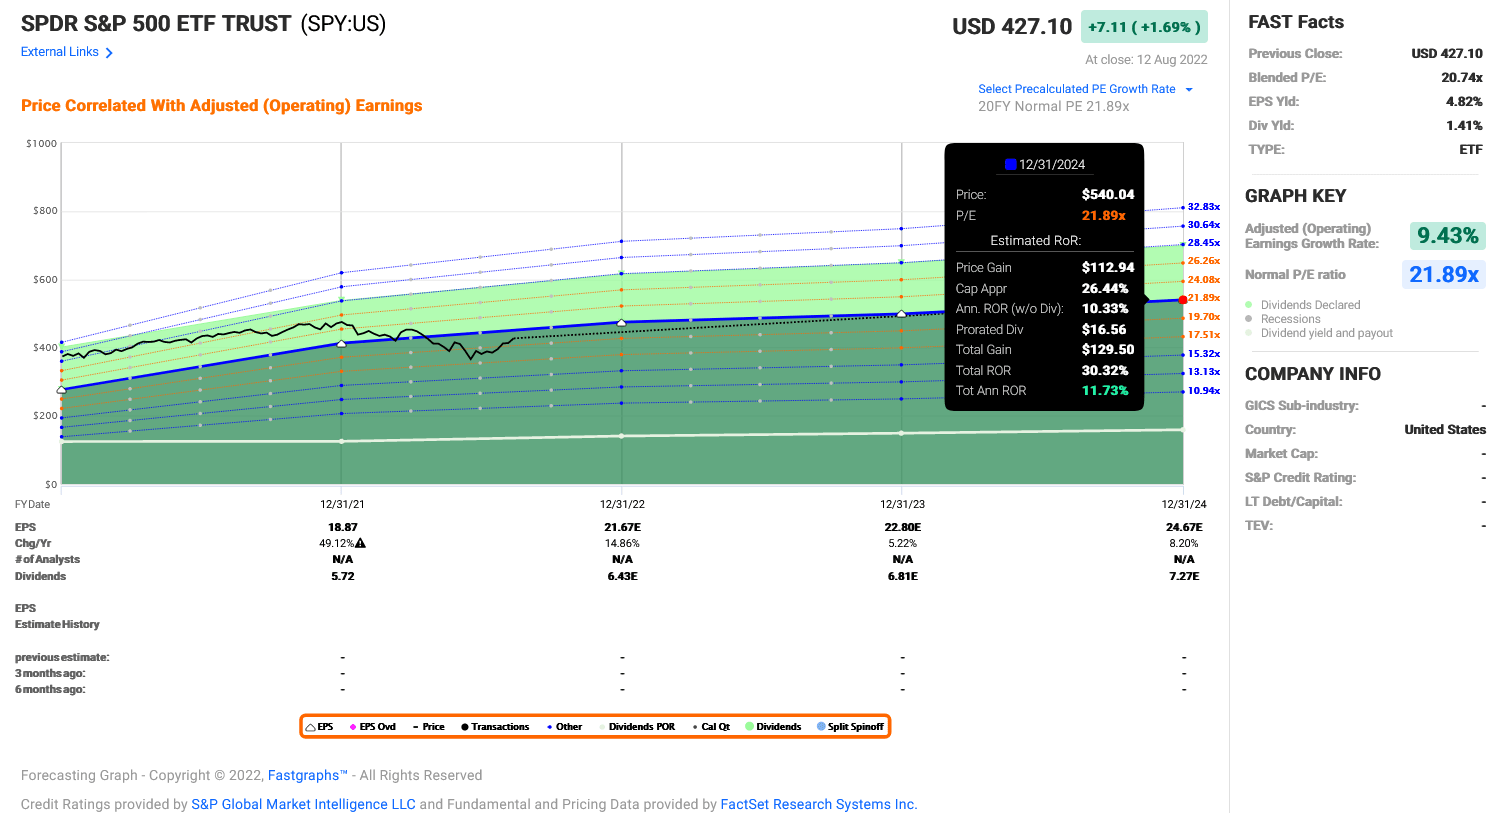
FAST Graphs
However, if estimates are wrong and earnings decline by 21% in 2023, the S&P 500 could decline to $3,280 a share at its normal P/E multiple, a decline of 23%.
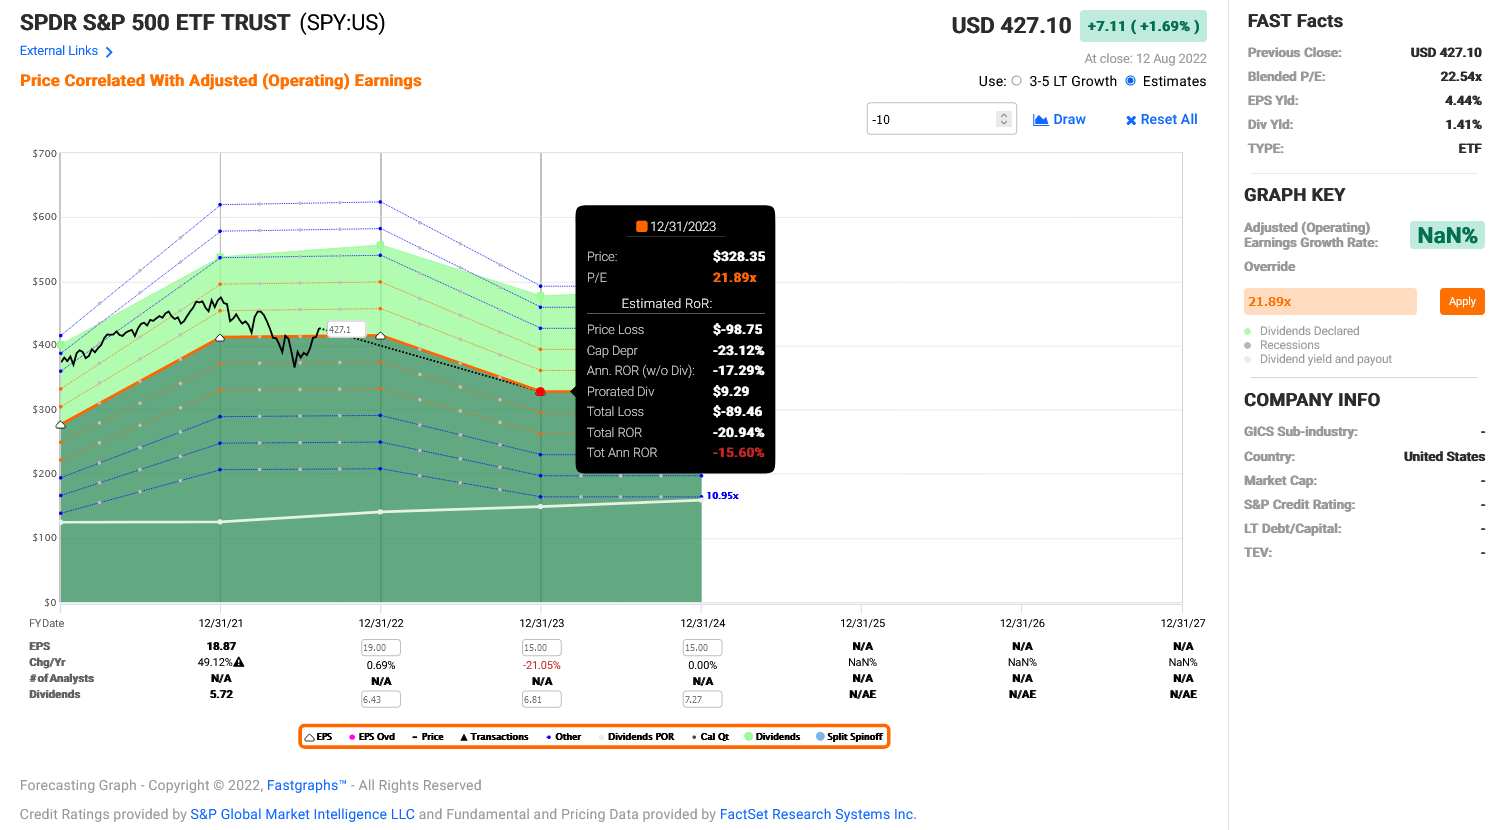
FAST Graphs
The Buffett Indicator
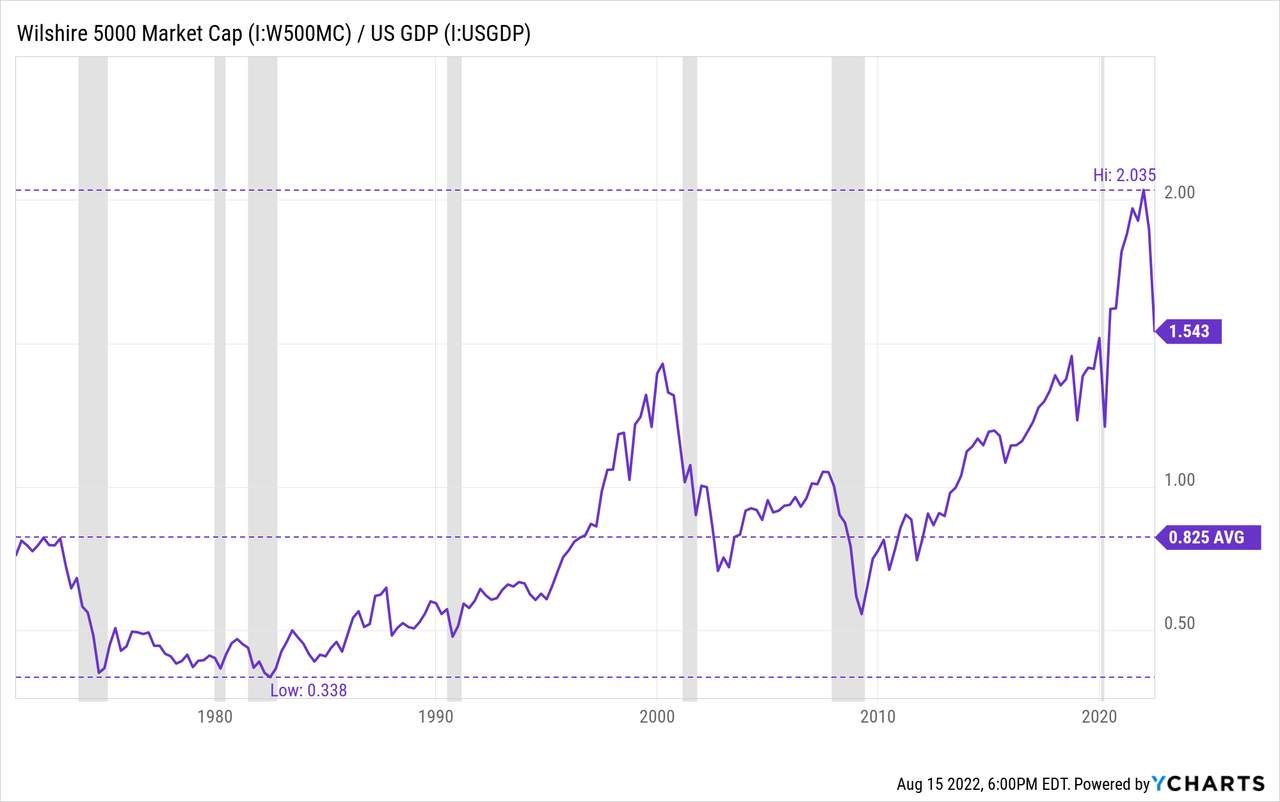
Warren Buffett made famous his indicator for stock market valuation which is a ratio of the market capitalization of U.S. publicly traded companies to U.S. GDP. The Wilshire 5000 is commonly used as a proxy for U.S. publicly traded companies. Equities are usually considered fairly valued when the ratio is below 1.0, although the ratio has a long-term exponential trend line mean of 1.27 which is also considered fair by some.
After peaking at 2.035 the ratio has rebounded to 1.543. This level is still higher than the 2000 peak. But it could take many years for mean reversion to occur.
What Ultimately Matters
In today’s markets what ultimately matters is the monetary and fiscal postures of the world’s central banks, specifically the Federal Reserve. Monetary easing can override the effects and implications of these macro conditions and valuations. Yardeni Research Inc. publishes a useful chart that compares the S&P 500 with the total assets of major central banks. The data shows that central bank assets have been declining with the S&P. In June, the S&P’s decline was getting ahead of bank assets. The recent rebound in stocks is now back on par with bank assets. If assets continue to decline there is a good probability that equities will as well.
As Burry points out, there have been many large bear market rallies in the past that dwarf the current rally we have today. I have concerns with the technical picture of this rally. A bearish rising wedge has formed which is testing the 200-day moving average on low and decreasing volume while the RSI is overbought. The conditions are similar to the last three significant highs. Below are two unfilled gaps including one at 3,800.
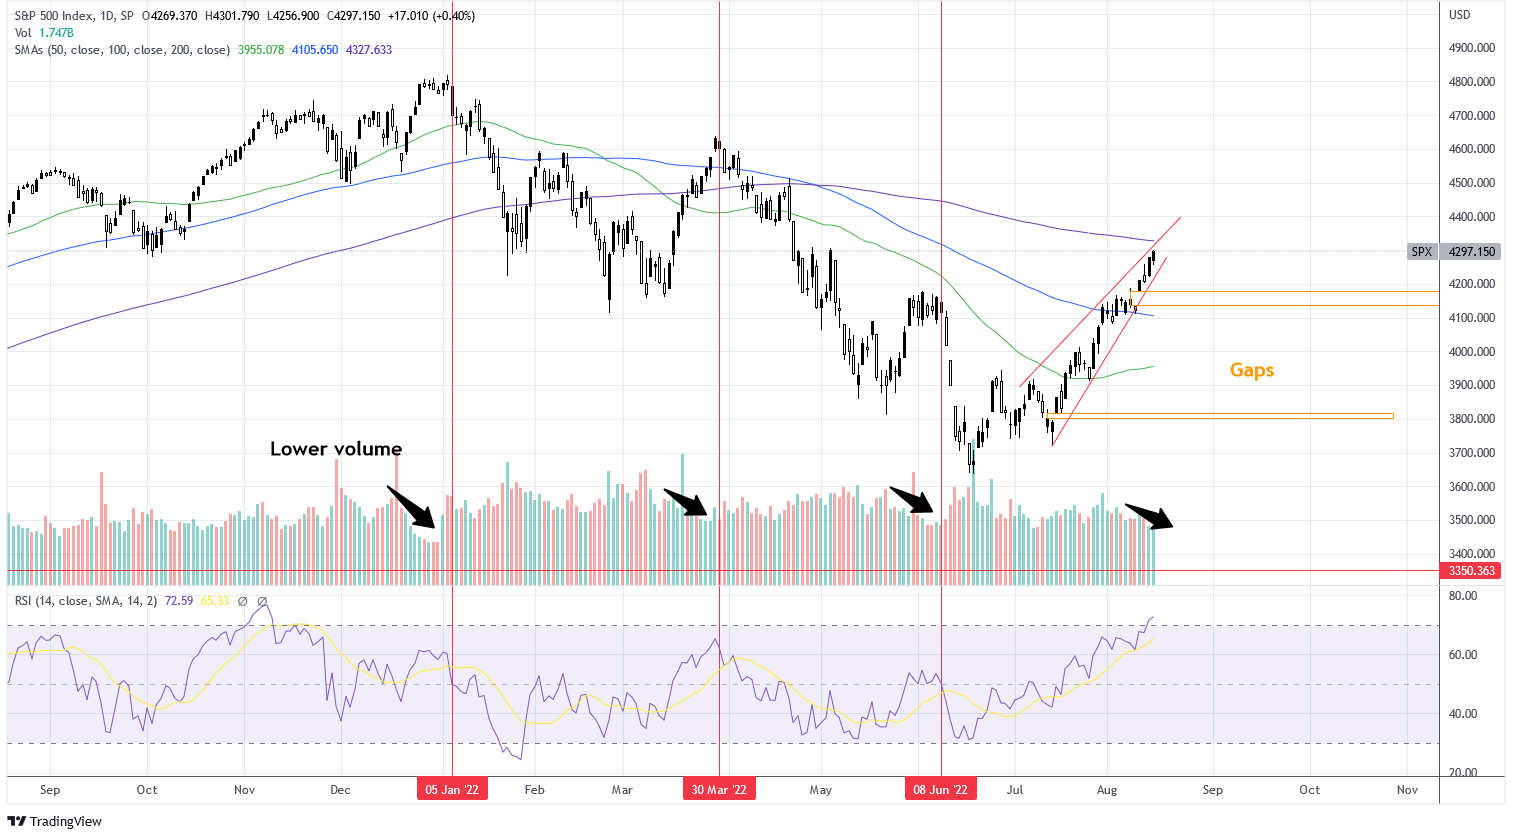
Charts by TradingView (adapted by author)
Summary
I take notice when Michael Burry is a bear and right now he is a huge bear. By liquidating the positions in his portfolio, save one, he is putting his money where his mouth has been: out of the market.
The macro data seems to support his hypothesis. I’m seeing weakness all over the place. The consumer is struggling while housing and business conditions are projecting job weakness. Earnings estimates are too generous and negative earnings will materially impact equity valuations which are already stretched.
One thing that can change this outlook is monetary easing resulting from a Fed pivot. This recent market rally is trading on the optimism of such pivot. I’m less optimistic than the markets. That is why I continue to maintain a large cash position in my portfolio that I have held for the past few months. I’ll be sure to write again when I decide to put that cash to work.
Be the first to comment