

gesrey
FS KKR Capital Corp (NYSE:FSK) has significantly bounced off its June lows by roughly 24% and is up 6% in 2022. I have been paying close attention to FSK as this is one of the largest Business Development Companies (BDCs) and an interesting income investment. FSK just reported Q2 earnings and generated a top and bottom line beat while rewarding investors with a special dividend on top of the regular quarterly dividend. BDCs are required to invest at least 70% of their assets in private or public U.S. firms with market caps under $250 million and distribute 90% of their taxable income to shareholders as ordinary dividends annually, making them a sought-after component within income investing. FSK just declared a $0.67 dividend payable on 10/4/22 with an ex-dividend date of 9/13/22. As some time has passed since my first article on FSK, I wanted to take another look to see what has changed and how FSK is being valued compared to its peers.
Seeking Alpha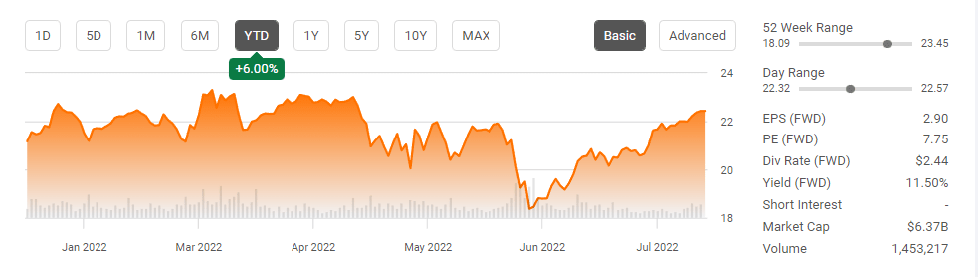
FSK’s valuation compared to other BDCs.
FSK is the second largest BDC by market cap behind Ares Capital (ARCC). Currently, there are 12 BDCs that exceed $1 billion in market cap and 14 that exceed $1 billion in net assets. What may surprise some readers is that FSK is not only the 2nd largest by market cap but also net assets, yet FSK is hardly one of the more popular BDCs. When I think about BDCs, ARCC, Main Street Capital (MAIN), and Gladstone Investment (GAIN) are the first ones that come to mind. Since July 1st there have been 6 articles on MAIN, 3 articles on GAIN, and 7 articles on ARCC published on Seeking Alpha, while FSK has had 2 articles written about it.
FSK may not be as popular as other BDCs, but it is the 2nd largest and I want to see how it compares to its peers across several specific metrics used to valuate BDCs. In addition to reading the 10-Qs and 10-Ks, and looking over individual financials, I have built a table that gets updated quarterly to compare BDCs. I specifically look at the NII to market cap multiple, price to NAV discount, and the dividend yield. NII is a better metric than EPS to utilize for a BDC, so the NII to market cap is a more effective measure than a P/E ratio. This is why I utilize this metric to see how cheap BDCs are trading against their NII. I also like to see if there is a steep discount or a heavy premium with a BDCs price to NAV valuation, in addition to looking at the yield and dividend coverage.
Steven Fiorillo, Seeking Alpha 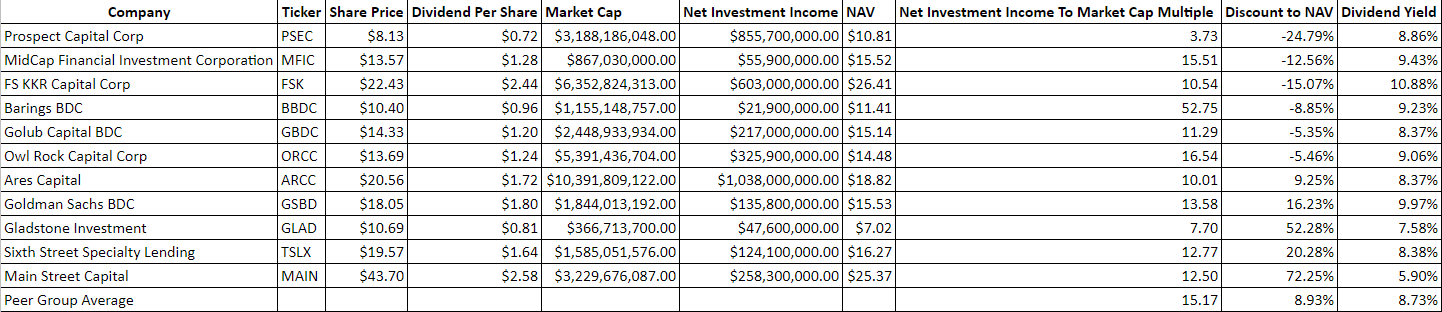
I have selected the following companies as FSK’s peer group:
- Ares Capital
- MidCap Financial Investment Corporation (MFIC) formally Apollo Investment (AINV)
- Goldman Sachs BDC (GSBD)
- Prospect Capital Corp. (PSEC)
- Owl Rock Capital Corp. (ORCC)
- Barings BDC (BBDC)
- Golub Capital BDC (GBDC)
- Sixth Street Specialty Lending (TSLX)
- Gladstone Capital (GLAD)
- Main Street Capital
The Peer group averages are a 15.17x NII to market cap multiple, an 8.93% premium to NAV, and an 8.73% dividend Yield
So how does FSK stack up? FSK has the 4th lowest NII to market cap multiple at 10.54x within its peer group. BBDC’s NII fell off a cliff in Q2, coming in at $21.9 million over the TTM compared to $77.7 million in the TTM at the end of Q1 2022, pushing its ratio to 52.75x. If I exclude BBDC, the peer group average drops to 10.38x, placing FSK slightly above the peer group average.
Steven Fiorillo, Seeking Alpha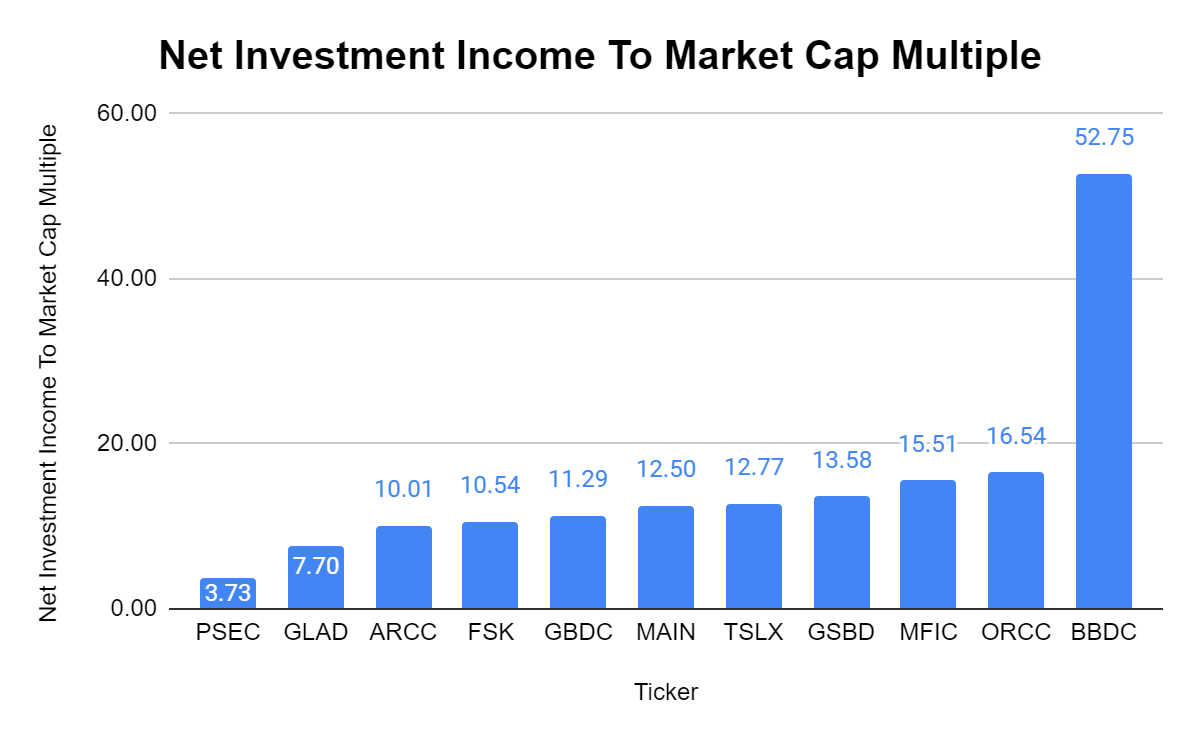
I am cheap, and when it comes to investing want to pay the lowest, I can for assets. I am not opposed to paying a premium for good companies, but if I can get a good company at a discount, that’s even better. Therefore, I look at the discount to NAV when it comes to BDCs. If possible, I want to pay as close to the NAV or even at a discount to NAV. I am willing to pay a premium for ARCC because I personally place ARCC as an upper-tier BDC. FSK trades at a -15.07% discount to NAV which is interesting, especially after its recent bounce off the lows. GLAD and MAIN trade at large premiums, which has pushed the group’s average to an 8.93% premium to NAV.
Steven Fiorillo, Seeking Alpha
BDCs, in my opinion, are ultimately income investments. If someone was chasing capital appreciation as their first investment criteria, I don’t think BDCs would be at the top of their list. I want to get BDCs at the best valuation I can, and if I can get a larger yield at a great valuation, it’s a win-win. The average yield throughout the peer group is 8.73%, and FSK is currently yielding 10.88%.
Steven Fiorillo, Seeking Alpha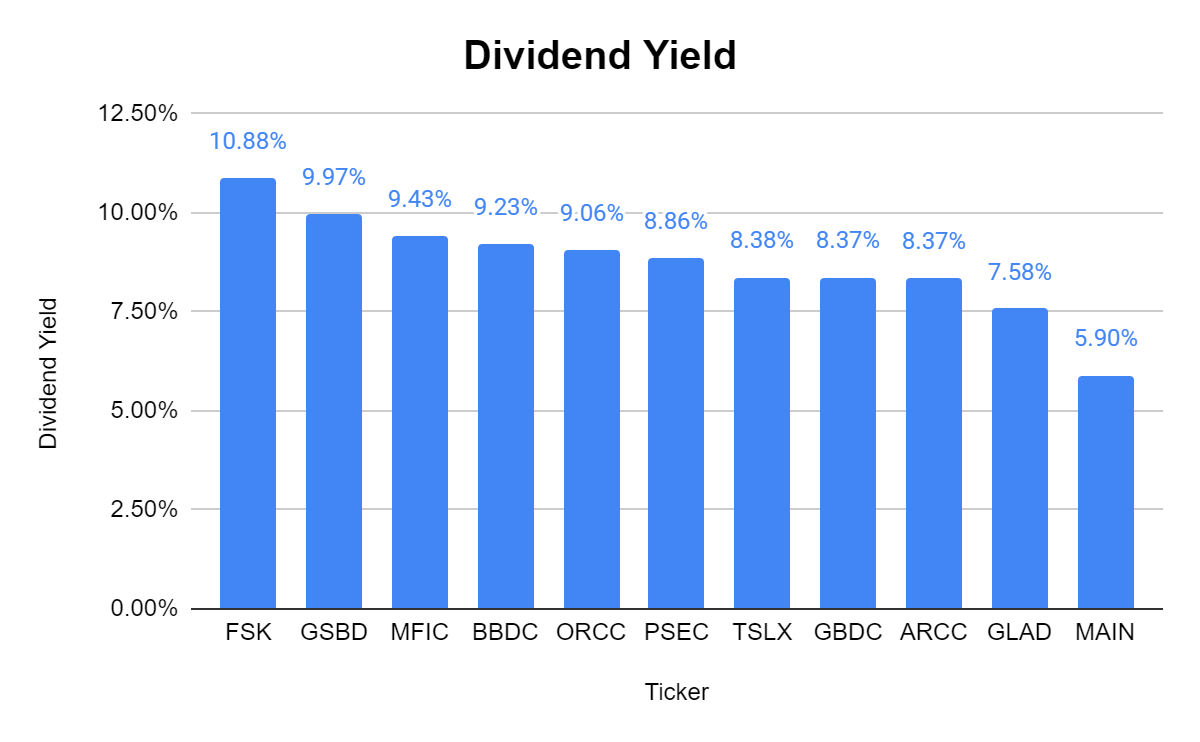
Overall, FSK still looks attractive even though shares have appreciated by roughly 26% this summer. At the current prices, you’re paying a lower-than-average multiple on FSK’s NII, and a -15.7% discount to its NAV. Based on these metrics alone, FSK looks like a buy, then when you add in the 10.88% yield, FSK looks very enticing.
Looking at what FSK did in Q2 and what the future may have in store for it
In Q2 2022, FSK’s NII was $0.71 per share, and its adjusted NII was $0.67, which was a $0.01 beat, while its total investment income was $379 million, beating the streets estimates by $6.29 million. The total fair value of investments was $16.2 billion, of which 71% was invested in senior secured securities. FSK’s weighted average annual yield on accruing debt investments increased to 9.9% from 8.9% since the end of Q1, and its weighted average annual yield on all debt investments was 9.3%, compared to 8.6%. FSK continued its diversification as its exposure to the ten largest portfolio companies declined to 18% compared to 19% at the end of Q1.
Q2 wasn’t great for the private debt markets as origination volumes slowed across the board. In Q1, FSK did $2.1 billion of investments which slowed to $804 million of investments in Q2. The value of FSK’s portfolio marginally declined as contractions in market multiples took place. While these can be viewed as a negative, FSK still executed its share repurchase program and has repurchased approximately $41 million of shares through 8/6/22. Management indicated that FSKs strong liquidity position would provide the ability to make new investments in the 2nd half of 2022 when opportunities present themselves.
FSK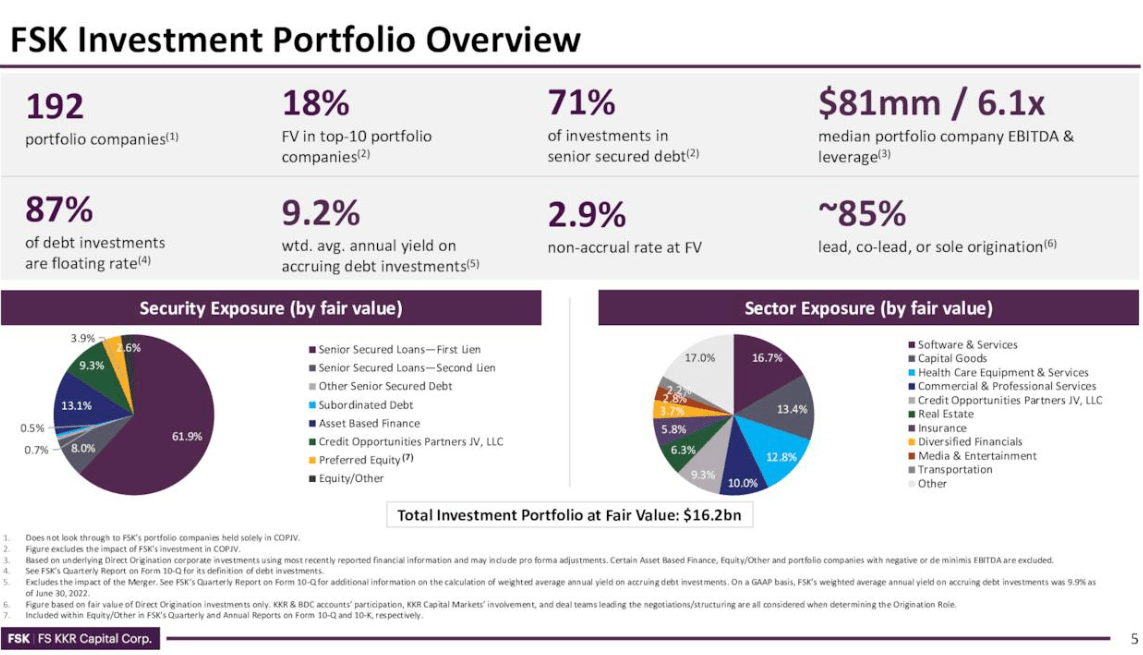
FSK continues to work on increasing its NII per share even though originations declined in Q2. FSK has been rotating out of certain non-income-producing assets into income-producing assets. FSK is also selectively refinancing certain higher-cost unsecured debt on its balance sheet. FSK’s goal was to generate up to $0.15 per share per quarter of additional adjusted net investment income by the end of 2022. At the end of Q2, FSK has achieved $0.15 per share of the incremental quarterly run rate adjusted net investment income that was previously projected.
On the Q2 call, management indicated that they expected to benefit from the rising interest rate environment by approximately $0.04 per share as existing portfolio company interest rate contracts began resetting at higher levels. The higher-end projection is that every 100-basis point move in short-term rates could increase the annual net investment income by up to $0.26 per share. FSK is projecting that Q3 GAAP net investment income will be $0.76 per share while adjusted net investment income will come in at $0.72 per share. The recurring interest income on a GAAP basis is expected to be $317 million after accounting for an increase in base rates.
FSK
Conclusion
I like what I am seeing out of FSK. From a valuation perspective, FSK trades at a lower-than-average NII to market cap and at a discount to NAV while still yielding in the double-digits. Management is executing on their long-term plans even through a difficult private debt market. One aspect I am very bullish on is FSK’s ability to drive additional NII from a long-term perspective. We’re still in a rising rate environment, and with the FED still expected to implement several additional rate hikes in 2022, FSK could significantly benefit. FSK is rewarding shareholders with a normal dividend of $0.61 per share and an additional $0.06 in a special dividend. In 2021 FSK’s dividend totaled $2.47, and after the next dividend, FSK will have paid out $1.98, which is 80.16% of what was paid in 2021. I am bullish on FSK as management continues to drive value for shareholders through difficult operating environments.
Be the first to comment