

Oat_Phawat
Introduction
Saint Helier, Jersey-based Caledonia Mining Corp. Plc (NYSE:CMCL) released its production update for the fourth-quarter results of 2022 and Blanket Mine Guidance for 2023 on January 13, 2023.
Caledonia’s primary asset is Blanket Mine, a gold mine in Zimbabwe. The company has 64% ownership.
CMCL Blanket mine Map Presentation (CMCL Presentation)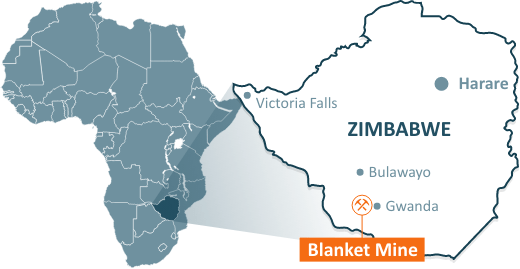
1 – 4Q’22 and full-year 2022 Gold production results Snapshot
1.1 – Summary
The company announced its full-year 2022 production results on January 13, 2023.
Gold production for 2022 was 80,775 ounces, up 19.7% compared to 67,476 ounces in 2021, above the top end of the guidance range, and was a new record.
Also, the company released the 2023 guidance, including Bilboes oxides:
The company expects 87.5K – 97K Au Oz in 2023 on a consolidated basis with an AISC between $1,150 and $1,250 per ounce.
|
Bilboes oxides |
Blanket |
Group consolidated |
|
|
Gold production in Ounces |
12,500 -17,000 |
75,000 – 80,000 |
87,500 – 97,000 |
|
On-mine cost/oz in US$ |
1,200 – 1,320 |
770 – 850 |
900 – 1,000 |
|
All-in sustaining cost/oz in US$ |
N/A |
N/A |
1,150 – 1,250 |
|
Capital expenditure ($’m) |
0.5 |
28.3 |
30.9 |
1.2 – Most Recent transactions and Bilboes Project explained.
- On November 2021: Caledonia Mining acquired mining claims over Maligreen – which contains an M&I resource of 442koz at 1.71g/t & inferred resource of 420koz at 2.12g/t in the Zimbabwe Midlands.
- On November 2022: The company purchased Motapa. A large-scale exploration project with excellent geological prospectivity and in a strategic location adjacent to Bilboes.
- On January 6, 2022, the company completed the purchase of Bilboes for a total consideration of 5,123,044 shares, representing approximately 28.5% of Caledonia’s fully diluted equity. A 1% NSR Bilboes has a NI43-101 compliant P&P Reserve of 1.79Moz @ 2.34 g/t, an M&I Resource of 2.56Moz @ 2.26 g/t, and an additional Inferred mineral resource of 577Koz @ 1.89 g/t (see map below).
CMCL Bilboes acquisition (CMCL November presentation) CMCL Bilboes grade per tonne (CMCL Presentation)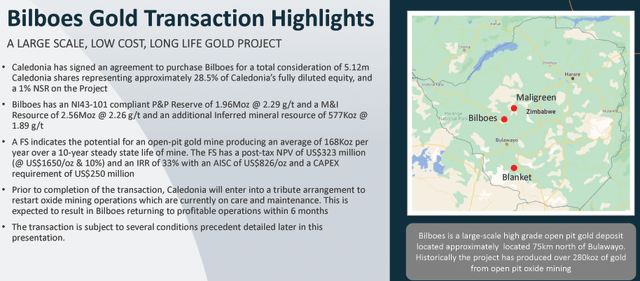
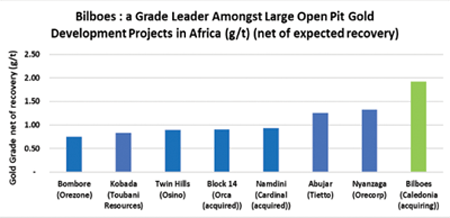
Note: Bilboes is one of Africa’s most significant gold development open-pit projects, with a gold production estimated at 12.5K-17K Oz in 2023.
CMCL Bilboes feasibility study November (CMCL Presentation)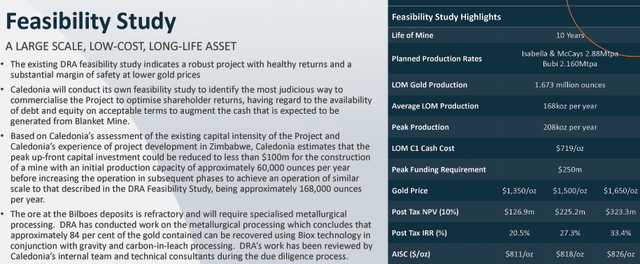
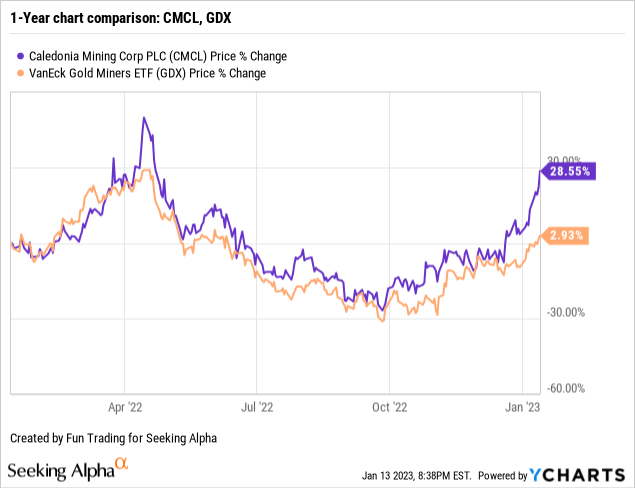
2 – Stock performance
The stock performance has been quite exceptional on a one-year basis, as shown below. We can see that CMCL was showing a bullish Cup & Handle pattern with a low in October 2022. CMCL is up 29%.
3 – Investment Thesis
The company is a definite candidate for a long-term investment in 2023. The company has virtually no debt and a steady cash flow with future growth with the exciting Bilboes open-pit Project.
Until recently, the company’s unique producing asset was the Blanket mine in Zimbabwe, but it is trying to diversify and expand with the Bilboes project.
Thus, the business model is getting better but is still risky from a long-term investment perspective based on the fact that all assets are located in Zimbabwe.
Furthermore, the outlook for gold is bullish in 2023, with the FED expected to slow down gradually, its hiking pace this year with inflation starting to decrease. The gold price is now well over $1,900 per ounce and up nearly 6% YoY.
CMCL Gold and Silver 1-Year chart (Fun Trading StockCharts)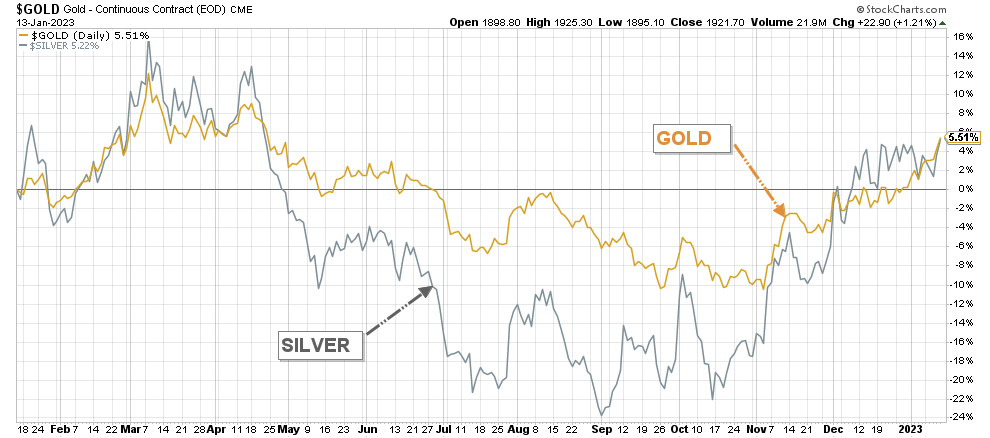
Thus, I recommend accumulating CMCL on weakness for the long-term and trading short-term LIFO with a minimum of 50% of your long position to alleviate any potential risks and take advantage of the gold volatility, which is very high at the moment.
Caledonia Mining – Balance Sheet history until 3Q22 and 4Q22 Gold production – The Raw Numbers
| CMCL | 3Q21 | 4Q21 | 1Q22 | 2Q22 | 3Q22 | 4Q22 |
| Total Revenues $ million | 33.50 | 32.14 | 35.07 | 36.99 | 35.84 | – |
| Quarterly Earnings (excl. non-controlling %) $ million | 6.94 | 4.22 | 5.94 | 11.38 | 8.61 | – |
| EBITDA $ million | 15.11 | 11.44 | 14.52 | 18.87 | 16.90 | – |
| EPS (diluted) $ per share | 0.57 | 0.33 | 0.45 | 0.88 | 0.65 | – |
| Operating Cash Flow $ million | 7.11 | 9.10 | 10.16 | 16.72 | 8.92 | – |
| CapEx in $ million | 9.01 | 14.07 | 9.96 | 13.42 | 11.15 | – |
| Free Cash flow | -1.90 | -4.98 | 0.20 | 3.29 | -2.23 | – |
| Total Cash in $ million | 13.21 | 17.15 | 15.29 | 10.86 | 8.26 | – |
| Total LT Debt in $ million | 0.27 | 0.89 | 0.86 | 0.00 | 2.09 | – |
| Dividend $/ share | 0.14 | 0.14 | 0.14 | 0.14 | 0.14 | – |
| Shares Outstanding (diluted) in million | 12.17 | 11.71 | 13.20 | 12.93 | 13.25 | 17.3* |
| Gold Production | 3Q21 | 4Q21 | 1Q22 | 2Q22 | 3Q22 | 4Q22 |
| Quarterly Production K Oz | 18,965 | 18,604 | 18,515 | 20,091 | 21,120 | 21,049 |
| Gold Price in $ | 1,764 | 1,768 | 1,848 | 1,840 | 1,696 | ~1,725 |
| AISC in $ | 870 | 1,020 | 968 | 925 | 944 | ~1,000 |
Data Source: Company press release.
* Bilboes press release: Following the issue of Completion Shares, Caledonia will have a total number of shares of 17,258,923 common shares of no par value each.
Analysis: Revenues, Free Cash Flow, Net Debt, and Gold Production
1 – Quarterly revenues history
CMCL Quarterly Revenues history (Fun Trading)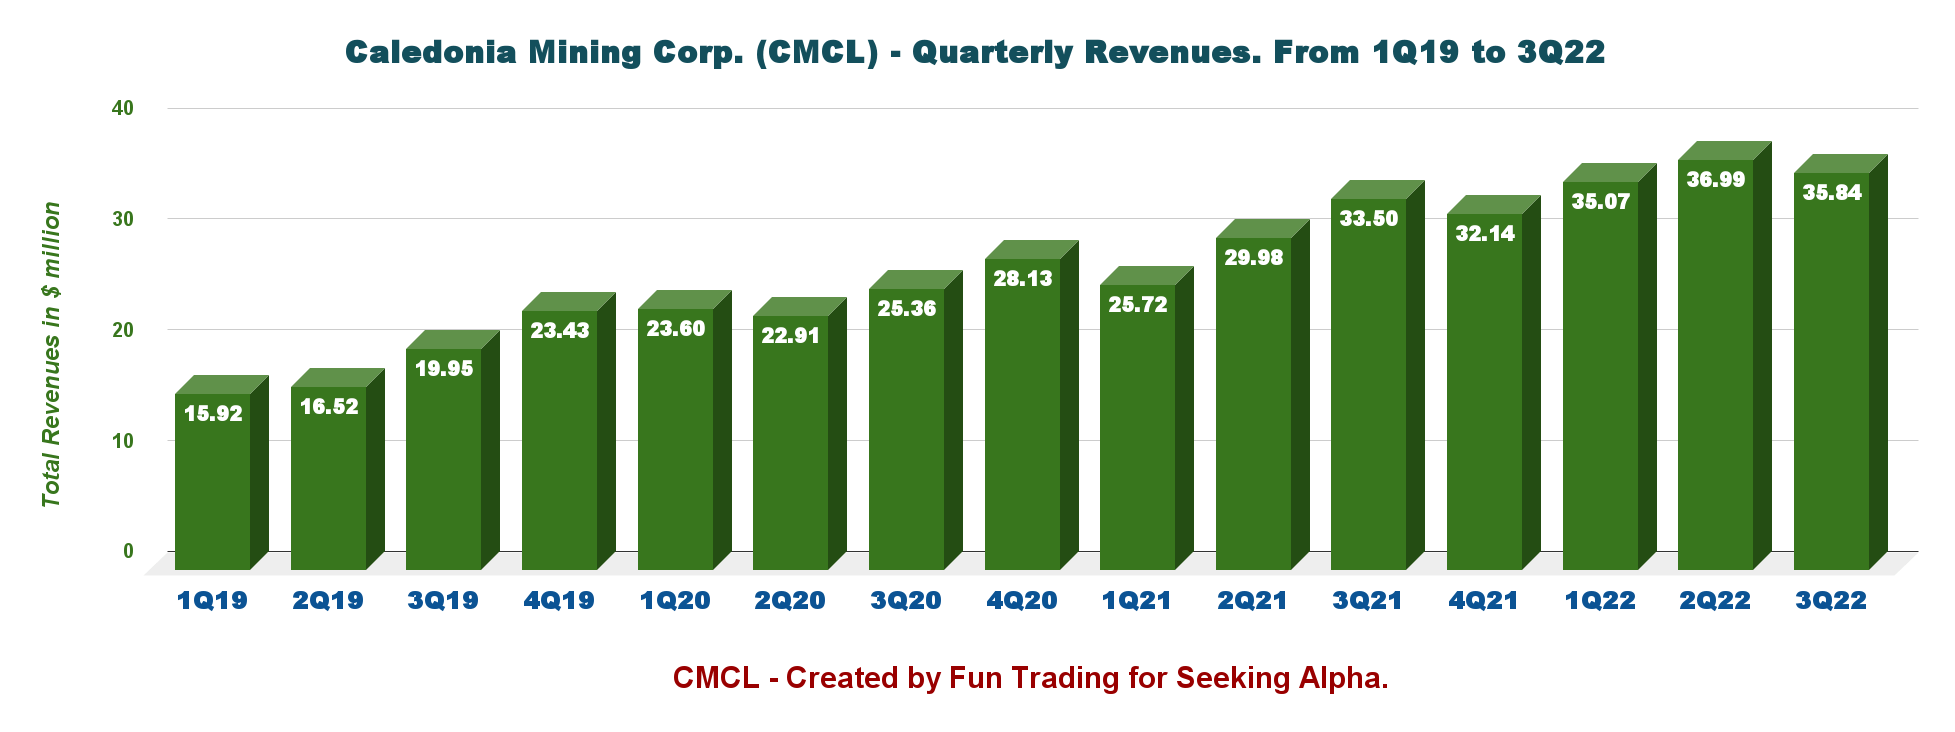
Revenues were $35.84 million in the third quarter of 2022. Net income, excluding non-controlling interests, was $8.61 million or $0.65 per diluted share.
2 – The Quarterly Free cash flow history
CMCL Quarterly Free cash flow history (Fun Trading)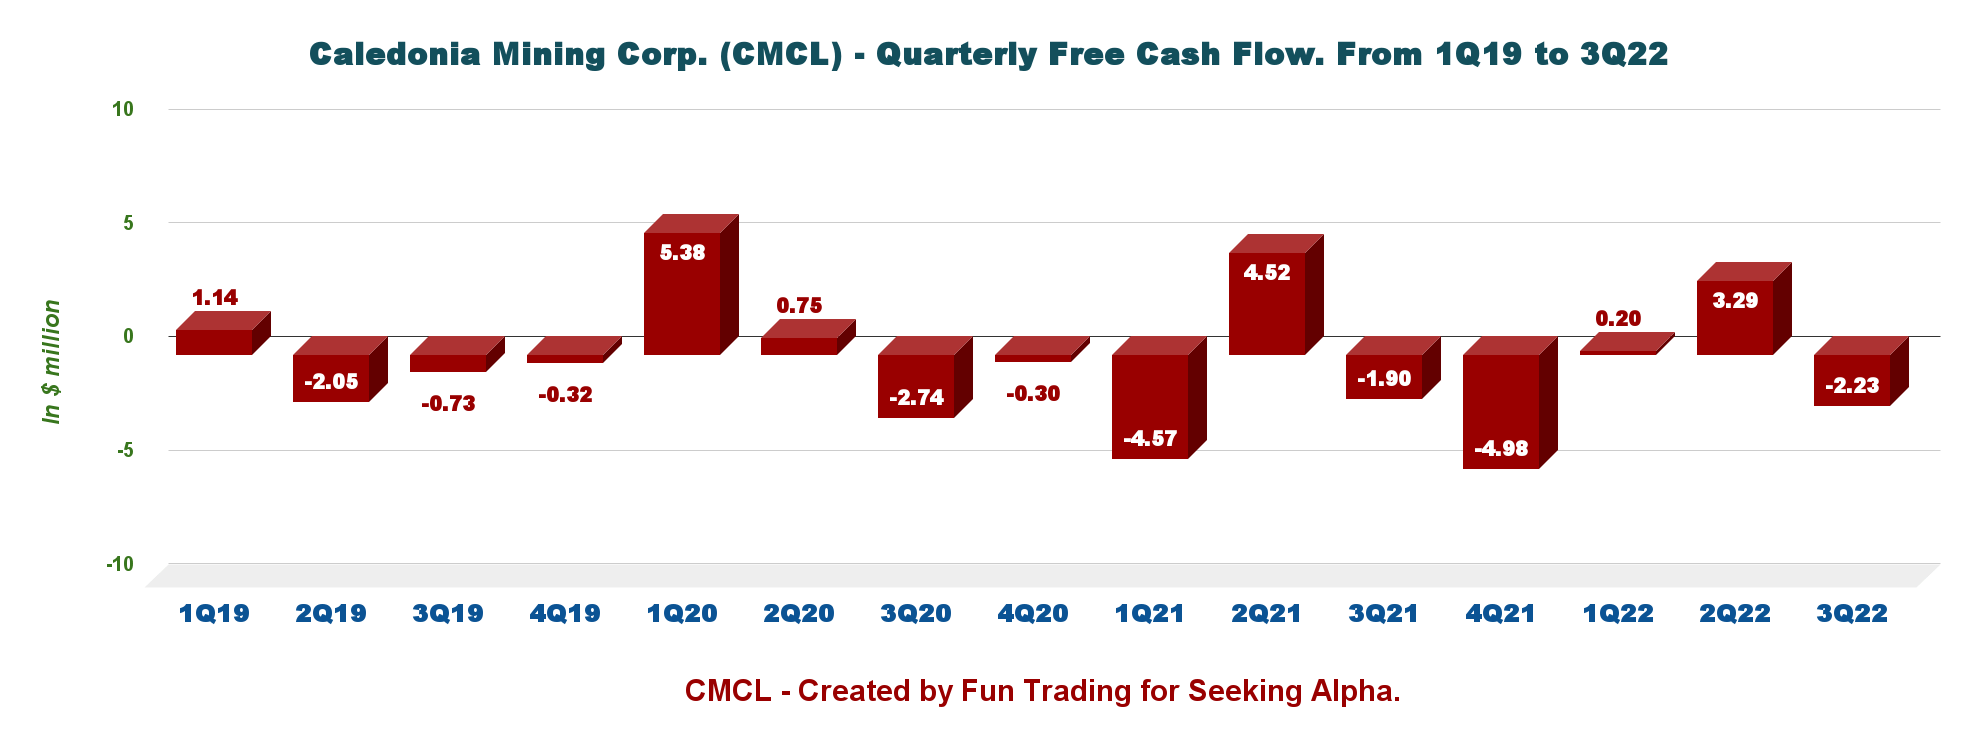
The generic free cash flow is the Cash from operations minus CapEx. I am expecting another loss in 4Q22 based on the low gold price in 4Q. The company is paying a quarterly dividend of $0.14 per share or a dividend yield of 3.63%.
3 – Balance sheet history
CMCL Quarterly cash versus debt history (Fun Trading)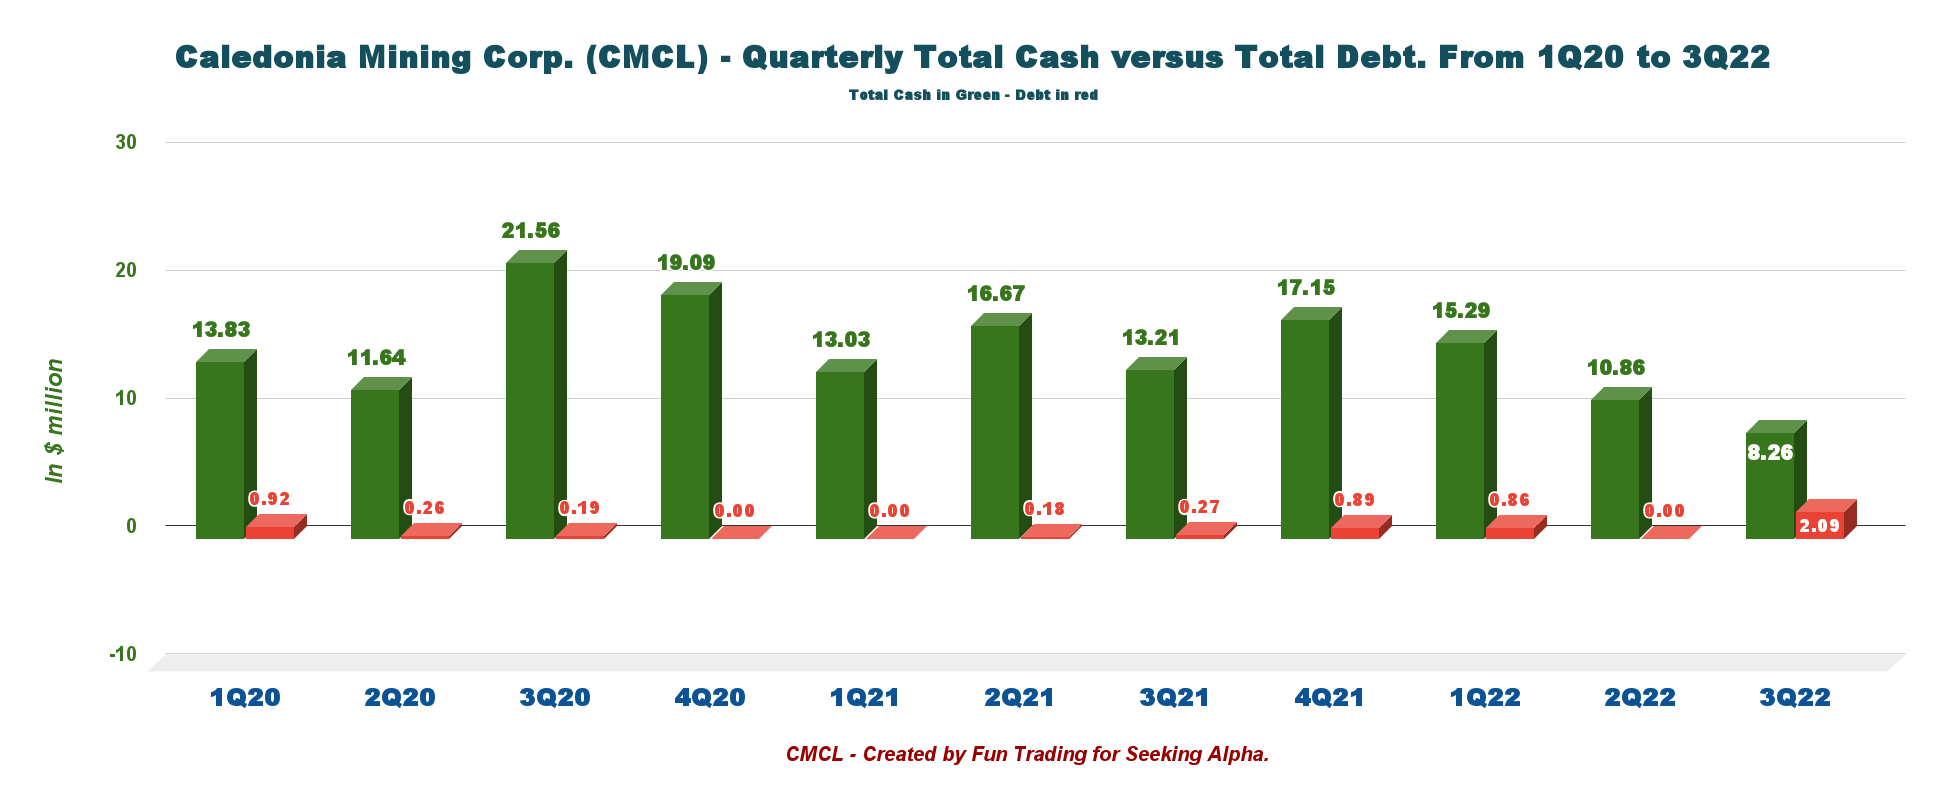
The company has no long-term debt. The cash position was $8.26 million at the end of September 2021, and the debt of $2.09 million. The balance sheet in 4Q22 will be similar.
4 – Quarterly production analysis
4.1 – Gold production for 4Q22 and full-year 2022.
Gold production for the quarter was 21,049 Au Oz, up 13.1% compared to the same quarter a year ago and slightly down sequentially. Production for 2022 was 80,775 ounces, up 19.7% in 2021 or 67,476 ounces.
CMCL Quarterly Gold production history (Fun Trading)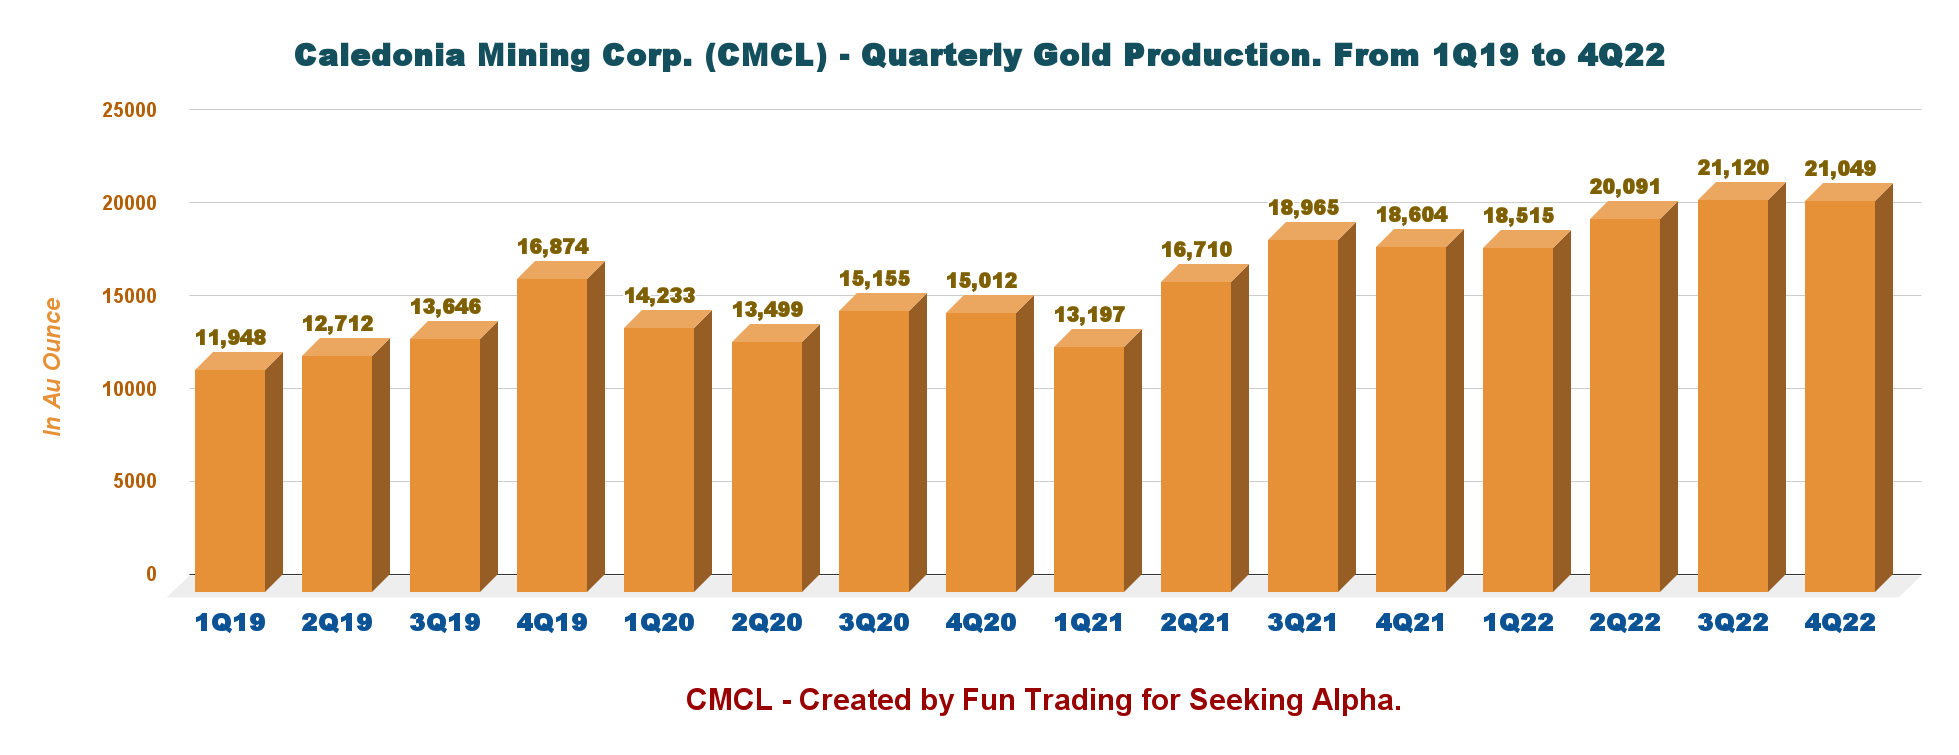
4.2 – Historical gold production and AISC
The company did not indicate the Gold price and the AISC for the 4Q22.
CMCL Quarterly Gold price and AISC history (Fun Trading)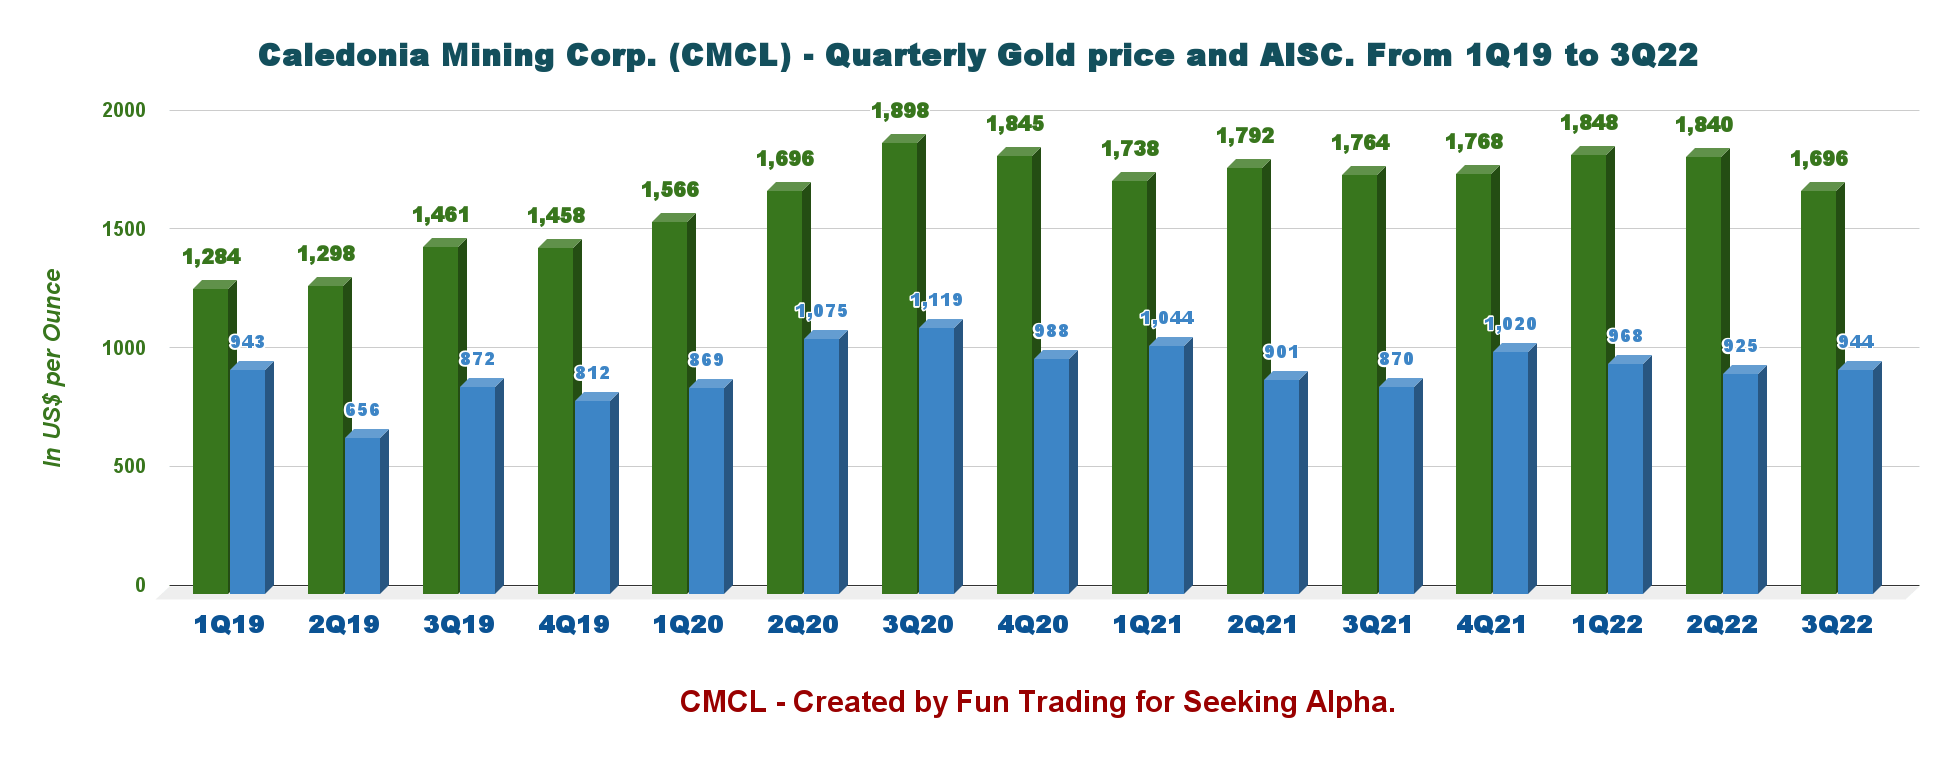
| Caledonia Mining Corp. | 2017 | 2018 | 2019 | 2020 | 2021 | 2022 |
| Gold Produced in Ounce | 56,133 | 54,511 | 55,182 | 57,899 | 67,476 | 80,775 |
| All-in Sustaining Costs ($/oz) | 847 | 802 | 820 | 946 | 982 | N/A |
Technical analysis and Commentary
CMCL TA Chart short-term (Fun Trading StockCharts)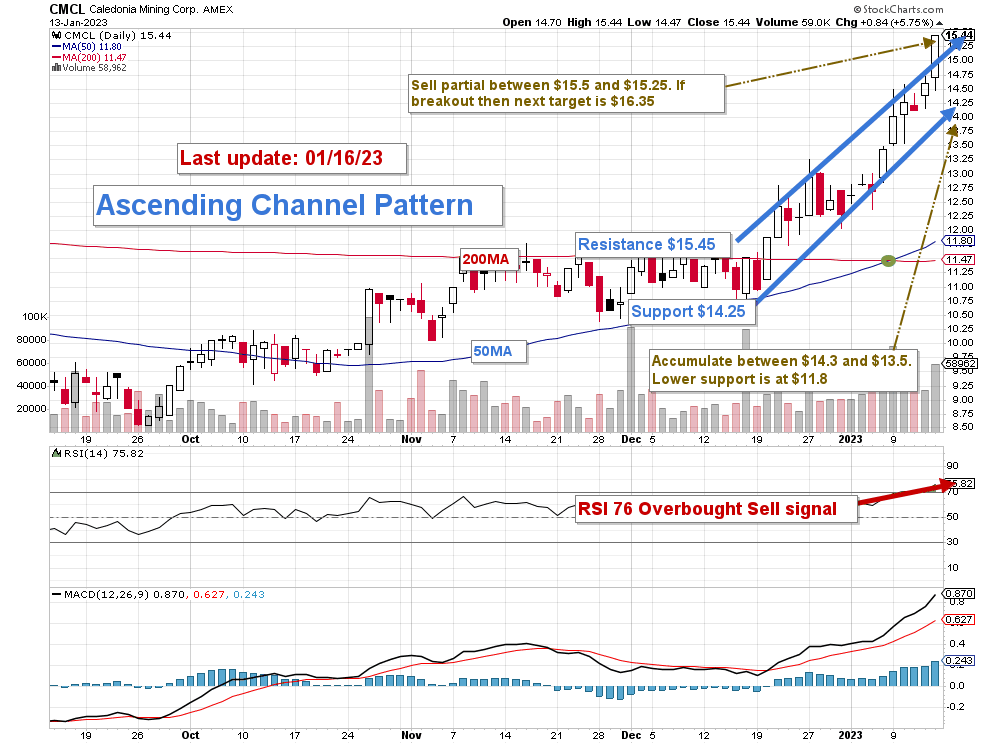
Note: The chart is adjusted for the dividend.
CMCL forms an ascending channel pattern with resistance at $15.45 and support at $14.25. The RSI is now 76 and tells us that CMCL is overbought and flashing a sell signal.
Yesterday’s CPI number (6.5%) revealed that inflation is slowing but still runs at an uncomfortable rate, which may force the Fed to hike interest rates by 50 points at the end of January.
The market is bullish on gold, and we closed on Friday at $1,921 per ounce. However, the gold price could retrace below $1,800 per ounce if the FED decides to hike by 50 points at the end of January. However, even if gold may retrace a little in 2Q23, I am bullish on gold for H2 2023.
Ascending channel patterns or rising channels are short-term bullish in that a stock moves higher within an ascending channel, but these patterns often form within longer-term downtrends as continuation patterns. The ascending channel pattern is often followed by lower prices.
I recommend using about 50% of your position for trading the current volatility. The trading strategy is to sell LIFO between $15.25 and $15.5 with potential higher resistance at $16.35. Conversely, I suggest accumulating between $14.3 and $13.5 with possible lower support at $11.8.
Watch the gold price like a hawk.
Warning: The TA chart must be updated frequently to be relevant. It is what I am doing in my stock tracker. The chart above has a possible validity of about a week. Remember, the TA chart is a tool only to help you adopt the right strategy. It is not a way to foresee the future. No one and nothing can.
Author’s note: If you find value in this article and would like to encourage such continued efforts, please click the “Like” button below as a vote of support. Thanks.
Be the first to comment