

gesrey
Investment Thesis
The Vanguard Mega Cap ETF (NYSEARCA:MGC) is an excellent alternative to S&P 500 ETFs like SPY, VOO, and IVV. MGC competes well on fees, has almost identical fundamentals, and has slightly outperformed the S&P 500 since its December 2007 launch. My message to readers with today’s article is not to fear these mega caps. They are where they are today because they dominate their respective industries and are highly profitable. For these reasons, MGC will be a successful long-term ETF, and I hope the information presented in this article can help you get in at the right price.
ETF Overview
MGC tracks the CRSP US Mega Cap Index, employing a passively-managed, full-replication approach. CRSP Indexes are designed according to dynamic breakpoints based on the total market capitalization of the investable U.S. market. The mega-cap universe includes companies that fall in the top 70% of market capitalization. However, to prevent unnecessary turnover, a constituent won’t be removed if it’s still within the top 76% at the rebalancing date. From an efficiency standpoint, this is smart. Removing these stocks would add to the fund’s operating expenses, and their weights would be so small that it would hardly affect the entire portfolio.
MGC has a 0.07% expense ratio and 234 constituents with market capitalizations ranging from $17.8 billion to $2.5 trillion. Including the two share classes for Alphabet (GOOGL, GOOG), 34.30% of the total weight is in the top ten holdings, 48.86% in the top 25, and 63.47% in the top 50. The top ten are below, plus Exxon Mobil (XOM), with a 1.38% weight.
Vanguard
MGC’s sector composition is our first clue for its similarity to the S&P 500. There are a few differences; MGC slightly overweights Technology and underweights Energy, Industrials, Materials, and Real Estate.
Morningstar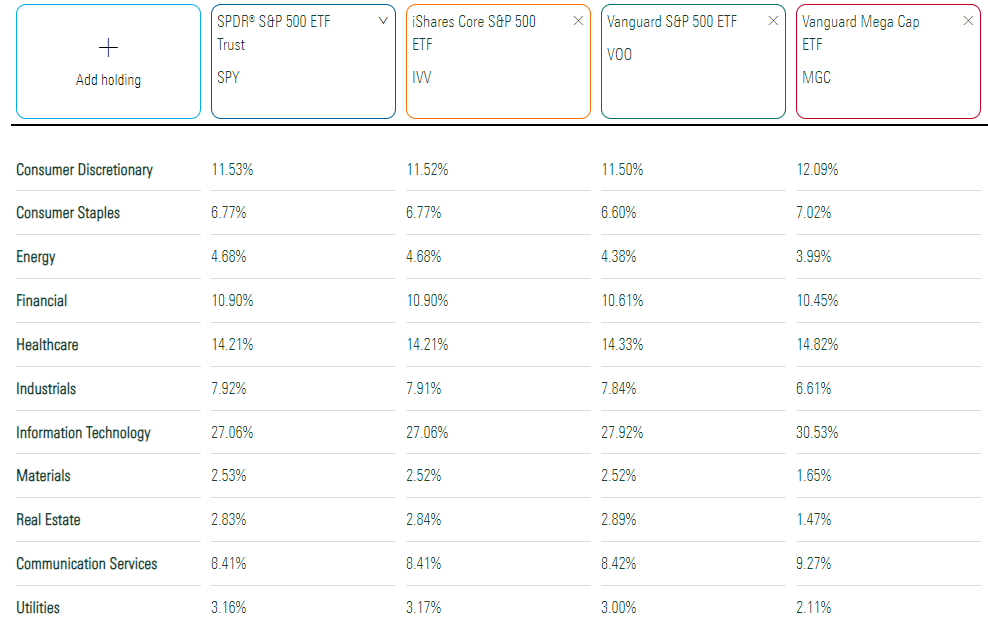
Performance Analysis
Since its December 2007 launch, MGC has achieved a 9.10% annualized return, slightly beating three S&P 500 Index ETFs. Annualized volatility, as measured by standard deviation, was somewhat lower, and as a result, its risk-adjusted returns (Sharpe and Sortino Ratio) were superior.
Portfolio Visualizer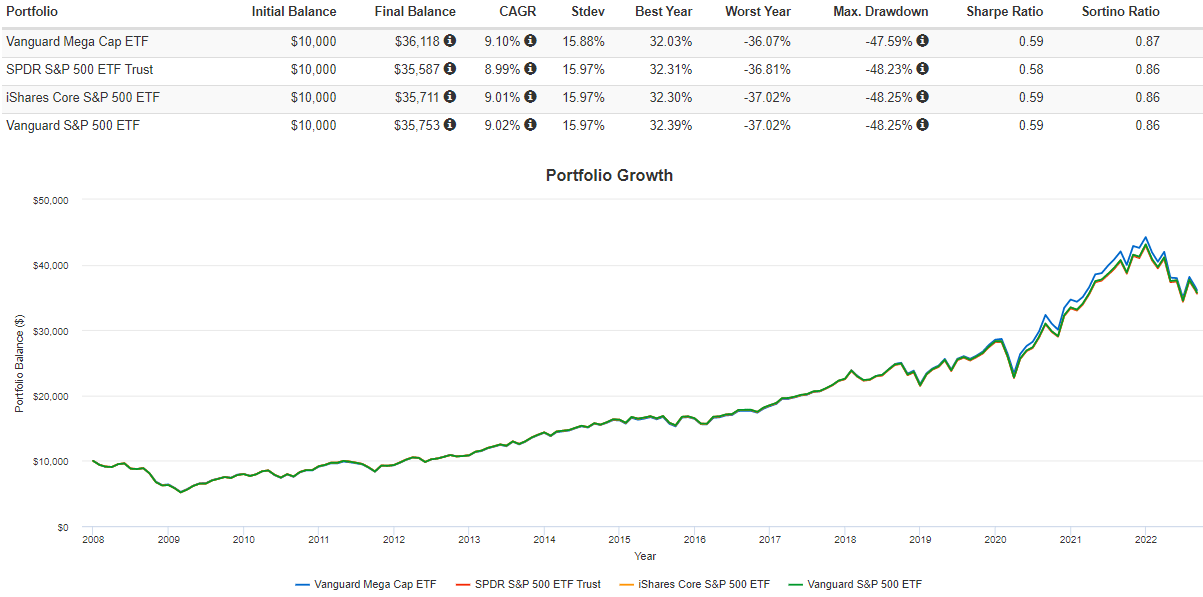
MGC has experienced four double-digit drawdowns since 2008:
- January 2008 – February 2009: 47.59%
- January 2022 – June 2022: 21.04%
- February 2020 – March 2020: 18.53%
- October 2018 – December 2018: 13.00%
MGC took three years to recover from the Great Financial Crisis drawdown and still hasn’t recovered from this year’s 21.04% decline. However, I don’t believe we’re in for a repeat of 2008-09 because S&P 500 earnings surprises are still close to the long-term average of 7%. The market is merely reversing the extraordinary gains made in 2020-21 when earnings surprises exceeded 20%.
Yardeni Research
We saw the same thing happen from 2008-2010 when earnings surprises fell below 20%, but hard-hit stocks ultimately recovered and led the longest-running bull market in history. In the early 2000s tech crash, when earnings surprises bottomed near 1%, high P/E and non-profitable tech stocks were the problem, but that’s hardly the case today. Only nine constituents in MGC, notably Amazon (AMZN), reported negative EPS last quarter.
The table above shows three consecutive quarters of stable earnings surprises, so I don’t believe there’s a reason to panic yet. Until we get more data on the trend next quarter, the best thing to do is to try to buy quality companies at reasonable valuations, so let’s look at that next.
Fundamental Analysis
I’ve prepared this fundamental analysis to highlight MGC’s top 25 holdings. For reference, I’ve also included SPY’s metrics, which show how similar the two ETFs are in virtually all areas.
The Sunday Investor
The first thing to note is how nearly every top holding earns an A+ Profitability Grade from Seeking Alpha. Profitability Grades are relative to a company’s sector peers, and I’ve found them to be a reasonable proxy for quality. I’ve normalized weighted-average profitability scores on a scale of 1-10 for 220 large-cap ETFs in my database, ranging from 7.22 to 9.96. MGC’s is 9.62, and SPY’s is 9.37, so I feel pretty comfortable about the mega-caps’ quality.
The remaining metrics are virtually identical. MGC offers a 13.82% and 17.42% forward-looking sales and earnings growth rate and trades at 23.77x forward earnings. Six months ago, it was 25.74x, which is about an 8% decline in valuation. Amazon and Tesla (TSLA) still trade at ultra-high valuations, despite being down 24% and 22% this year. Investors should avoid these stocks until earnings surprises improve, but you can’t do that entirely with MGC. The Vanguard Mega Cap Value ETF (MGV) is an alternative worth considering. MGV trades at just 17x forward earnings and should hold up better until positive market sentiment resumes.
The Sunday Investor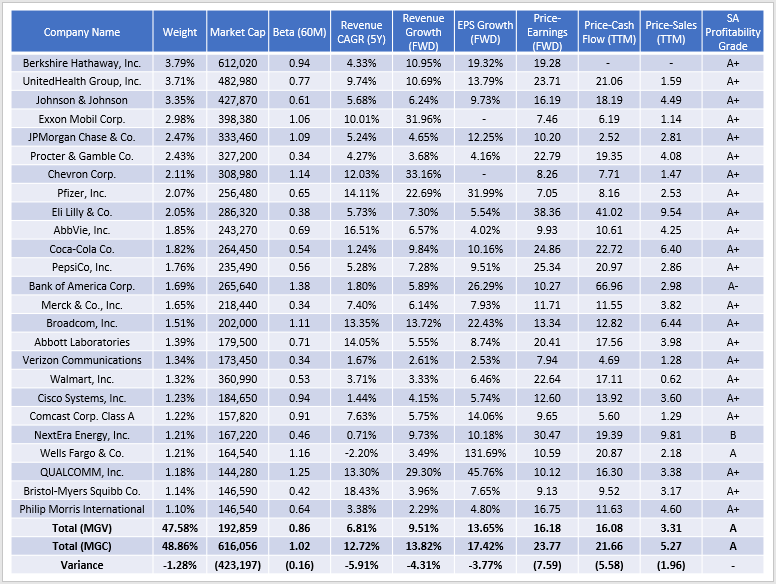
MGV features a forward earnings valuation 7.59 points less than MGC but sacrifices 4.31% and 3.77% on forward-looking sales and earnings growth. MGV may also be more appropriate if you still doubt the strength of the mega caps. Its weighted-average market capitalization is $193 billion, $423 billion less than MGC, and its five-year beta of 0.86 indicates a good level of downside protection. It’s my preference in this current environment, as I think the pros of avoiding high P/E stocks outweigh the cons of lower growth.
Investment Recommendation
MGC is an excellent alternative to S&P 500 Index ETFs like SPY, IVV, and VOO, since it’s a more focused portfolio with a marginally higher growth profile. Its 0.07% expense ratio is competitive, and MGC has performed well since its inception in December 2007. I don’t think the risks of investing in this well-diversified ETF are significant over the long run, but short-term headwinds exist as markets correct the enormous gains from 2020-2021. It’s challenging to predict the bottom, but valuation seems to be driving it, and investors may find value ETFs like MGV safer until we get a better sense of market direction.
Be the first to comment