


HowLettery/iStock via Getty Images
Meta Platforms, Inc. (NASDAQ:META) is expected to announce its quarterly earnings on the 26th of October. Given that company CEO Mark Zuckerberg is essentially the face of its next-generation social connectivity endeavour, the stock would theoretically be highly sensitive to news and announcements about advances made in this space. However, as equity market performance in the Year to Date (YTD) has shown, “hype” doesn’t carry very far.
What the company does have, instead, are some strong fundamental trends in revenues from its existing business which brings with it specific challenges.
Meta Revenues: Segment and Trends
The company’s quarterly financial statements indicate that over 98% of its revenues typically comes from advertising. Applying a dual-level “heat map” schema on quarterly revenues by region and “Daily Active User” (DAU) metrics along with total quarter-on-quarter (QoQ) changes reveal some very interesting trends:
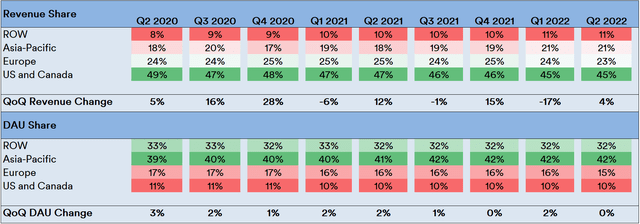
Source: Created by Sandeep G. Rao using data from Meta’s Financial Statements
- While the Asia-Pacific and the “rest of the world” (ROW) make up over 73-76% of the company’s DAUs, the bulk of advertising revenues (in the 68-76% range) come from European, US and Canadian users on the platform.
- Overall reported DAUs for each quarter indicates that user growth is more or less dead in the water.
The second point has a “catch” of sorts: the company states that the likes of DAU do not include users on Instagram, WhatsApp, or any other product – unless said product led to usage of the Facebook platform.
As such, the company doesn’t offer any significant quanta of data on other apps beyond a couple of statements on occasion. But other sources do have a number of estimates. As it turns out, it’s Facebook subsidiary – and standalone app – Instagram that has been raking in users and is currently en route to having more than 2.3 billion users:
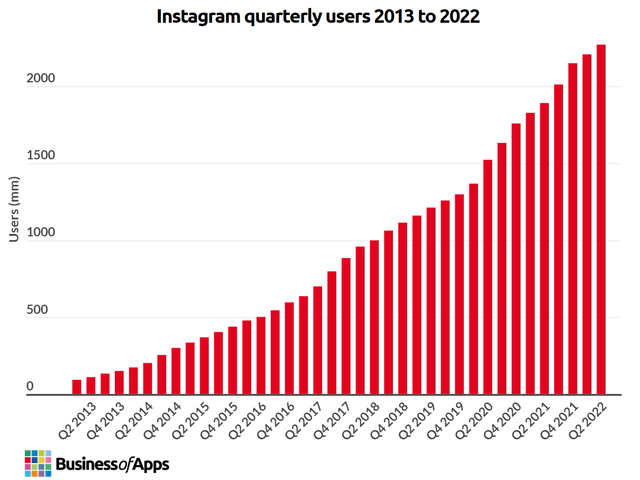
Visualization by Business of Apps
Like Facebook, Instagram had a big drop in revenues circa Q1 this year, from which it staged a rather decent recovery in the subsequent quarter:
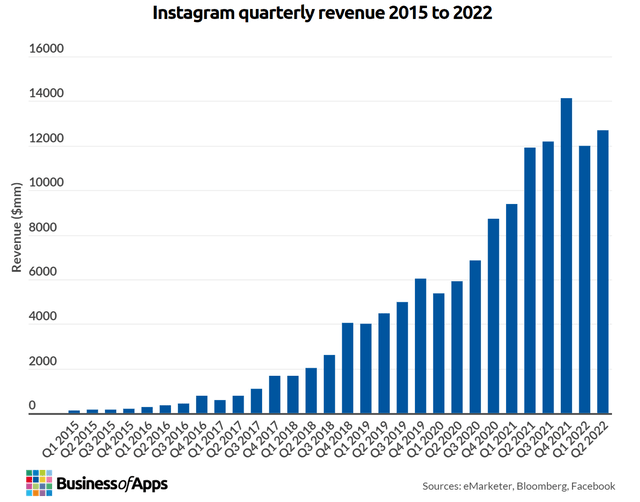
Visualization by Business of Apps
Instagram’s estimated share of the company’s total revenue has been skyrocketing since 2015. However, when contextualized with the number of users, its share of revenue has been running stable at 0.02% per million users since 2019.
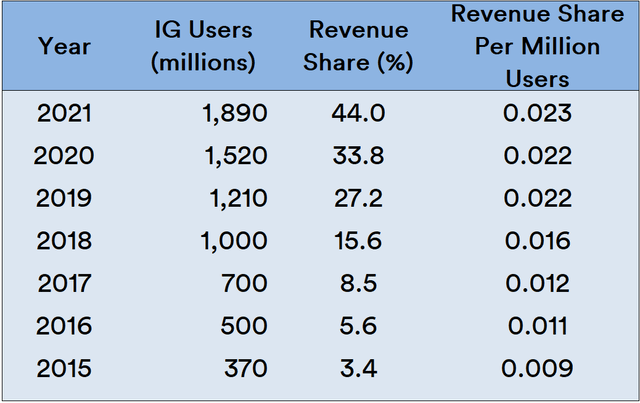
Source: Created by Sandeep G. Rao using data from Business of Apps
Unlike popular conceptions about Facebook being a “boomer” hangout and Instagram being more popular with the “Gen Z” crowd, the estimates by third parties (with respect to Instagram) and the company itself (with respect to the Facebook platform) indicate that both apps’ main user demographic is predominantly in the 18-44 age range. As with Facebook, while user growth is strong in the Asia-Pacific, Instagram’s revenues are disproportionately attributable to the Western Hemisphere.
These facts should drive home a couple of facts about the company’s financial prospects. Firstly, while much ado is generated about the “Metaverse”, it accounts for very little of the company’s revenues in the present (and possibly for quite some time in the near future). Since this next-generation concept is relatively early technology without nearly as much traction as the company’s existing networks, it’s also possible that there will be numerous competitors or alternatives upcoming, some of which are likely in “stealth mode” currently.
Secondly, the company’s captive platform audience and disproportionate revenue breakdown make it heavily dependent on advertising sales in the Western Hemisphere. Like Apple – which was discussed in the last article – the Meta story is very much an “American” story (or, perhaps broadly, a “Western” one).
Given the importance of ad spending for the company’s financial health, a study of the US advertising landscape (in particular) would be helpful. This isn’t necessarily a straightforward process.
Estimating Ad Spending Trends
There is no single tracker for monitoring ad spending by thousands of companies and brands. However, what can be seen as becoming more and more apparent is that digital ad spending is here to stay.
Some sources estimate that the digital domain will stabilize at a 67% share of all ad spending in the U.S over the course of the decade.
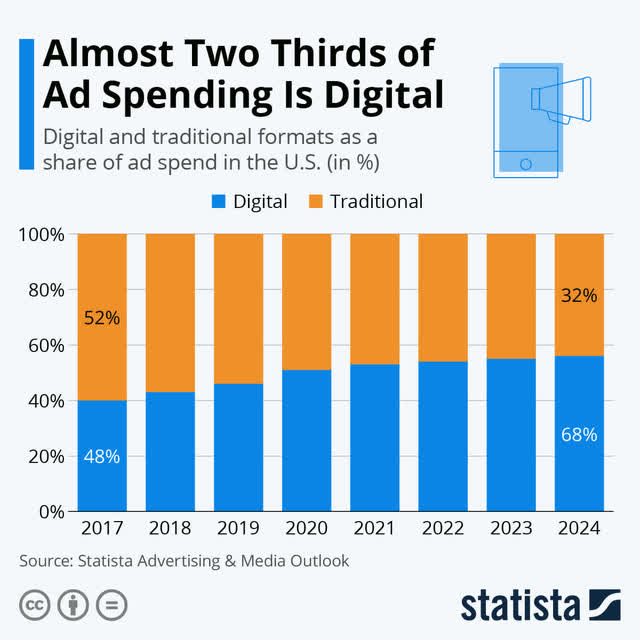
Visualization by Statista
As ad spending proliferates into the digital domain, year-on-year growth on digital ad spending is estimated to trend toward a “flattening” over the course of the decade.
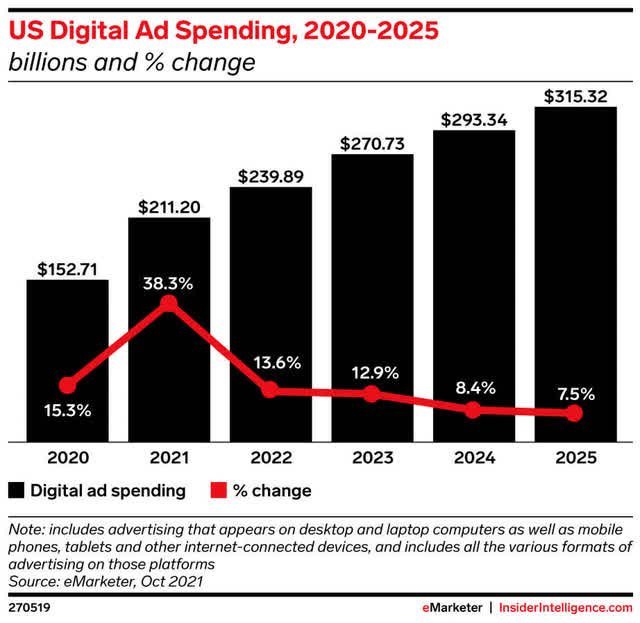
Visualization by Insider Intelligence
Other estimates indicate that the company will be entering a steady state of sorts with a roughly 23-25% share of US digital ad revenues and Instagram becoming an increasingly significant contributor.
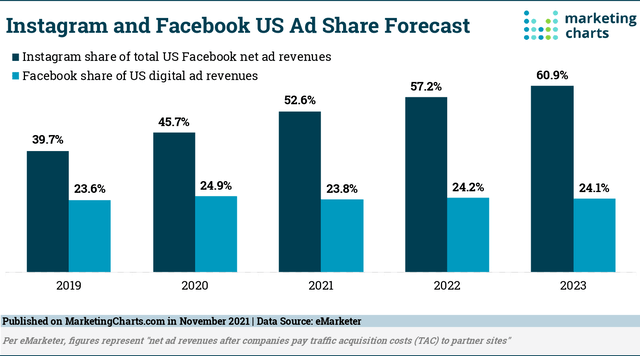
Visualization by MarketingCharts.com
It bears noting that, historically, ad spending can be made a function of expected consumption that, in turn, is related to individual disposable income. As a previous article that gave context behind the imminence of more “retesting of lows” indicated, US individual earnings (and disposable incomes) are under significant pressure.
This has been apparent with the S&P 500 Advertising Sub-Industry Index largely following trends in the larger S&P 500 with a near-identical decline in levels:
Visualization by Bloomberg
The company’s quarterly revenues have typically shown pretty strong trends in seasonality but given that overall consumption of goods and services is generally trending downwards, a pullback on ad spending is being expected.
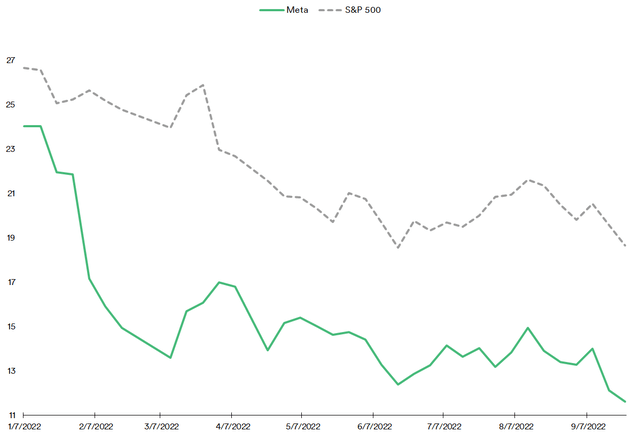
Price Ratio Trends: Select
In terms of price ratios of the broader market versus the stock itself, the measuring the median Price-to-Earnings (PE Ratio) trajectories of both the stock and the S&P 500 (SPX) for each calendar year – with correlation measures cross-layered as a form of “goodness of fit” – indicate that the stock’s trajectory is beginning to mirror that of the broader market.
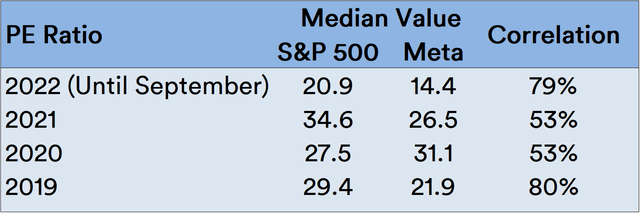
Source: Created by Sandeep G. Rao using data from GuruFocus and Zacks’
This is essentially a return to 2019 for the stock’s performance. However, it bears remembering that 2019 shouldn’t be considered a “high water mark” for the stock: the PE Ratio for both the index and stock show increasingly stronger correlation in more recent periods.
Source: Created by Sandeep G. Rao using data from GuruFocus and Zacks’
Conclusion and Recommendation
As with Apple, there is an increasing correlation with the broader market which, in turn, has a rather bearish outlook. As with Apple, the company is dependent largely on the Western Hemisphere. However, unlike Apple, however, there is no “brand equity” perceived by the user base in the company’s products.
There is ample scope for making the argument that, at least in its present state, the company is more of a “value” stock than a “growth” stock. Current economic conditions would likely slow down the evolution of new modes of social networking and commerce. However, more data is needed to assess as to whether the company’s early forays in this new space will give it the type of advantage it had in social media.
In terms of earnings, it’s possible that the company might have taken a hit in Q3 in terms of accruing ad revenues. However, given that the digital domain is already the dominant choice for advertorial placement, the company’s decades-long focus on building a captive audience space isn’t for naught. The larger question to be asked is: in times of depleting revenues and slowing growth, would companies that generally use the platforms for advertising continue to aggressively campaign for their products or would they cut back on spending?
A “wait and watch” approach is the most prudent choice to make in this case. Hence, the recommendation is to “Hold.”
Be the first to comment