

mihtiander/iStock via Getty Images
If you have been following my Apple (NASDAQ:AAPL) articles, you will know I have been charting the skeleton of an extremely bullish wave structure. Until the Jackson Hole speech that was.
The rhetoric of the speech outlined the severity of the economic situation and although the overall market was trying to find bullish traction, its demise ultimately came minutes after the speech.
Although Apple is technically still lingering in what can be perceived as a bullish setup, both new product releases along with economic bad news have seen it sink slowly but surely towards the lower echelons of its perceived wave one, leaving this tech giant gasping for air as it desperately tries to cling to anything resembling a bullish third wave.
In this article, we will cover any recent Apple news along with how the equity is fairing technically as we look for future bullish and bearish cases and technical targets.
Following September’s new product releases which saw the iPhone 14 along with Apple Watch and Tablet range updates, according to CNBC, Apple is partnering with Goldman Sachs (GS) as the company looks to combine the iPhone with banking and easy pay along with credit capabilities and Apple Pay offering a credit card facility towards the end of 2022. Here is the link to this week’s announcement.
Shifting back to the technical side of things, we will now start evaluating Apple’s bullish and bearish possibilities should this current structure not hold up.
Below in the monthly chart, we can see the $129-$176 wave one with the wave two now retracing past the Fibonacci 23% and into the Fibonacci 11% at $134. Normally, a wave two retrace this far into the wave one would signify little demand to carry price towards the higher realms of the wave one forming the breakout third wave, but as with any financial market, you never know until you get technical confirmation. Initially, the wave two looked to spring off the higher Fibonacci numbers around the 61% retrace area before news simply deteriorated the appetite for demand as we watch it spiral towards support at $129. However, if price does decide to hold above major support, Apple is technically still residing in a bullish structure with a breakout target of $222 should a move above $176 be achieved and the wave three then replicate the wave one.
Apple monthly (C Trader)
They say failing to plan is planning to fail, so now, we will form a possible technical plan should Apple break support and look to the weekly chart to provide guidance of a next stop in this scenario.
Below we can see the bearish weekly structure highlighted by the Green Fibonacci with the large Yellow dotted lines signifying the bearish waves within the monthly structure. The premier focus here is that if Apple does break below $129, we must look for a number for its immediate next stop and also a number it can look to start to recreate a bullish pattern from as, if support is broken, Apple must create a fresh wave one and two on the monthly chart from a new low.
Apple weekly (C Trader)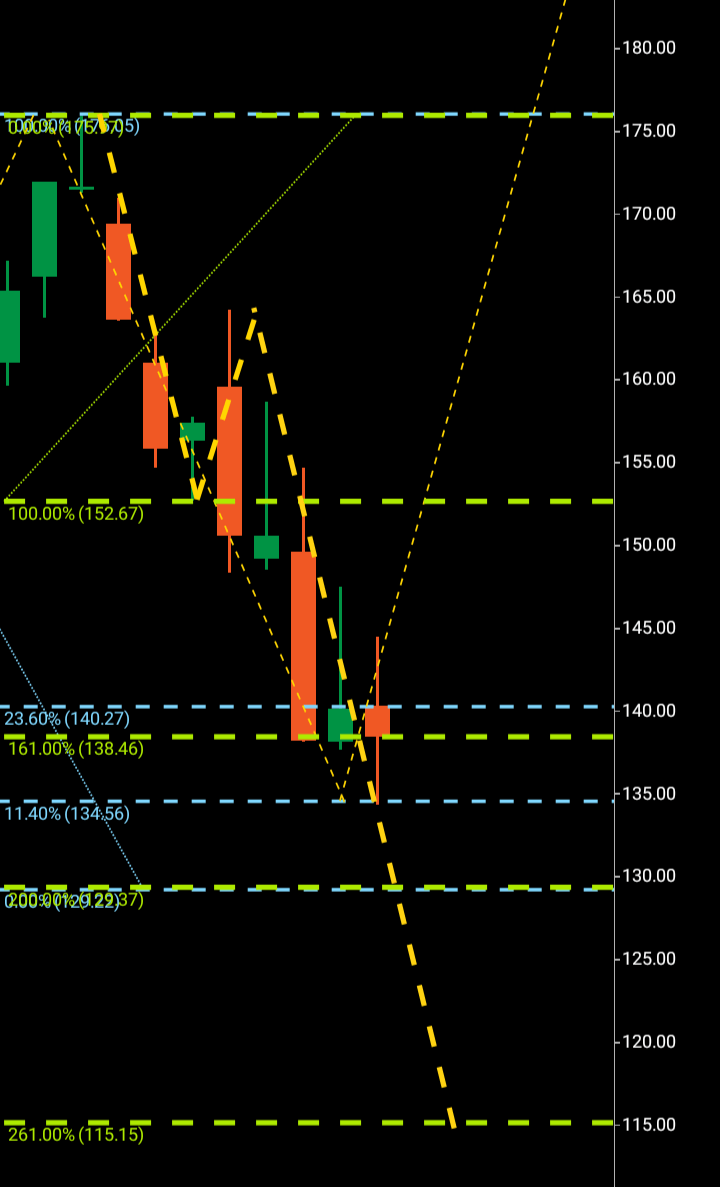
$176-$152 signals a wave one with $152-$165 the wave two. Bearish targets of the Fibonacci 161 have already been achieved with coincidentally, $129 major support a numerical copy of the wave one.
Should Apple reach $129 and not turn around the Fibonacci 261 of $115, we must look at it as the next technical target. Until the equity makes its technical choice, I have selected hold, although if it is going to break support, I would expect it to do so within the next 30-60 days.
About the Three Wave Theory
The three wave theory was designed to be able to identify exact probable price action of a financial instrument. A financial market cannot navigate its way significantly higher or lower without making waves. Waves are essentially a mismatch between buyers and sellers and print a picture of a probable direction and target for a financial instrument. When waves one and two have been formed, it is the point of higher high/lower low that gives the technical indication of the future direction. A wave one will continue from a low to a high point before it finds significant enough rejection to then form the wave two. When a third wave breaks into a higher high/lower low, the only probable numerical target bearing available on a financial chart is the equivalent of the wave one low to high point. It is highly probable that the wave three will look to numerically replicate wave one before it makes its future directional decision. It may continue past its third wave target but it is only the wave one evidence that a price was able to continue before rejection that is available to look to as a probable target for a third wave.
Be the first to comment