


Albina Gavrilovic/iStock via Getty Images
The name of this ETF, WisdomTree U.S. Quality Dividend Growth Fund (NASDAQ:DGRW), suggests that you are getting quality dividend stocks that have strong growth characteristics. But when you look under the hood of this fund, you will find that this is just a clever marketing tactic and what you see is not what you get.
Before I get into why this fund is mislabeled, I want to highlight what exactly this fund proposes to do.
The Multi-factor Approach
Dividend stocks are ranked based on three factors:
- Estimated earnings growth
- Return on equity
- Return on assets
50 percent of the combined ranking score is based on future expected earnings growth. The remaining 50 percent of the ranking score is based on profitability ratios. These ratios measure the company’s ability to generate profit based on its assets and shareholder equity. I am assuming that this is what they are classifying as the ‘quality’ factors.
My ‘Sort Of’ Problem With Quality Factors
The problem with the quality factors is that the term is ambiguous. The opinions on what makes a quality stock vary greatly. It can be anything from low debt to high margins to low variation of earnings between quarters to something completely else like comparing accrual-based profits to actual cash flows.
I would argue that profitability ratios are not the same as quality ratios, but I don’t want to go down this particular rabbit hole because the term ‘quality’ is so vague. Let’s just say that a tech company which needs few tangible assets will have a high ‘return on asset’ ratio, but this doesn’t mean (at least to me) that the company is of high quality.
Are The Factors Predictive?
I like that they take a multi-factor approach instead of relying on a single factor such as dividend yield. But do the factors they choose have any predictive power on future returns? That is to say, is their method any better than having monkeys throwing darts at a board? I will let the factor backtest speak for itself.
A factor backtest is a simple approach where you can test your hypothesis of whether picking stocks based on certain factors leads to higher performance. What you would like to see is that stocks with higher exposure to a certain factor or set of factors has higher returns.
In this test, I examine all dividend paying stocks in the Russell 3000 universe since 1999. I have created a 3 factor ranking system which has been constructed very similarly to theirs. Every year, I put all dividend paying stocks into one of ten portfolios.
The result since 1999?
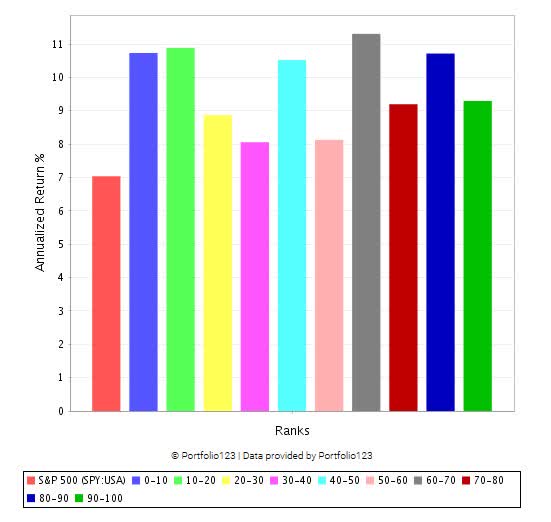
portfolio123.com
- The first red bar shows the annual return of the S&P 500 since 1999. 7.0%
- The next blue bar shows the annual return of the lowest ranked dividend stocks. 10.7%
- The final green bar shows the annual return of the highest ranked dividend stocks. 9.3%
There is no discernable link between the annual return of these dividend stocks and the ranks based on these growth and quality factors. This is my first red flag for the fund.
Removing Risk
Anytime you can get more return for less risk – that is a good thing – right? DGRW has certain rules baked into their dividend universe which are meant to lower investor risk. How do they measure stocks which are risky? There seems to be three potential components.
- Low quality
- Low risk-adjusted returns, which is referred to as momentum in the prospectus (e.g. Sharpe ratio)
- High dividend yield
Stocks which have a very low combined quality and momentum store are excluded. We will call this the ‘risk score’. But they also exclude stocks within the top 5% dividend yield of the universe (that’s the top 1/20th of the index and not 5% actual dividend yield) if it has a below average ‘risk score’.
While this may indirectly remove some high yield traps and stocks with crumbling fundamentals, it also removes a good portion of value stocks with good fundamentals. Stocks with strong yields have a good chance of being excluded. Therefore, this dividend strategy is actually tilting away from higher-yielding dividend stocks. This, in part, explains why the dividend yield of the fund is so low.
While I am all for removing risk, I don’t like the way in which they did it. To my way of thinking, removing stocks with very high price volatility or high short interest or high sales volatility between quarters or even high volatility of dividend payments would make more sense. I give them a thumbs up for effort and a thumbs down on execution.
Weighting Scheme – My Biggest Beef of All
Probably my biggest beef is how this fund is weighted. On the screening side of things, they allow smaller stocks with $100,000 of daily dollar volume and $100 million in market cap to be included. You would think that this allows for a wide range of sizes from small to mega in the fund. Furthermore, because of the growth and quality screening process you would rightfully expect that these factors would be the dominant forces driving the fund. I mean… it’s in the name. But you would be wrong. Notice the weighting scheme. I will pull this next bit directly from the prospectus.
The Domestic Dividend Indexes are modified capitalization-weighted Indexes that employ a transparent weighting formula to magnify the effect that dividends play in the total return of the Indexes. The initial weight of a component in the Index at the annual reconstitution is equal to the dollar value of the company’s cash dividends to be paid in the coming year based on the company’s indicated annual dividend per share. To calculate the weighting factor – Cash Dividends to be paid – indicated annual dividend per share is multiplied by common shares outstanding. Thus, each component’s weight in the Index at the “U.S. Weighting Date” (defined below) reflects its share of the total Dividend Stream projected to be paid in the coming year by all of the component companies in the Index.
What does this mean? Does the dividend weighting mean that the fund is tilting towards yield? One might expect this to be a logical response after they went out of their way to tilt away from higher yielding stocks that they viewed as riskier. We should be left with a group of lower yielding companies that have higher quality and higher growth prospects with lower risk.
But no. The weighting scheme is putting more weight on stocks with more total dividends. You read that correctly… total dividends. Not dividend to price. Just the total dividend amount. Consider what this means…
- Stock A has a dividend yield of 10%. It is a small company of $100 million market cap. The total dividend to be paid is $10 million.
- Stock B has a dividend yield of 0.1%. They are a large company of $100 billion in market cap. The total dividend to be paid is $100 million.
Based on total dividends, you are going to have 10x the exposure to stock B than to stock A. This is true even though stock A has a dividend yield of 10% versus 0.1% of stock B.
It doesn’t really matter what other screening and filtering you do. Based on the weighting scheme, the most important factor that influences returns is the size factor.
Bottom line of the weighting scheme? You will likely get something incredibly similar to the S&P 500 the majority of the time, even though the S&P 500 is market cap weighted and this is dividend weighted. Let’s look at a chart to compare since DGRW’s inception.
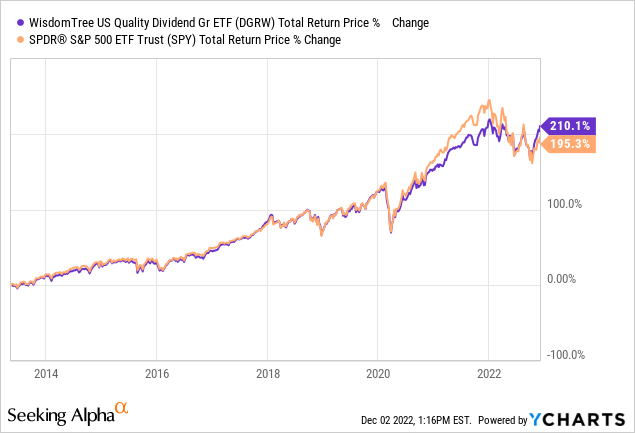
Notice how it trades very similarly to the S&P 500 during normal markets. During the pandemic crash, this portfolio did little to protect investors from the downside. Any risk-reduction measures were drowned out by the size factor. But in the market bounce between 2020 and 2022 this dividend ETF missed out on roughly 20% of the upside move. Since 2022 it hasn’t crashed as heavily. That is easily explained by the average return of any dividend paying stock in the S&P 500 index.
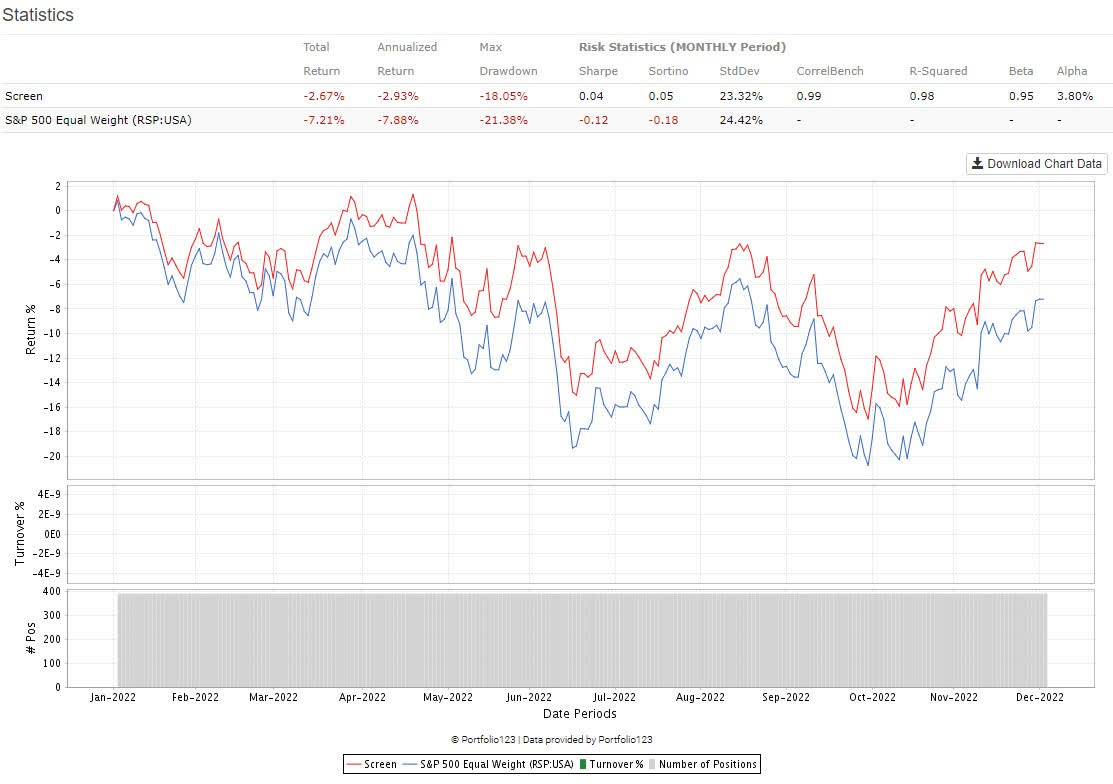
portfolio123.com
- The red line is the equal-weight return of all dividend paying stocks in the S&P 500 since 2022.
- The blue line is the equal-weight return of the S&P 500.
What we see is that the average return of any stock with a dividend has out-performed the broad market so far this year.
All this means is that this fund’s recent ballast against the broad market decline of 2022 is not due to their quality and growth factors. Any dividend fund would have similar exposure to this.
Digging Deeper – My Custom Ranking Analysis
Due to their size-based weighting scheme, the top 17 stocks make up 50% of the total fund weighting. Put another way, these 17 stocks are just as important as the remaining 279 stocks.
My job as a consultant for ETFs, hedge funds and family offices is focused on factor-based investing. I design strategies similar in concept to what you would see in a very sophisticated fund. I came up with five categories which were predictive of future dividend stock performance. These categories are value, growth, profitability, margins and quality.
This is a factor backtest on dividend paying stocks in the Russell 3000 index since 1999 using annual rebalancing.
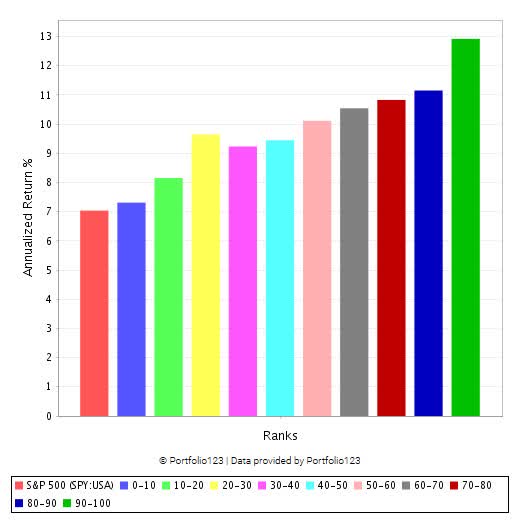
portfolio123.com
This is what you want to see when running a factor backtest. The higher the rank, the higher the return. Otherwise, what’s the point?
As a side note, my research highlights that the most important factors which drive dividend stock performance is value. With this particular ranking system (the one mentioned above using value, growth, profitability, margins and quality), I encourage investors to only purchase stocks which have a rank of at least 90 out of 100.
If you had followed this simple approach in this particular universe of stocks (Russell 3000 with dividends) you would have a long-term historical total return of 12.7% since 1999 versus 7% return in the S&P 500.
When I analyze the top 17 stocks in DGRW, I find a range of ranks between 44 and 84 with an average rank of 68. Of the almost 300 companies included in this fund, there are only 24 that I would recommend holding which have a rank of 90 or greater. And that’s only the beginning…but that’s for a future article.
Final Analysis of DGRW
If you are looking for a large-cap fund that holds dividend paying companies and little else, I see no reason to hold back buying DGRW. The expense ratio is fair. But if you want exposure to factors that actually drive the returns of dividend stocks or you even want meaningful exposure to growth and quality factors, I would look elsewhere.
Be the first to comment