

Diego Thomazini
Written by Nick Ackerman, co-produced by Stanford Chemist. This article was originally published to members of the CEF/ETF Income Laboratory on August 21st, 2022.
After covering MFS Special Value (MFV) recently, a reader mentioned MFS Charter Income Trust (NYSE:MCR). This is another MFS fund that appears to be quite interesting. Most of the portfolio is invested in high-yield and emerging market debt. That really isn’t the more interesting part, though.
They also have a sizeable short position against various positions. From the latest look, it was mostly through being short future contracts of U.S. Treasuries. That’s essentially a hedge against higher interest rates. As rates rise, that would mean the price of the Treasuries would fall. Thus, the value of these short futures contracts would rise. When you are short, you want the price of the security to go lower. On the other hand, they are also long a fair bit of U.S. Treasuries too.
Over the years, it has provided some additional advantages but rather minimal. Since the short and long positions are essentially positioned to cancel each other out, it isn’t too surprising.
On the other hand, the fund’s discount is fairly attractive, being only a bit above its longer-term average. The fact that everything has sold off lately could present a longer-term opportunity. However, we have made up quite a bit of ground considering where we have been. If we are in a bear market rally, we might get some further opportunities before too long.
The fund has a managed 8% distribution plan, so it will always be a relatively higher-yielding fund. This plan also provides some predictability in the level of the payout.
The Basics
- 1-Year Z-score: -0.45
- Discount: -5.22%
- Distribution Yield: 8.26%
- Expense Ratio: 0.71%
- Leverage: 24.15%
- Managed Assets: $414.124 million
- Structure: Perpetual
MCR’s investment objective is to seek “high current income, but may also consider capital appreciation.”
To achieve this objective, the fund will “invest the fund’s assets primarily in debt instruments.” They continue with “normally invests the fund’s assets in corporate bonds of U.S. and/or foreign issuers, U.S. Government securities, foreign government securities, mortgage-backed securities and other securitized instruments of U.S. and/or foreign issuers, and/or debt instruments of issuers located in emerging market countries.” The fund may “invest up to 100% of the fund’s assets in below investment grade quality debt instruments.
Essentially, I’d say this fund is a multi-sector bond fund. They are pretty much free to invest wherever they want, in whatever amount they want. They mention that they are also free to use derivatives. The futures contracts would be an example that we mentioned at the opening of this article.
One thing that caught my attention with this fund was the expense ratio. The fund is significantly larger than MFV that we looked at last time. However, it also includes leverage and, even including that, has an expense ratio of just 0.97%. That’s according to their last semi-annual report. This is incredibly low for a leveraged fund.
Being that it is a leveraged fund, we also have the risks to consider that leverage brings. Not only does it make the fund relatively more volatile, but interest rates rising will impact the fund. This risk will also be offset through their various derivative contracts, such as the interest rate swaps they utilize.
That being said, we can see that in 2019, they reported an expense ratio that climbed to 1.40%. That’s certainly higher than now but is still quite low for the CEF space. The higher interest rate comes because their borrowings are based on LIBOR or “at the option of the borrower an alternative base rate plus an agreed upon spread.” The last report showed that the average annual interest rate was 0.89%.
That’s quite low, and being rather minimally leveraged in the fixed-income CEF space can point to some of the reasons their expense ratio is so low.
Performance – Some Downside Protection, But Not Impressive Upside
Given that the fund has a fairly large weighting to U.S. Treasuries through most periods and emerging market debt, I didn’t anticipate tremendous historical returns. I’d say they are mostly what I expected.
MCR Annualized Returns (MFS Investments)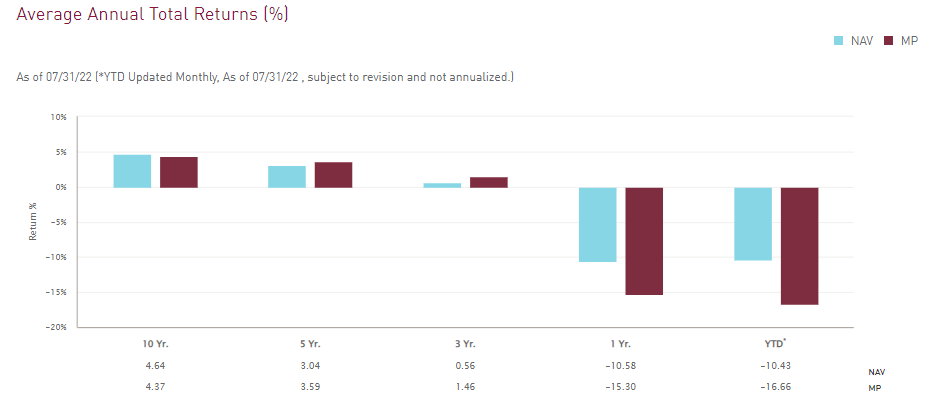
We can see that YTD the results have been rather poor despite their hedging, too. Again, this hedging, from what I saw, is largely offset by the long positions.
I have included the performance below between various other fixed income instruments to highlight this further. That includes iShares iBoxx $ High Yield Corporate Bond ETF (HYG). This is a straightforward high-yield fund. I also included Vanguard Total Bond Market ETF (BND) to represent investment-grade bond exposure for further context.
I also included the BlackRock Corporate High Yield Fund (HYT), a high-yield CEF to give us a leveraged peer. MCR is also heavily invested in below-investment-grade positions, so it isn’t too far off.
YCharts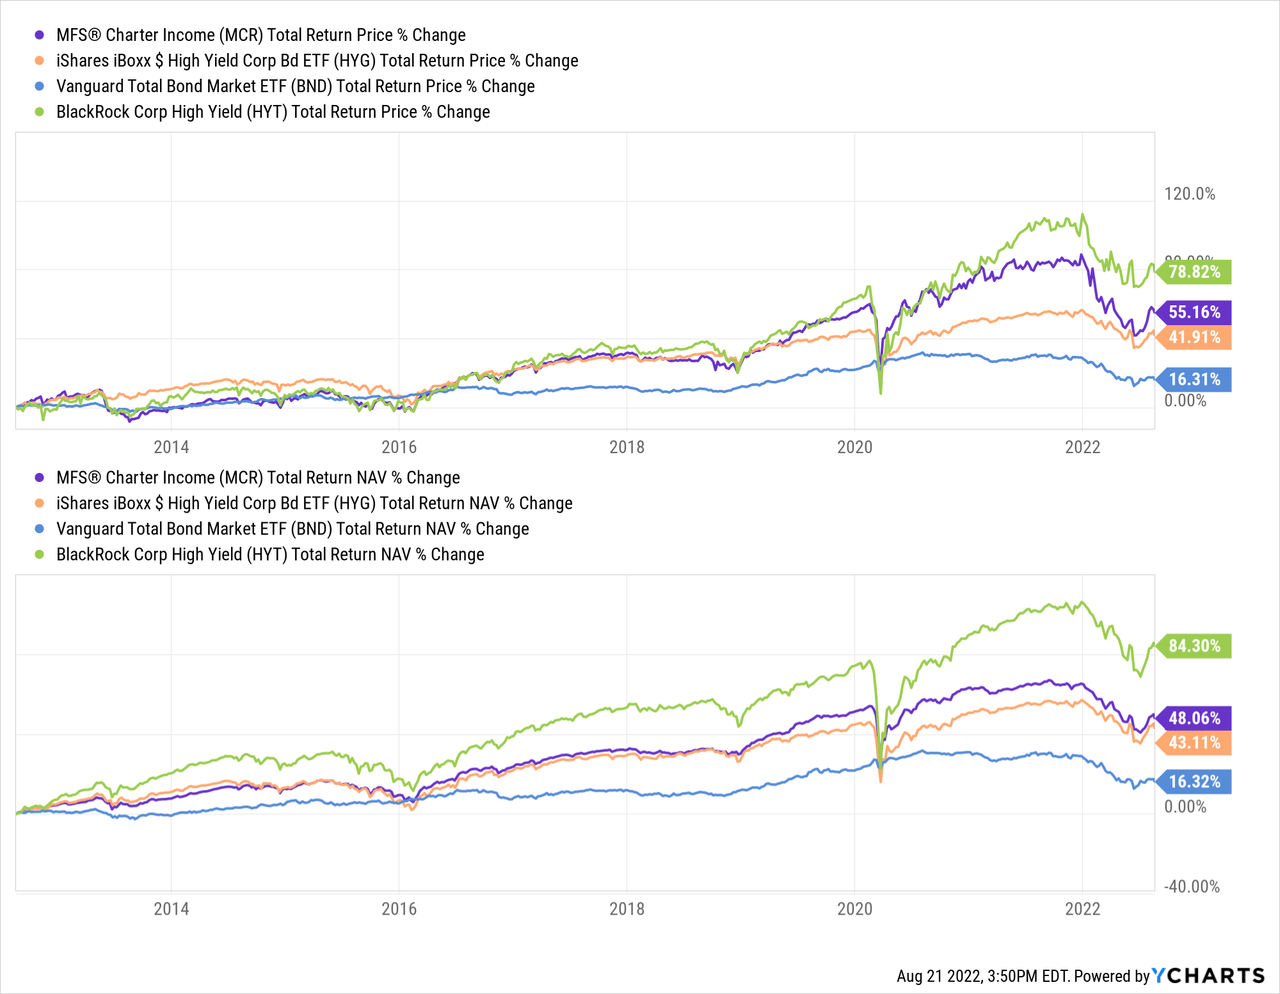
The fund has outperformed both HYG and BND, which is a bit expected as things have been going relatively smoothly. Therefore, the leverage in MCR should have been paying off. What might be more interesting, though, is comparing against HYT.
Since HYT is also leveraged but invested almost entirely in high-yield investments, we should expect the fund to outperform. I’d say that it outperformed more than I would have anticipated, though.
We are getting unleveraged high yield-like returns, but the portfolio has quite a bit more moving parts.
That being said, the fund’s strategy appears to have helped more meaningfully during the COVID crash. That’s the period from February 19th, 2020, to March 23rd, 2020. MCR held up significantly better than HYT and even HYG. It had underperformed massively (and quite expectedly) compared to BND.
YCharts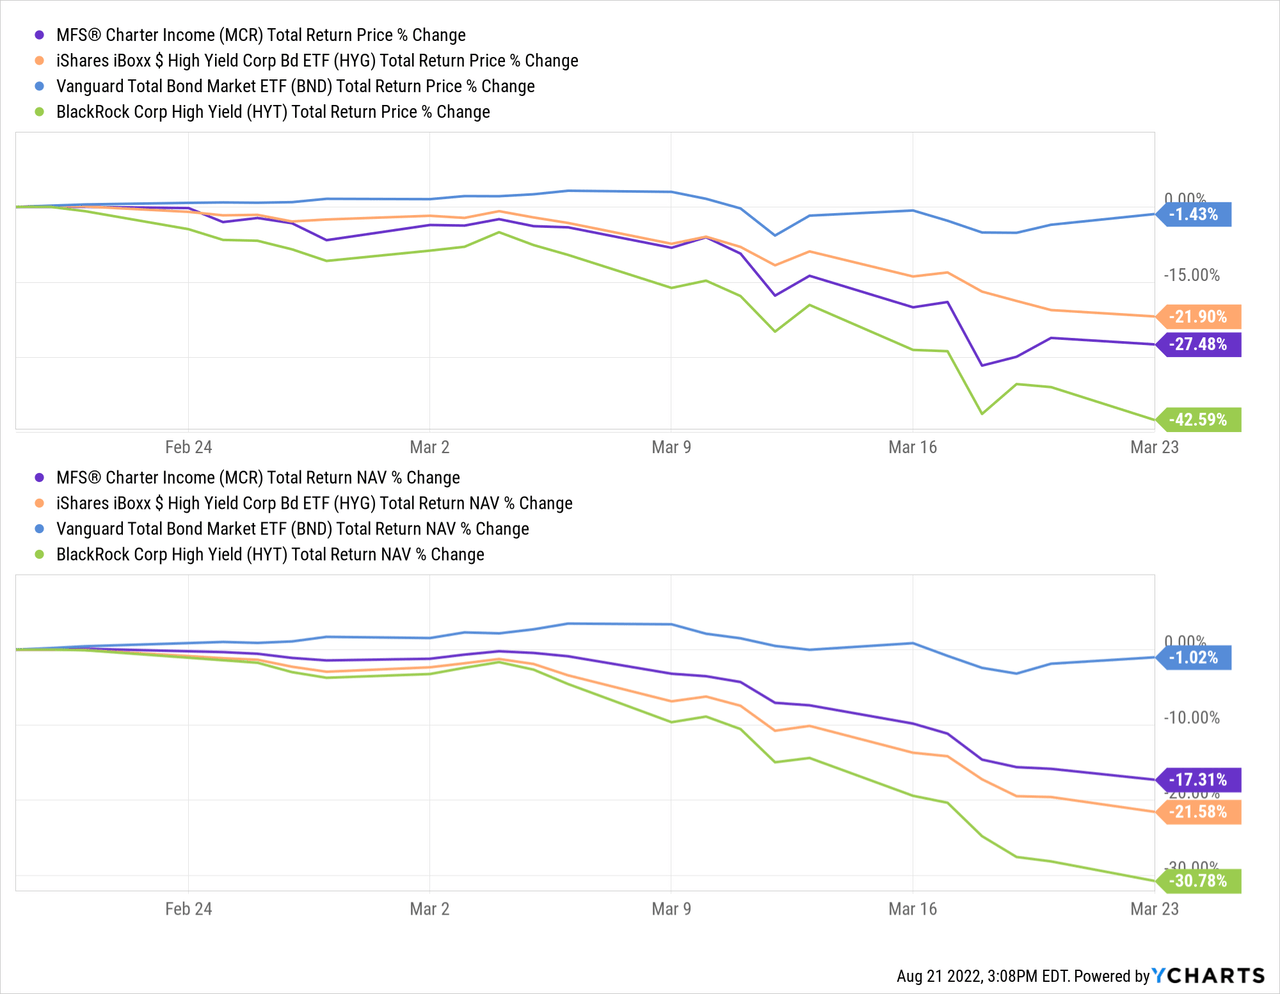
At the end of the day, this is an income investment. Comparing to HYG or BND might not be appropriate. However, I would have expected results on the upside to be still a bit more compelling. At least a bit closer to HYT’s results over the last several years.
Making this a bit more of a compelling case is the fund’s valuation. In that case, we can see that it shows MCR isn’t too richly valued. It is only minimally overvalued based on its average over the last decade. That’s also considering that the value of its underlying bonds is lower now. Fixed-income has sold off this year due to the higher rates. Not only that, but the high yield bonds have also had increased credit risk due to a Fed that wants to slow the economy to keep inflation tame.
YCharts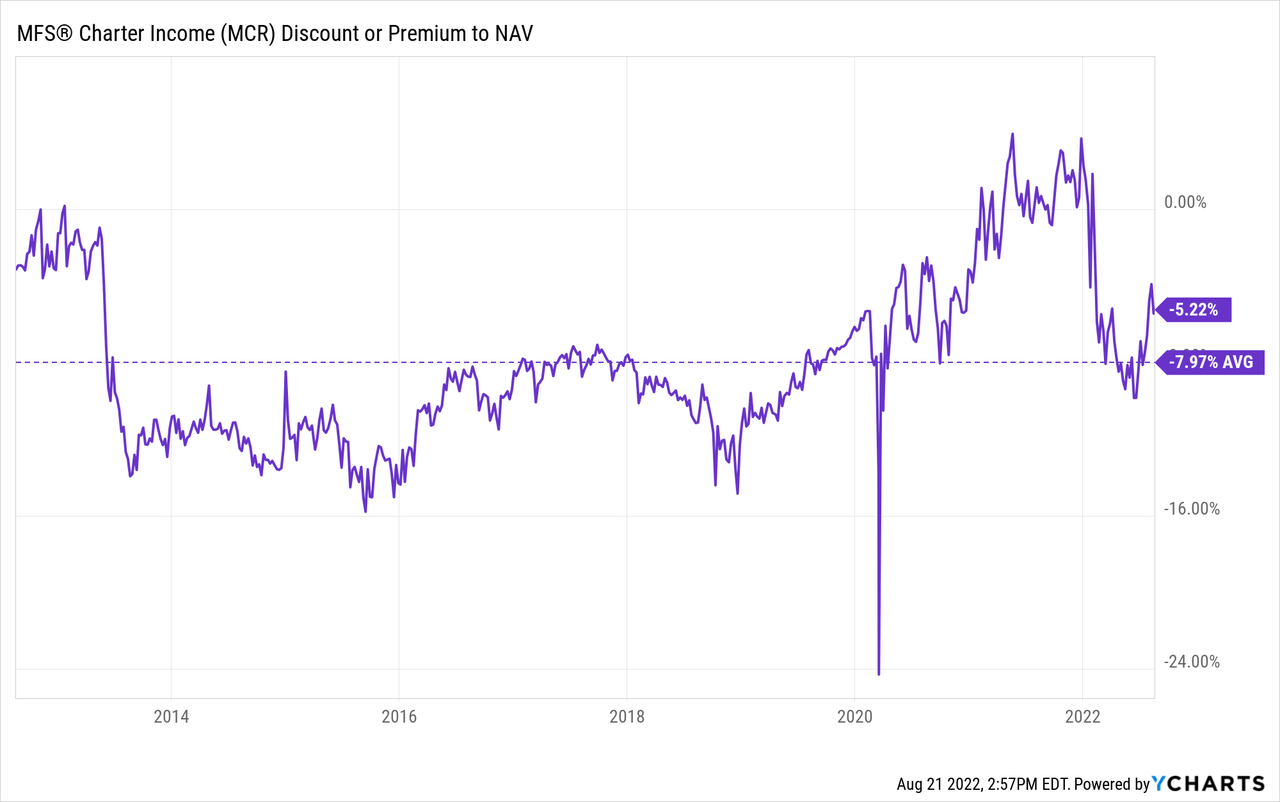
Distribution – Managed 8% Plan
MCR has a managed distribution plan that is a bit similar to MFV. However, instead of a 10% policy, it is an 8% policy. It is reset and calculated every month. So while it varies every month, it is still predictable because investors know it’ll be 8% of the previous average monthly NAV.
If the fund appreciates, the payout will be higher. If the fund is depreciating, we know the payout will be heading lower. Given the trajectory of the fund lately – and basically all investments besides energy – we can see that the distribution has been heading lower quite rapidly.
MCR Distribution History (MFS Investments)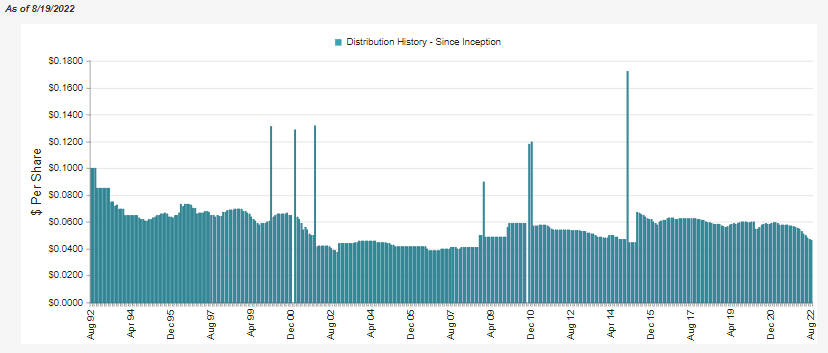
The fund must rely on its prowess to generate capital gains to cover the distribution. That’s because, at this time, they don’t seem to be able to produce 8% in net investment income on their portfolio.
MCR Semi-Annual Report (MFS Investments)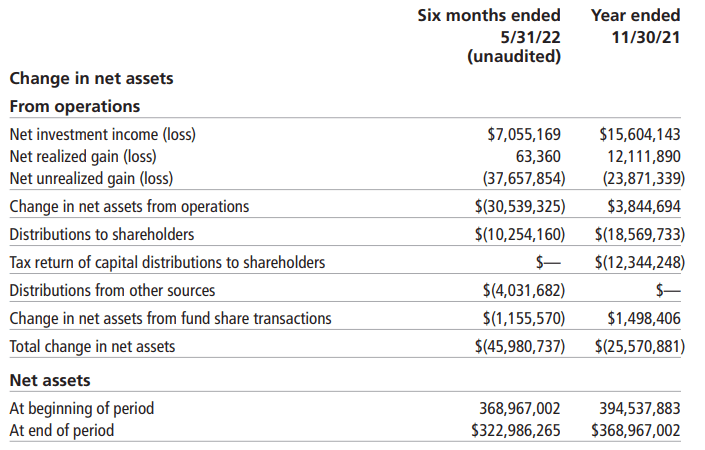
NII coverage came to around 69%. The remainder would have been needed to come from gains in the portfolio. The fund’s NII generated with the last report was 4.06%. That’s actually been fairly consistent over the last several years. NII percentage in 2021 was 4.06%, 4.20% in 2020 and 4.11% in 2019. Even with leverage on top of this, we can see that the yields wouldn’t cover an 8% managed plan at this time.
Going back to that sizeable allocation of U.S. Treasuries, a fairly large portion of their portfolio generated a low yield. So it isn’t too surprising their income generation isn’t higher. Using HYT for context again, they had last reported in 2021 an NII ratio of 6.30%. That’s with their 1.35% total expense ratio too.
For tax purposes, we can see that return of capital has been a fairly large component of the distribution. That was even in 2021 when the fund generated enough NII and realized gains. That’s where capital loss carryforwards can come into play for funds. It can mean that a fund earns its distribution even while ROC is present. Just one more reason why we can’t look at ROC and automatically assume it’s always bad.
MCR Annual Report (MFS Investments)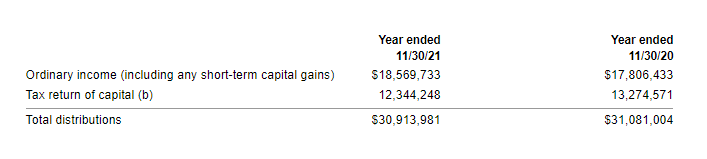
MCR’s Portfolio
Here is what I was looking more at when mentioning that the portfolio essentially offsets itself with its hedges and long positions. The latest semi-annual report was for the period ending May 31st, 2022. We can see that the value of these positions had appreciated at that time.
MCR Semi-Annual Report (MFS Investments)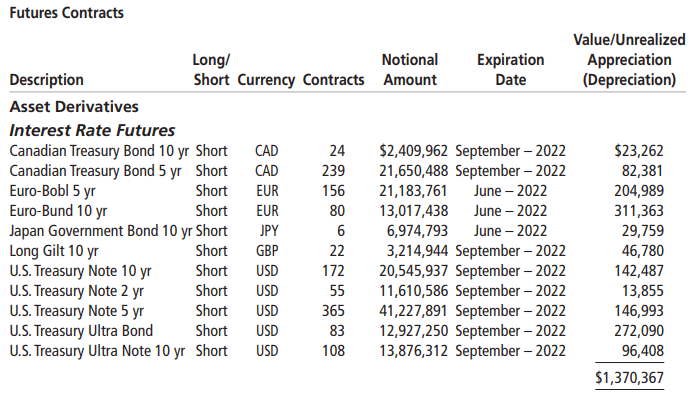
That being said, it appears it hasn’t paid off to a greater degree overall because they are still simultaneously carrying meaningful long positions in U.S. Treasuries. The fund has performed rather poorly YTD, reinforcing the poor performance.
I can only think of setting up the portfolio this way to potentially capitalize on higher rates now with the futures contracts. You can realize the capital gains if they pay off. Then, you still hold the long Treasury positions that would still be defensive. Here’s what, U.S. Treasuries were long at the same time.
MCR Semi-Annual Report (MFS Investments)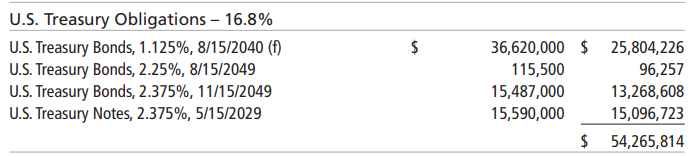
This is mirrored by the credit quality that is more recently reported. The bulk of the portfolio is weighted to BB and B exposure. That would be representing the below-investment-grade weightings.
MCR Credit Quality (MFS Investments)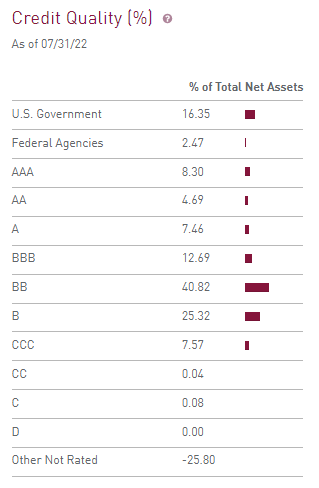
At the same time, they were still short a sizeable allocation of U.S. Treasuries and non-U.S. Sovereigns at the end of July too.
MFS Portfolio Structure (MFS Investments)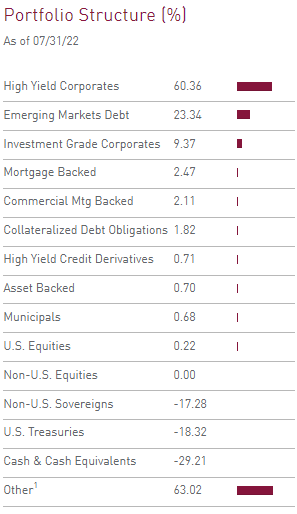
I looked back at several previous reports, and it shows that they always have a number of short positions in play on various government-issued debts. However, it also shows that they sometimes have long futures contracts too. This was both in 2015 and 2019, just as examples.
Those long futures contracts are in addition to the long positions in U.S. Treasury investments – which also have varied in weighting over time. So it does appear to be somewhat of a tactical choice in the weightings against each other.
The fund’s duration is 6.03 years, with the average maturity at 9.13 years. This is a bit higher than what we see from a fund such as HYT at 5.02 years. However, it’s also a bit lower than what we would see from something such as BND at 6.7 years.
MCR Portfolio Statistics (MFS Investments)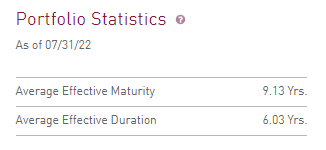
Conclusion
MCR is a rather interesting fund, similar to my takeaway of MFV. While I don’t think I’ll initiate a position, they certainly bring something different to the table for investors.
The managed distribution plan keeps regular and predictable payouts rolling in for investors monthly. The fund seems reasonably valued based on its discount and the overall weakness in the fixed-income space.
Over the long run, the performance hasn’t been too impressive. Though it helped reduce the downside through the COVID crash. The fund has also held up a bit better on a YTD basis. This further suggests that its more unique positioning has at least some impact on its results.
Be the first to comment