

Athitat Shinagowin
A guest post by Ovi
Below are a number of Crude oil plus Condensate (C + C) production charts for Non-OPEC countries created from data provided by the EIA’s International Energy Statistics and updated to May 2022. This is the latest and most detailed world oil production information available. Information from other sources such as OPEC, the STEO, and country-specific sites such as Russia, Brazil, Norway, and China are used to provide a short-term outlook for future output and direction for a few countries and the world. The US report has an expanded view beyond production by adding rig and frac charts.
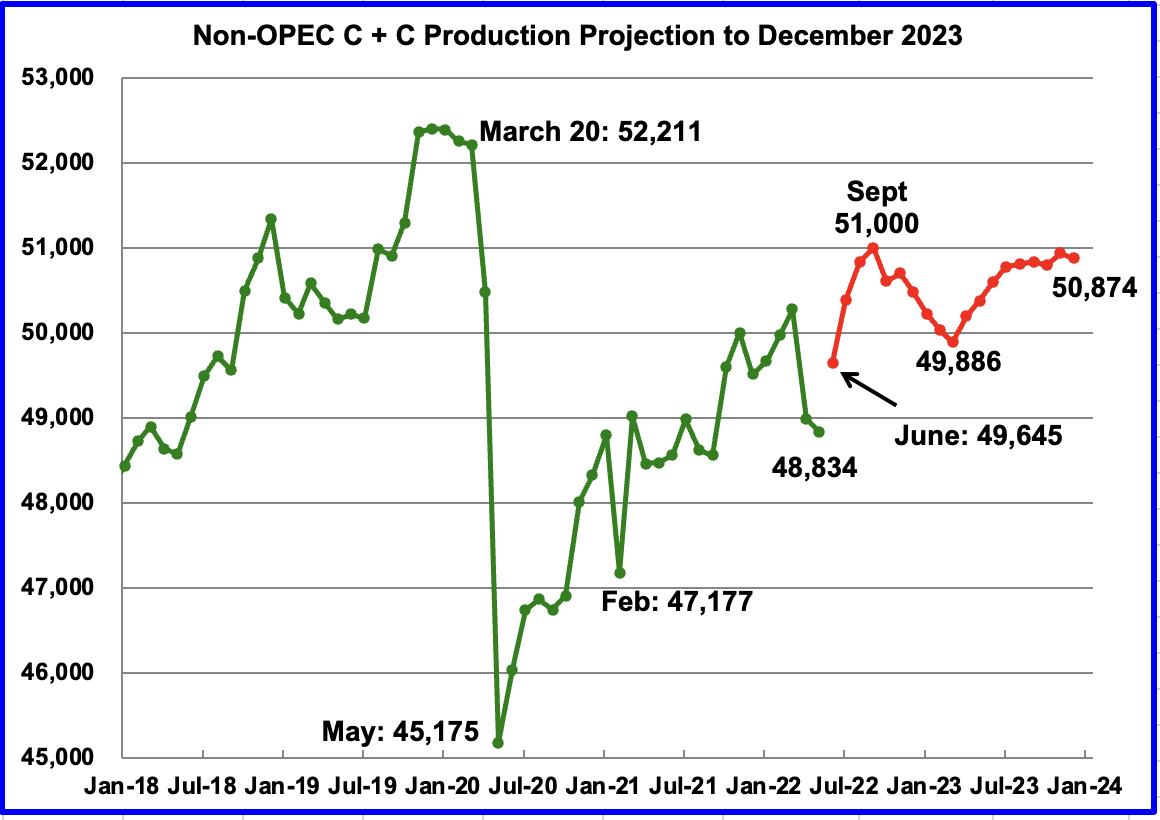
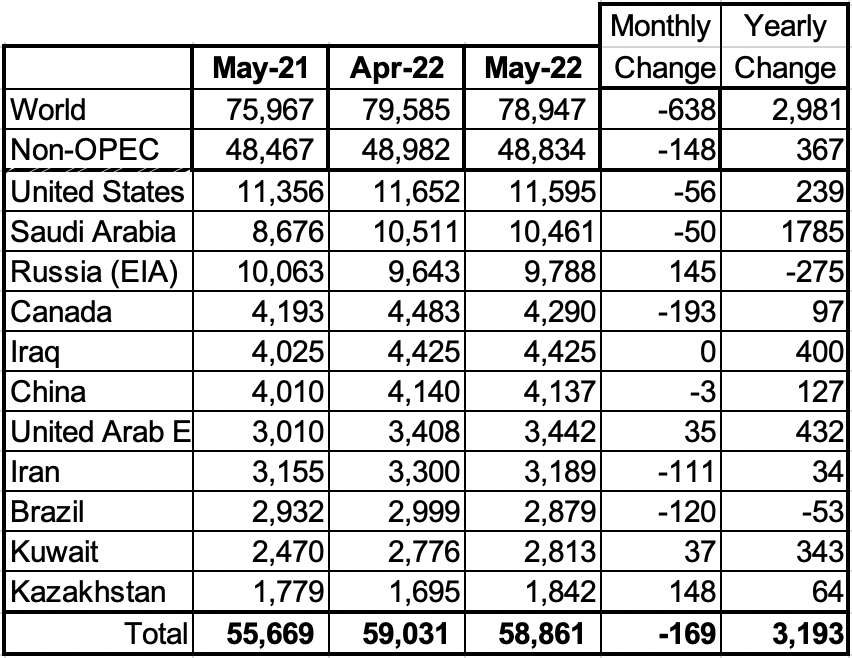
May Non-OPEC production decreased by 148 kb/d to 48,834 kb/d. The biggest decliners were Canada 193 kb/d, Brazil 120 kb/d, US 56 kb/d, and Norway 38 kb/d. The biggest offsetting increases came from Kazakhstan 148 kb/d and Russia 145 kb/d.
The May output of 48,834 kb/d is 3,377 kb/d lower than the March pre-covid rate of 52,211 kb/d.
Using data from the September 2022 STEO, a projection for Non-OPEC oil output was made for the time period June 2022 to December 2023. (Red graph). Output is expected to reach 50,874 kb/d in December 2023. This forecast is 33 kb/d higher than predicted in August. The production rise to 51,000 kb/d by September 2022 is due to projected increases by OPEC + and the U.S. Note that the September 2022 high is the high for all of 2022 and 2023.
Non-OPEC Oil Production Ranked by Country
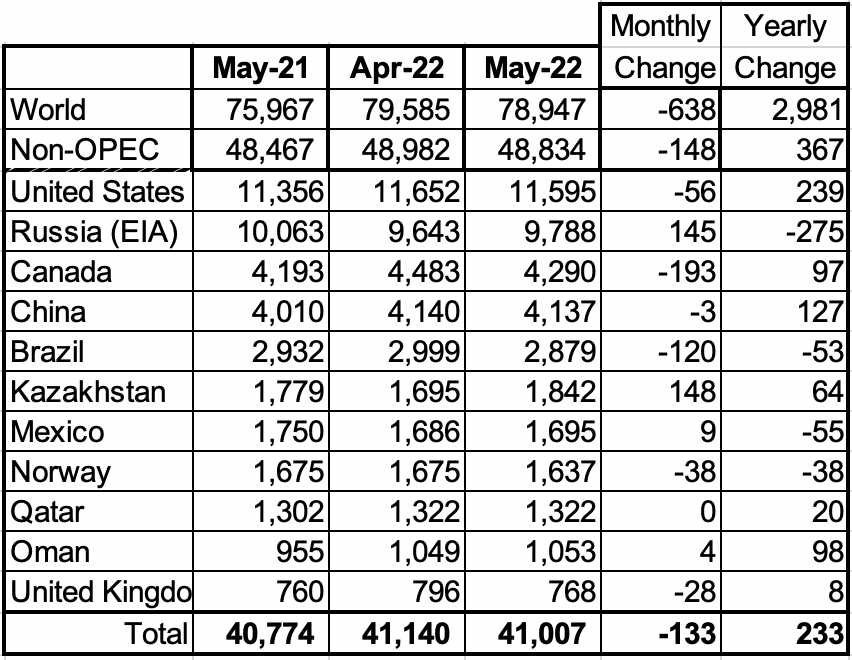
Listed above are the world’s 11th largest Non-OPEC producers. The original criteria for inclusion in the table was that all of the countries produced more than 1,000 kb/d. The UK has been below 1,000 kb/d since January 2021.
Note the Non-OPEC drop of 148 kb/d was much smaller than World decline due to large production drops in Libya, Nigeria, and Iran.
In May 2022, these 11 countries produced 84.0% of the Non-OPEC oil. On a YoY basis, Non-OPEC production increased by 367 kb/d. World YoY May output increased by 2,981 kb/d.
Production by Non-OPEC Countries
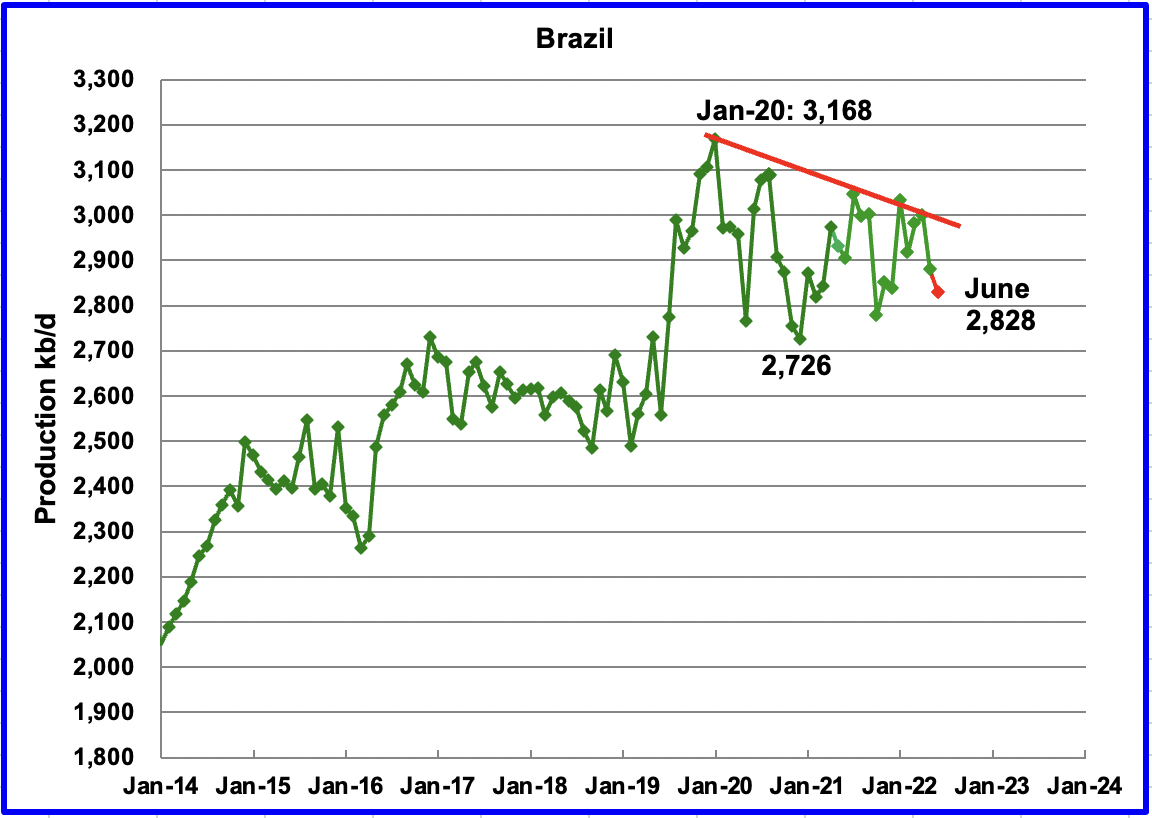
The EIA reported Brazil’s May production decreased by 120 kb/d to 2,879 kb/d.
Brazil’s National Petroleum Association (BNPA) reported that June’s output experienced another drop of 51 kb/d to 2,828 kb/d.
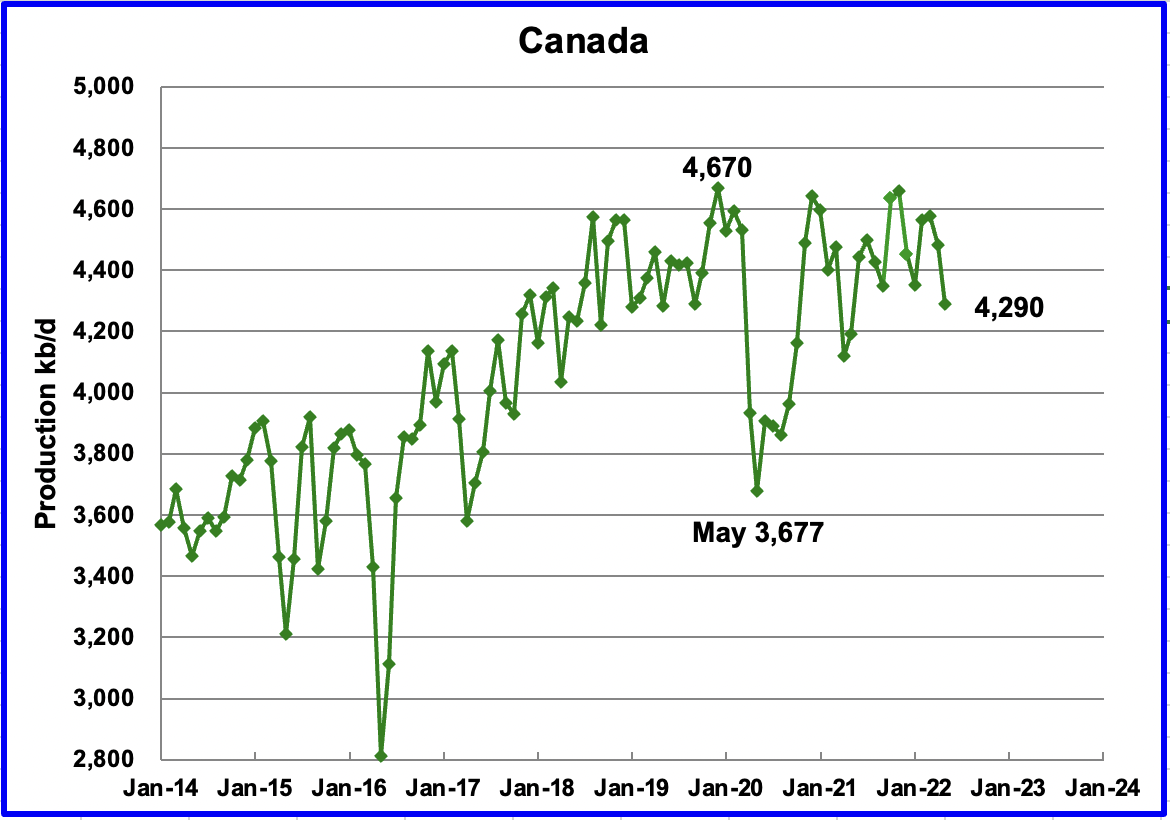
According to the EIA, Canada’s May output decreased by 193 kb/d to 4,290 kb/d. Preliminary data from the Canadian Energy Regulator indicates that synthetic crude production was down again in May.
Rail shipments to the US in May and June were slightly above 170 kb/d, up from 144 kb/d in April.
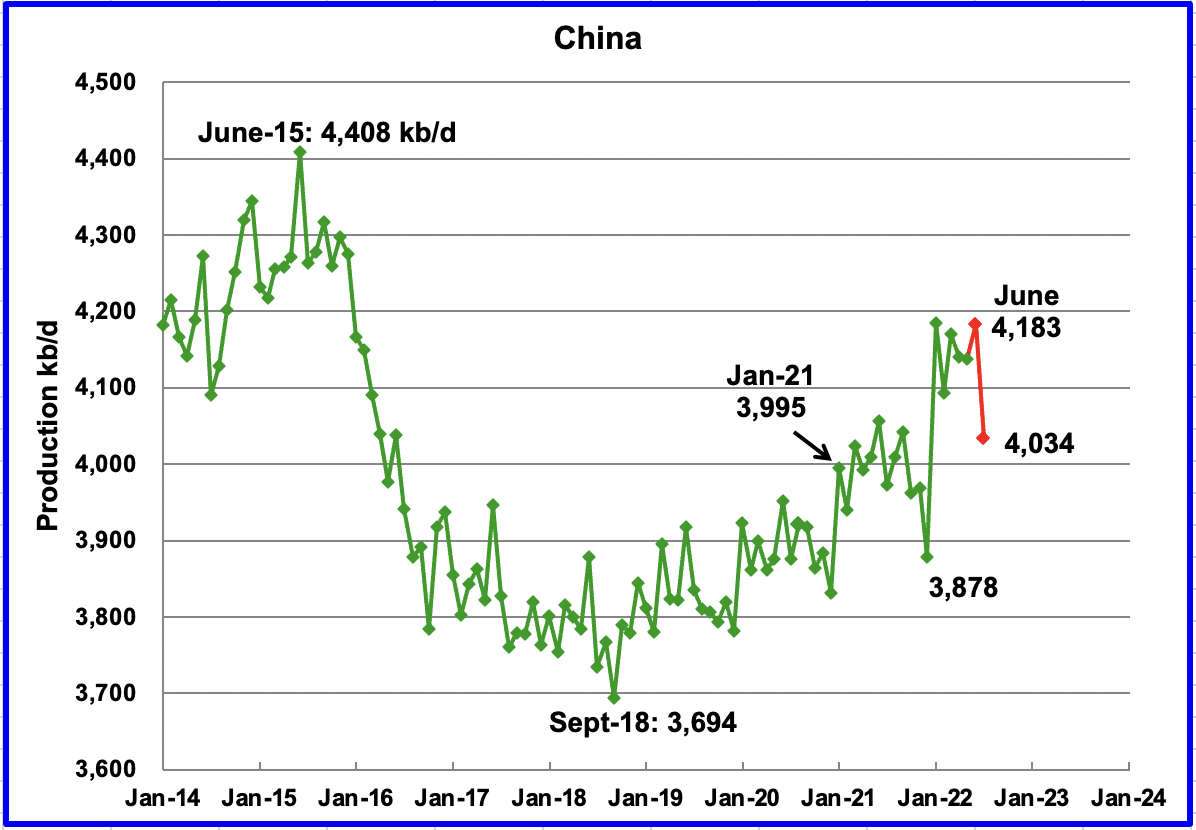
The EIA reported China’s output decreased by 3 kb/d to 4,137 kb/d in May. China reported that its output increased in June to 4,183 kb/d and then dropped to 4,034 kb/d in July. (Red markers).
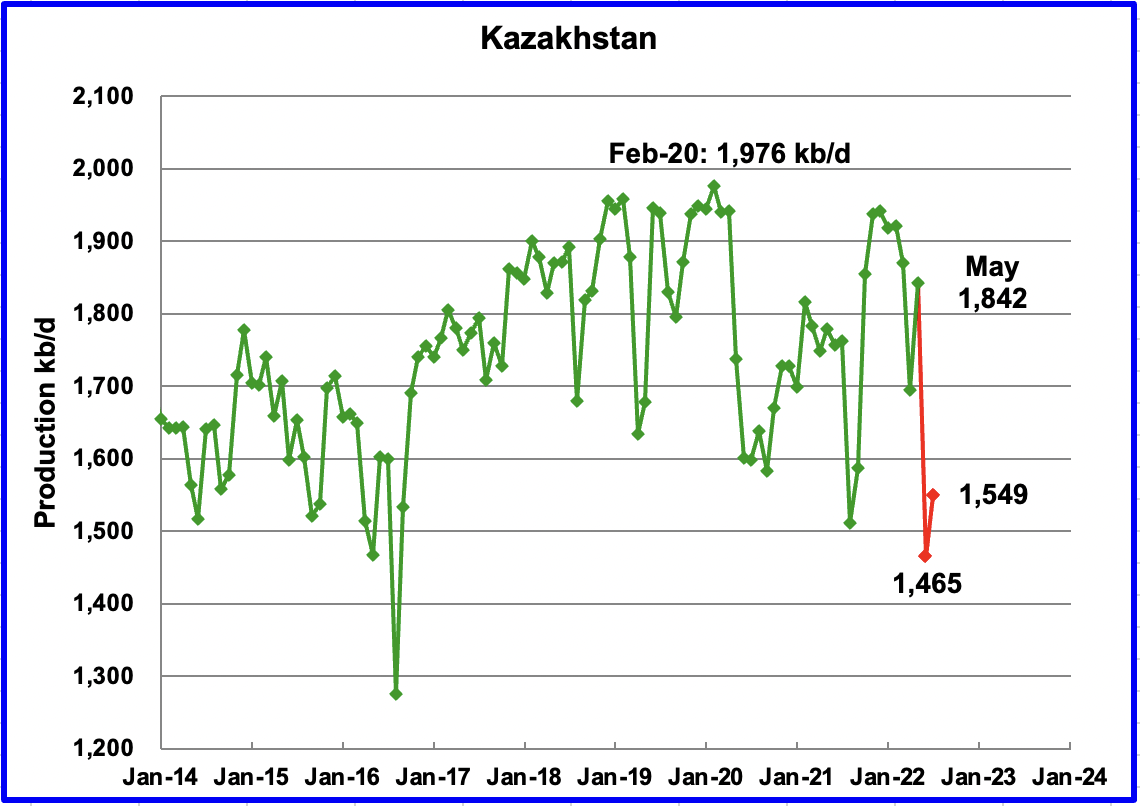
Kazakhstan’s output increased by 148 kb/d in May to 1,842 kb/d. June output was projected to drop due to required repairs at a damaged loading terminal in a Black Sea port in Russia, according to this source. The projected drop was 320 kb/d but actually came in at 377 kb/d. July output rebounded to 1,549 kb/d.
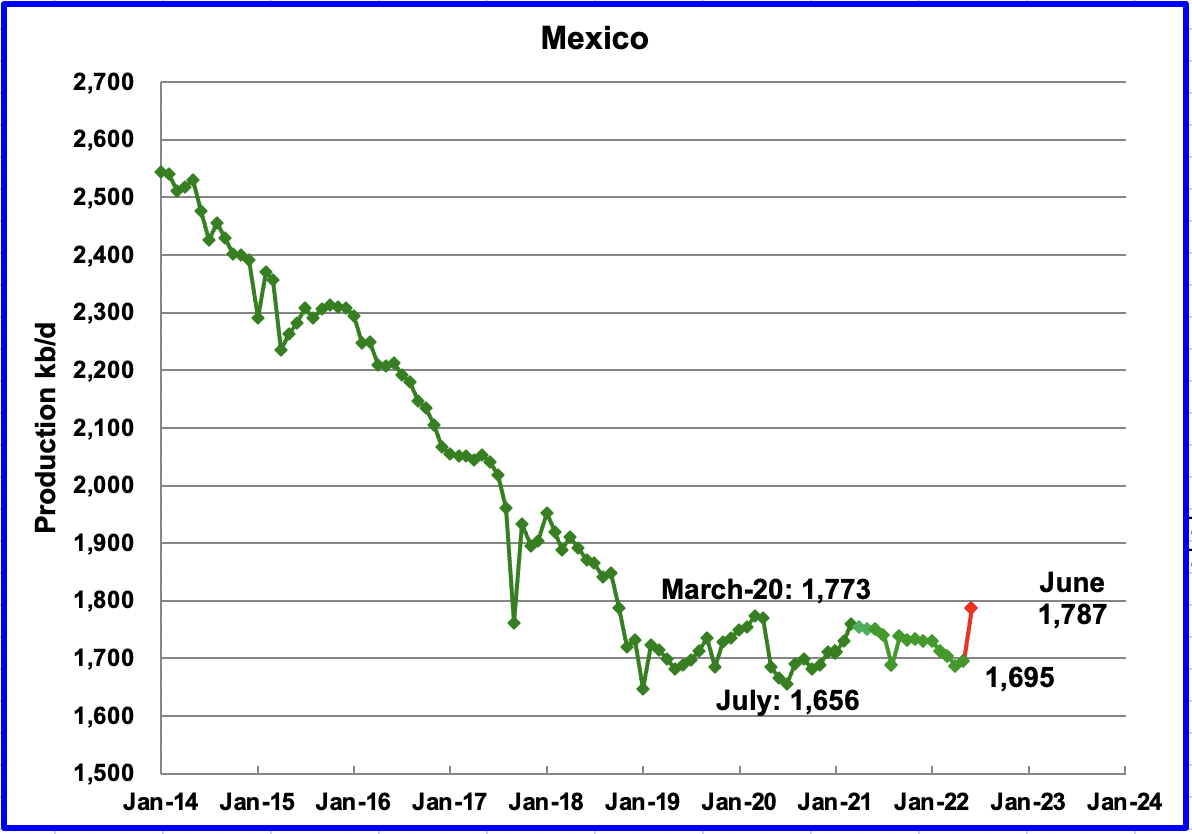
Mexico’s production as reported by the EIA for May increased by 9 kb/d to 1,695 kb/d.
Data from Pemex showed that June’s output was 1,787 kb/d. However, the EIA is expected to reduce Pemex’s June oil production by close to 70 kb/d due to a different definition for crude plus condensate.
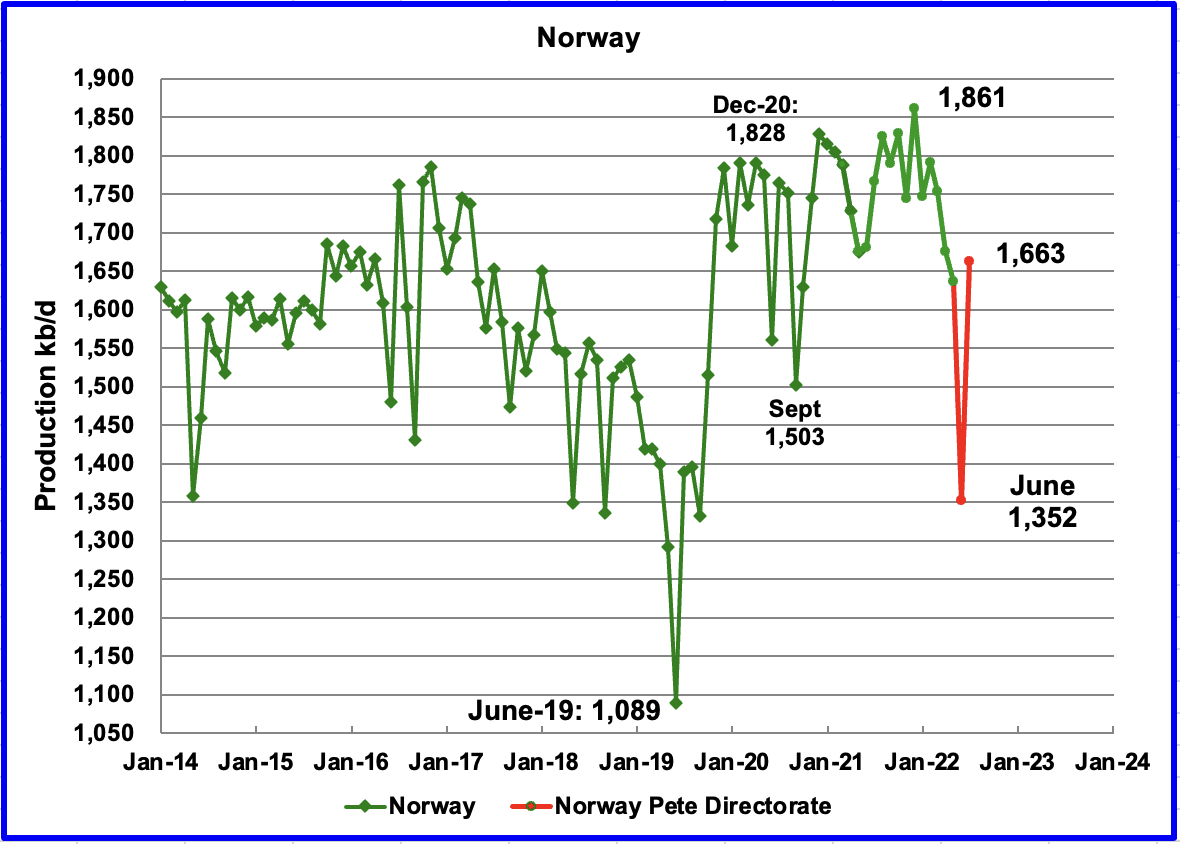
The EIA reported that Norway’s May production decreased by 38 kb/d to 1,637 kb/d.
The Norway Petroleum Directorate (NPD) reported that production decreased from May to June to 1,352 and then rebounded to 1,663 kb/d in July. (Red markers.). According to the NPD: “Oil production in July was 10.9 percent lower than the NPD’s forecast and 5.0 percent lower than the forecast so far this year.”
According to OPEC, the continuing drop was due to summer maintenance in offshore platforms and some operators prioritizing gas production.
Growth is expected in late 2022 and into 2023 when the second phase of the Johan Sverdrup field development starts production and other small fields come online. According to OPEC “The Johan Sverdrup is projected to be the main source of increased output for the year. Neptune has also completed drilling at Fenja with the first oil on track for 1Q23. Fenja is expected to produce about 24 tb/d at peak production.”
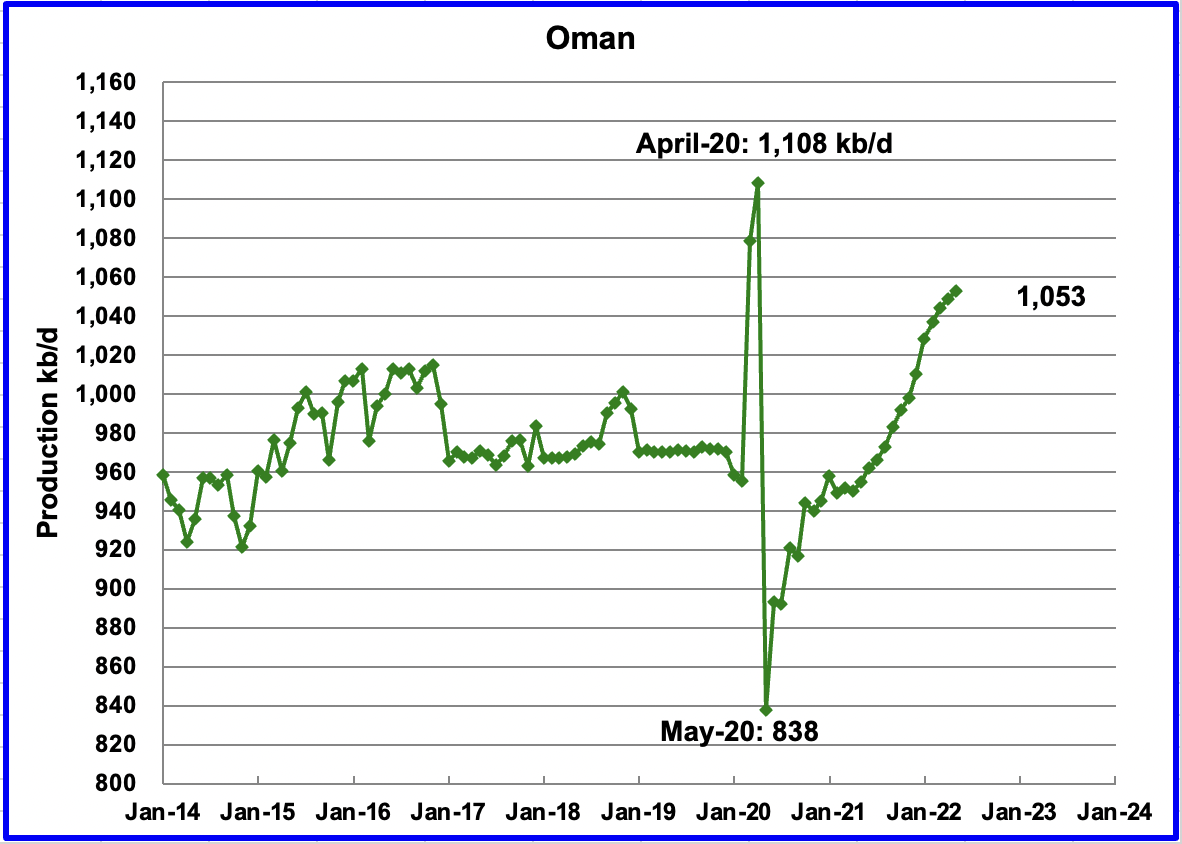
Oman’s May production increased by 4 kb/d to 1,053 kb/d.
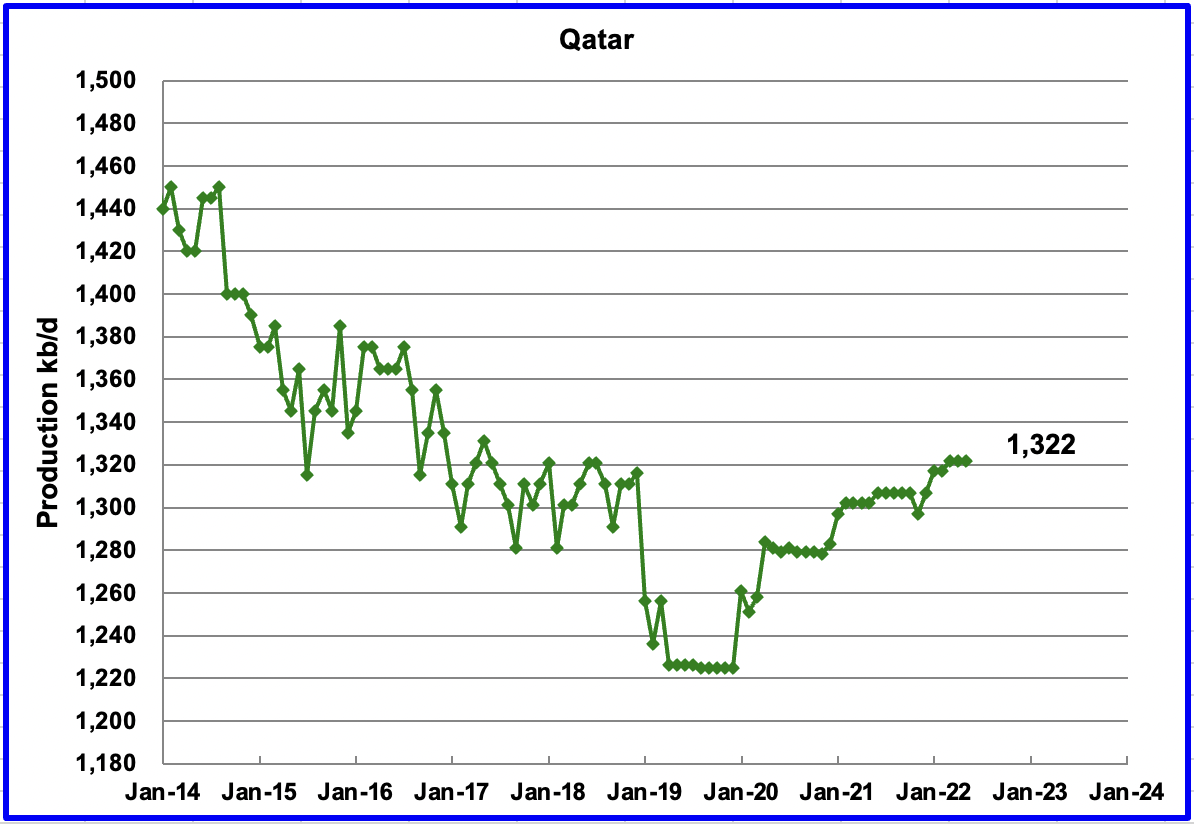
May’s output was unchanged at 1,322 kb/d.
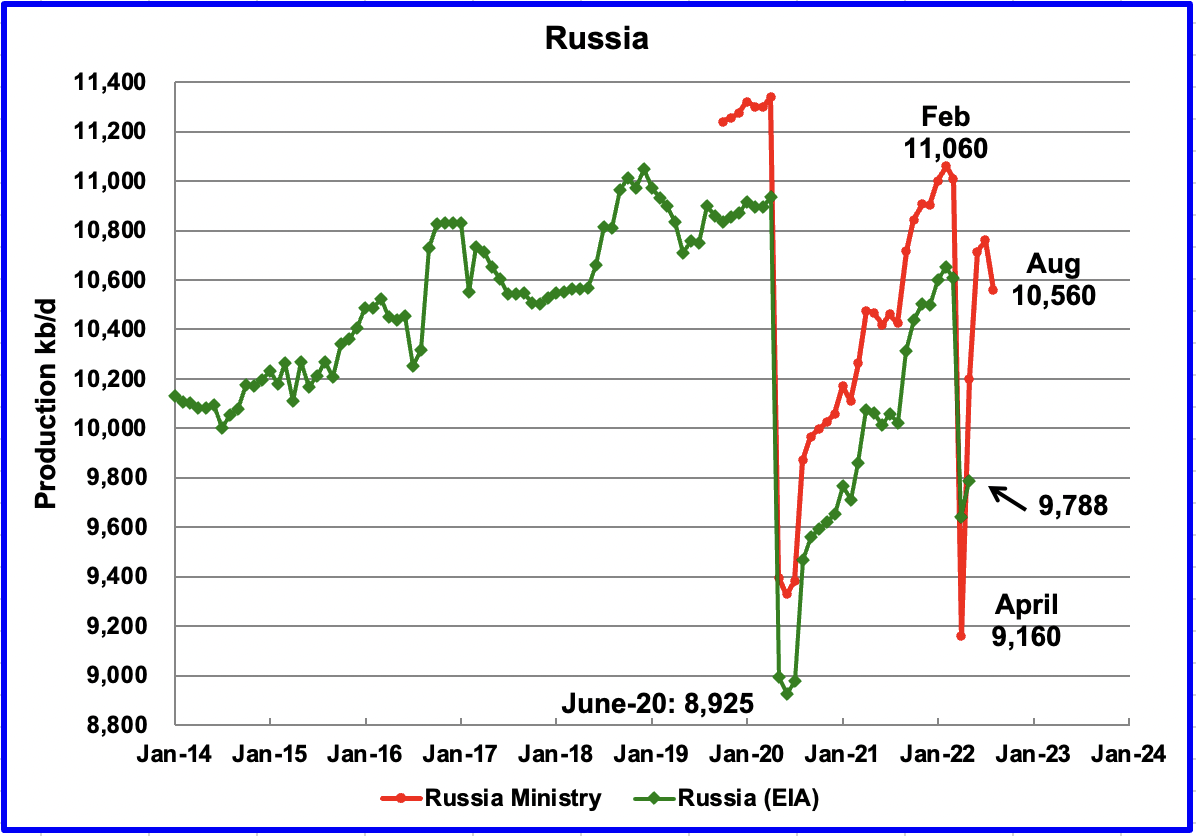
The EIA reported that Russian output increased by 145 kb/d in May to 9,788 kb/d. According to this source, August’s (first 3-week estimate) production decreased by 200 kb/d to 10,560 kb/d.
In the previous post, this source, based on August’s first-week estimate, reported August production decreased by close to 300 kb/d.
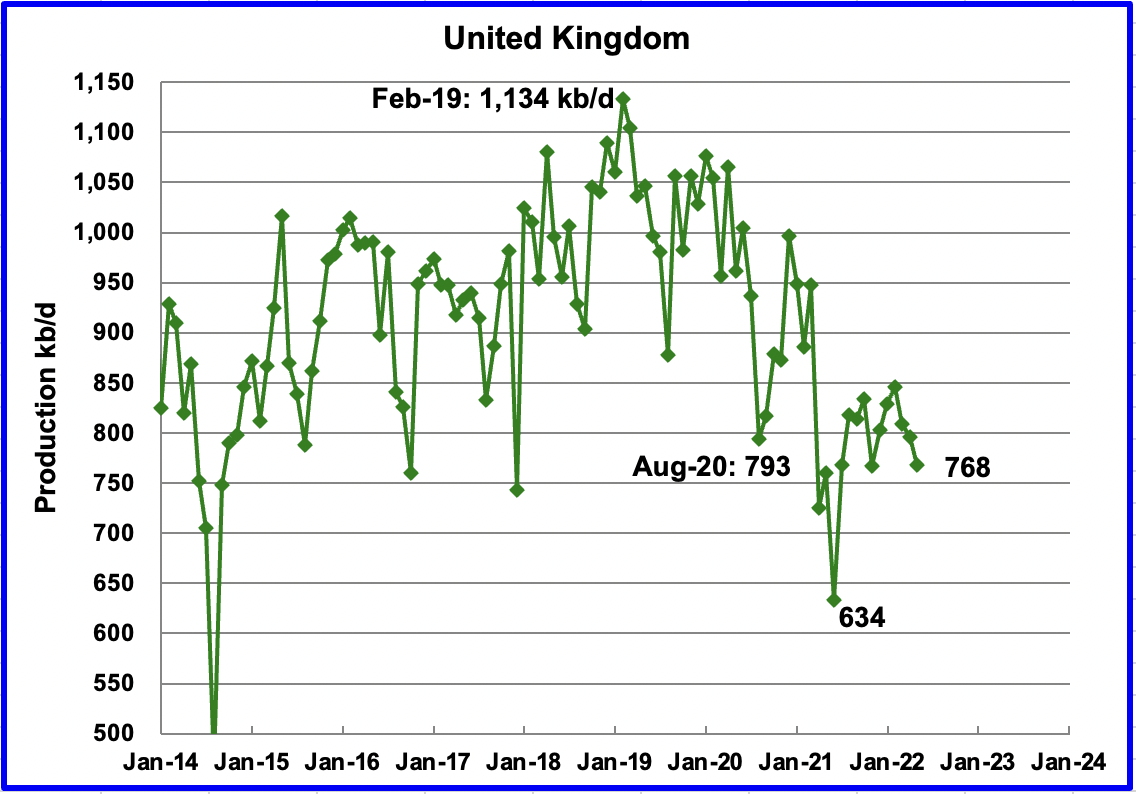
UK’s production decreased by 28 kb/d in May to 768 kb/d. The chart indicates UK oil production entered a steep decline phase starting in February 2019. On a YoY basis production is up 8 kb/d.
June output is expected to be essentially unchanged according to OPEC.
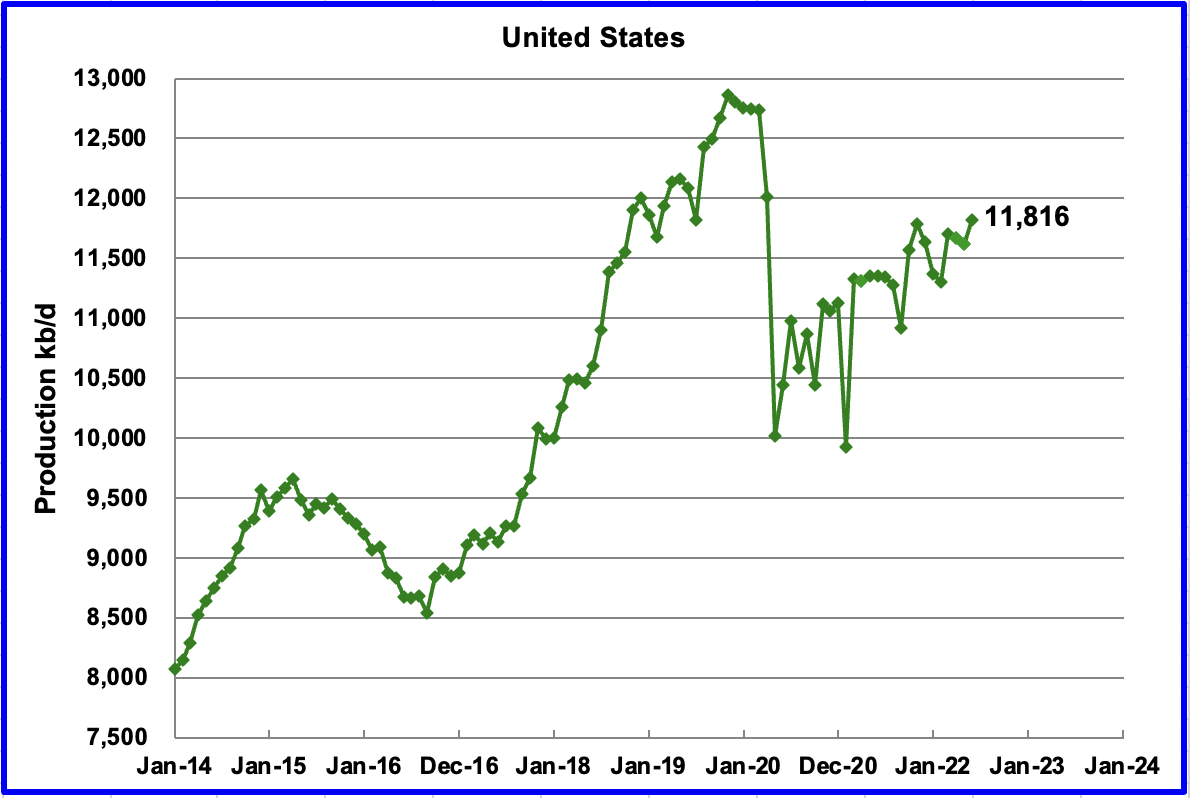
U.S. June production increased by 201 kb/d to 11,816 kb/d. The gain was partly due to production recovery from bad weather in May.
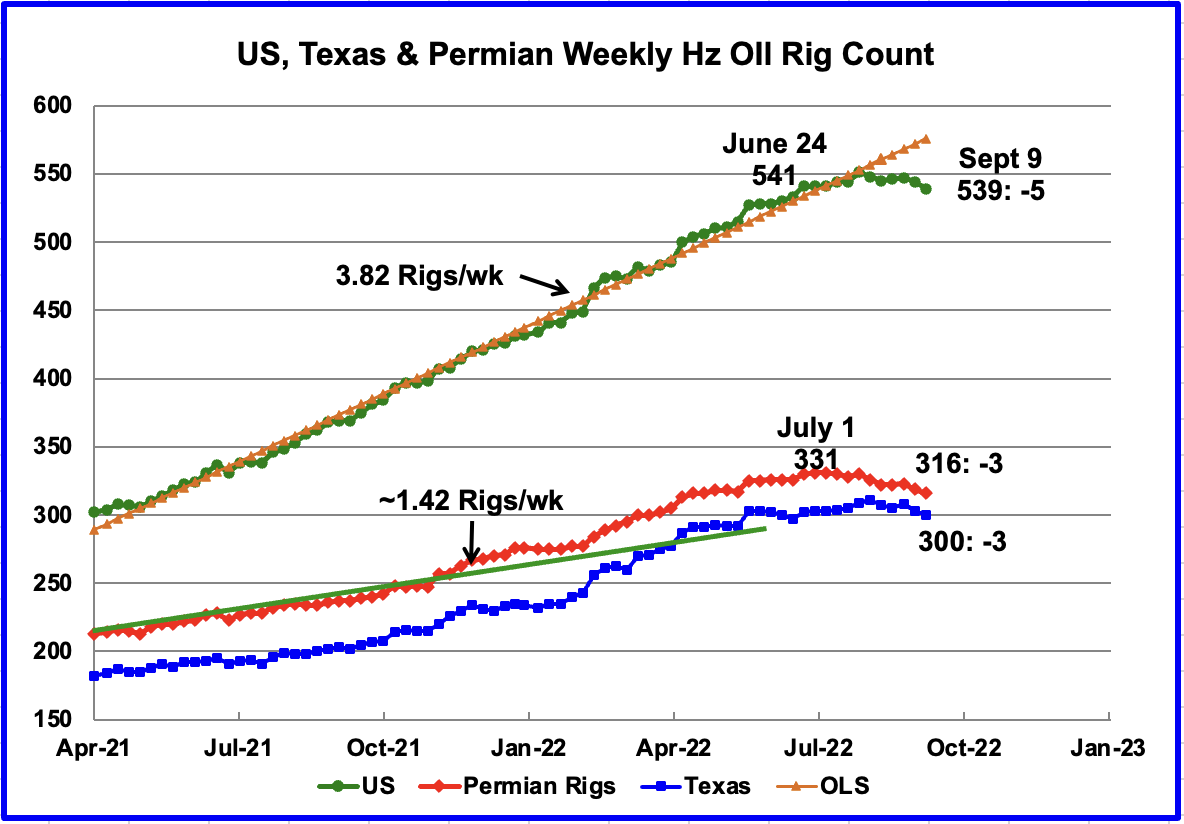
The big rig story continues to be the US Rig count continues to drop across the board. In the week ending September 9, there was a drop of 5 operating rigs in the US. The Permian dropped 3 to 316 and is down 15 rigs from a high of 331 on July 1.
Texas dropped by 3 to 300 and is down 11 rigs from a high of 311 on August 5.
North Dakota is the only state showing a significant increase in the rig count since early July, left column. North Dakota has added 5 rigs since the beginning of July.
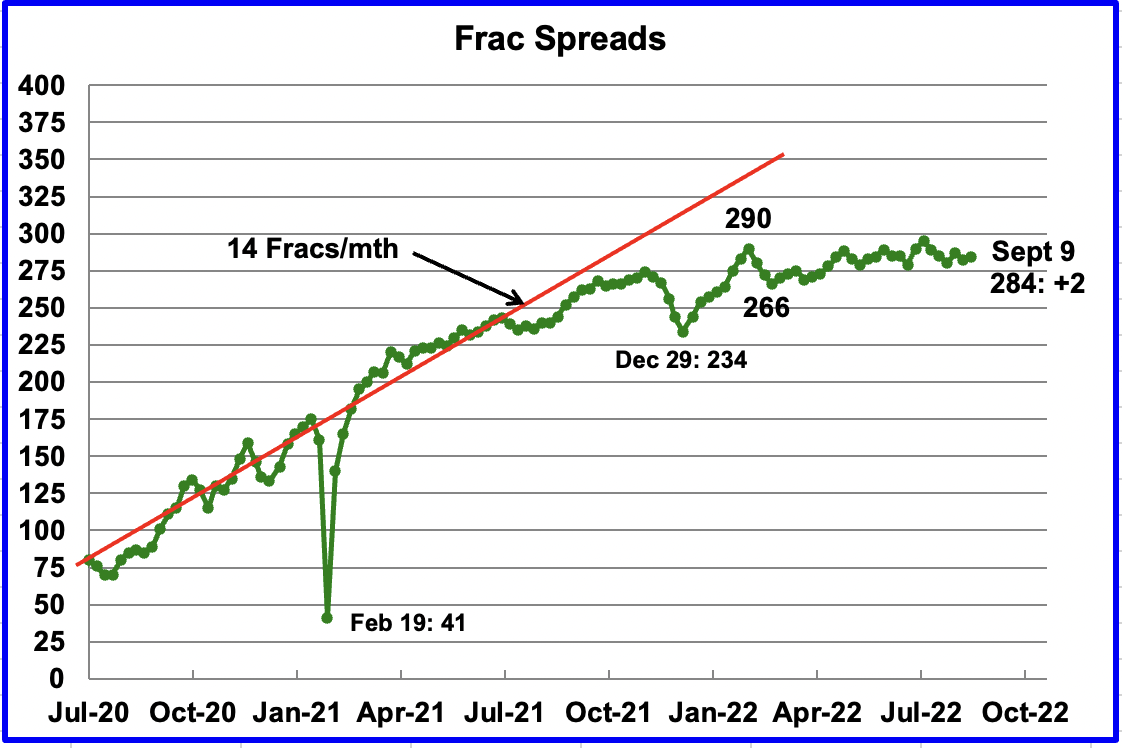
For the past 6 months up to late July, the growth in frac spreads has not been keeping up with the growth in rigs. Since then, Frac spreads have dropped from 295 in the week ending July 29 to 282 in the week ending September 2. Over the same period, the US Hz rig count dropped from 551 to 544. For the week ending September 9, two frac spreads were added for a total of 284 while five rigs were deactivated, down to 539.
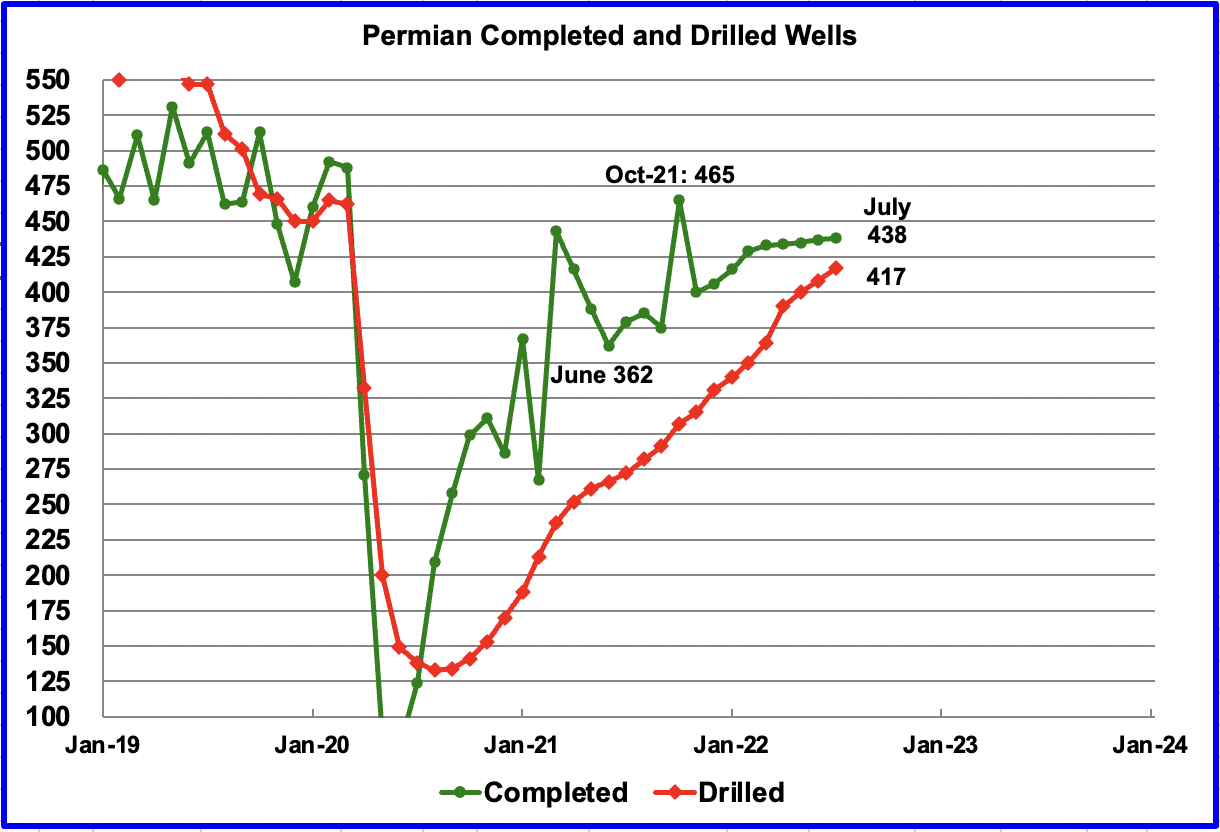
In the Permian, the monthly completion rate of wells has been showing signs of slowing since March. This confirms the lack of growth in the frac spread count shown in the previous chart.
In July, 438 wells were completed, 1 more than in April and 8 more than February. During July, 417 new wells were drilled, an increase of 9 over June. Drilling continues to increase to replace the additional DUCs that were completed. The gap between drilled and completed wells in the Permian has reached a new current low of 21 DUCs and is expected to continue to decrease.
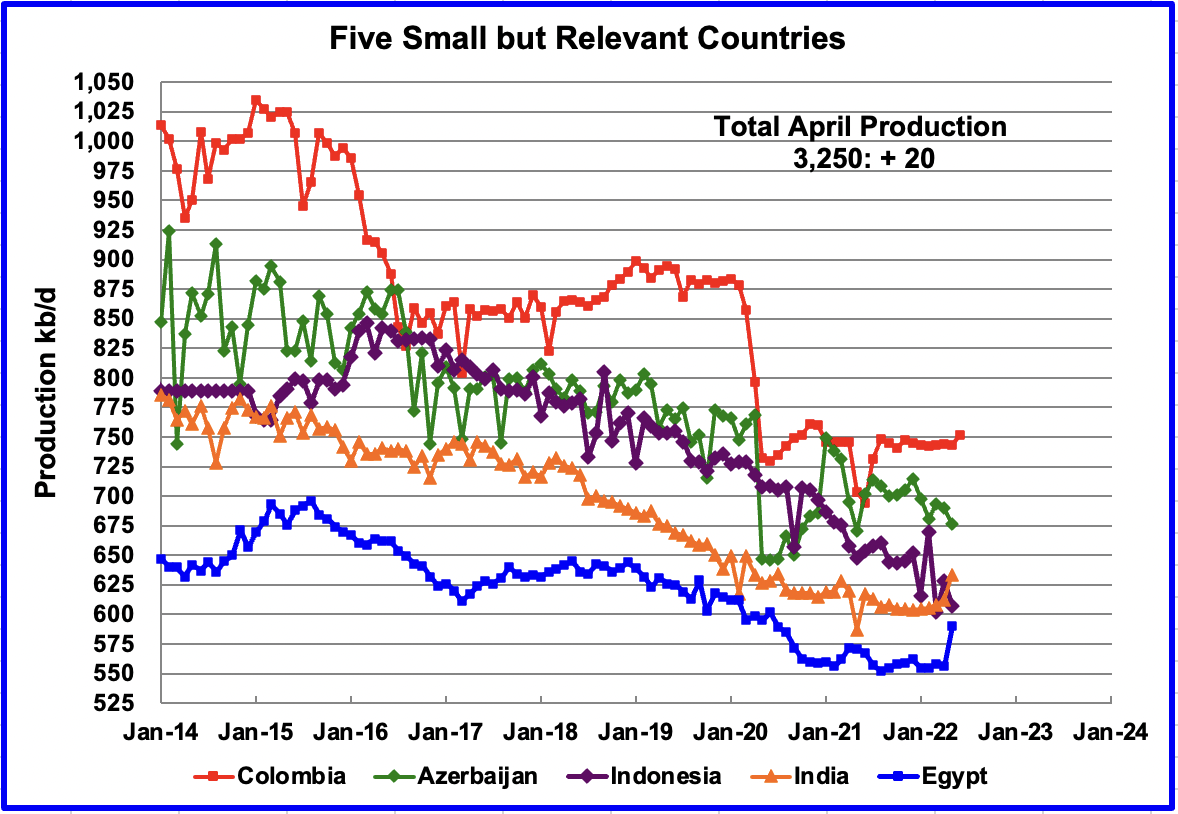
These five countries complete the list of Non-OPEC countries with annual production between 500 kb/d and 1,000 kb/d. Their combined May production was 3,250 kb/d, up 20 kb/d from April’s 3,230 kb/d.
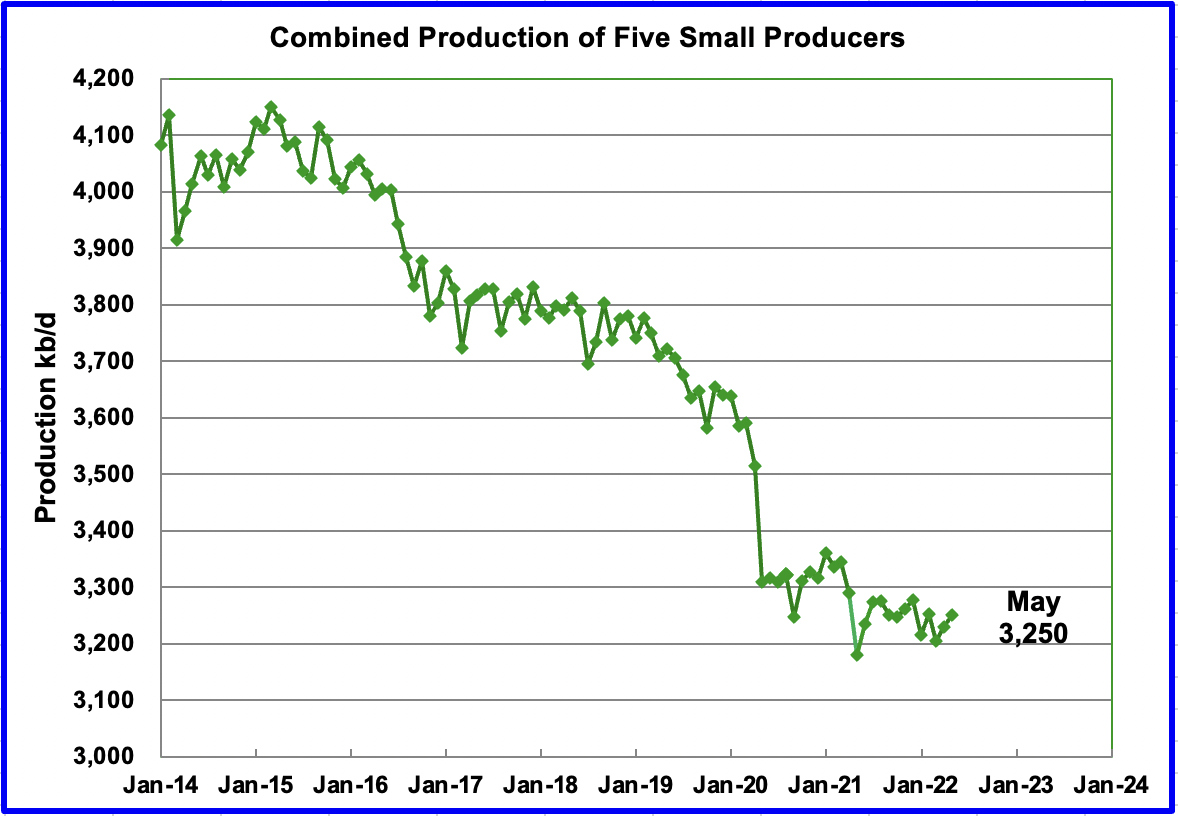
The overall output from the above five countries has been in a slow steady decline since 2015 and the decline continues.
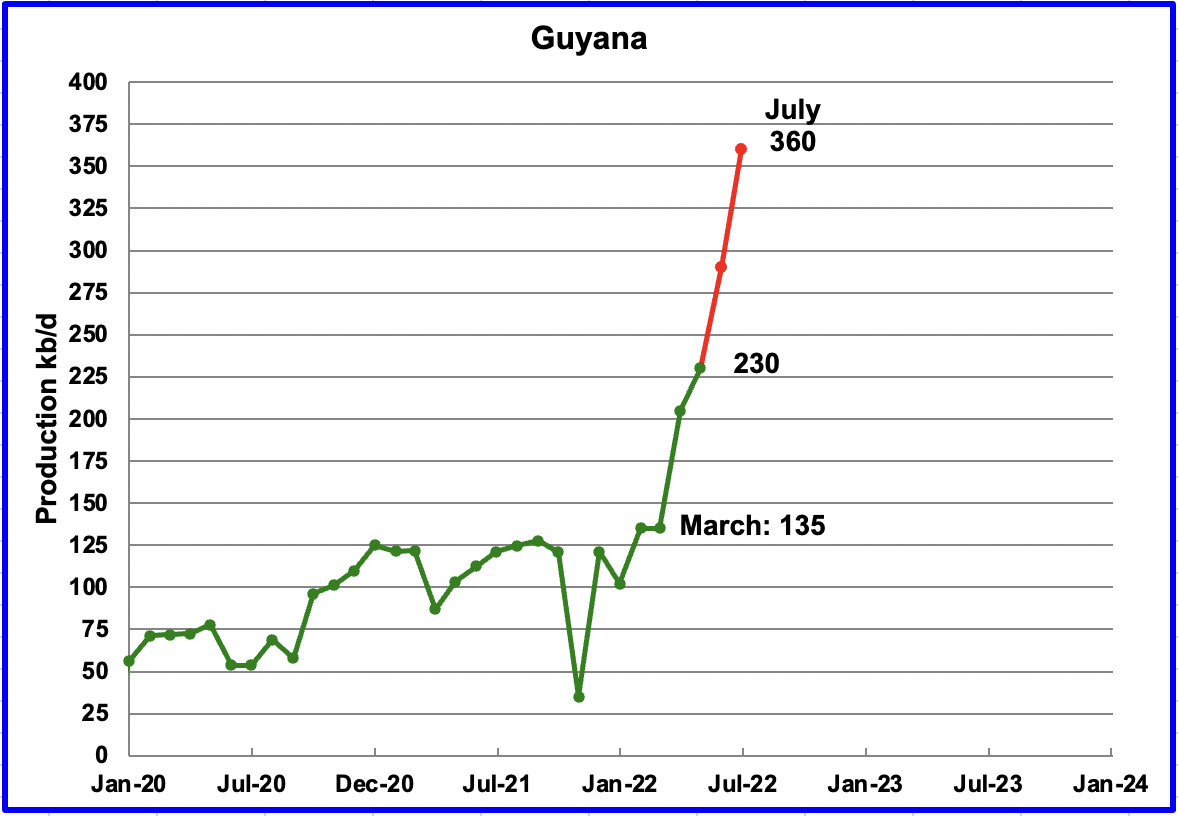
Guyana is starting to increase its production according to this source. Since March, production has increased by 225 kb/d to 360 kb/d in July. The EIA reported May production was 230 kb/d.
“Exxon’s partner Hess said in a follow up statement the group’s current production has reached 360,000 boepd. The increase was possible after optimization works that expanded capacity of the consortium’s first platform Liza Destiny by 20,000 boepd to 140,000 boepd, Hess said.
The second platform, Liza Unity, started in February and ramped up to 220,000 boepd in five months.
Guyana amounts (SIC) for one-third of the crude discovered in the World since Exxon first hit oil in the country in 2015, according to Rystad consultancy firm. The about 11 billion barrels of recoverable oil discovered to date should make the country a global oil power in the coming years, Rystad says.”
World Oil Production
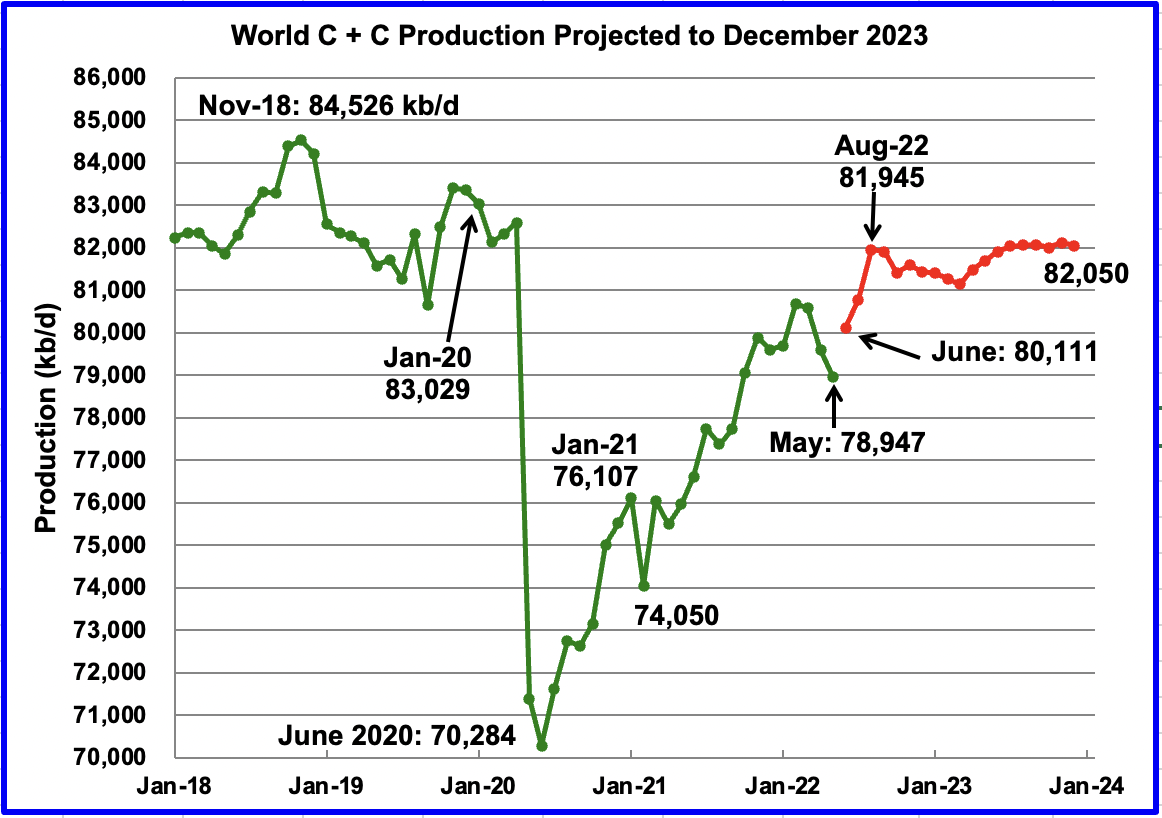
World oil production in May decreased by 638 kb/d to 78,947 kb/d according to the EIA (Green graph). As a side note, the November 2018 peak was revised up by 1 kb/d to 84,526 kb/d.
The biggest decliners were Canada 193 kb/d, Libya 180 kb/d, and Brazil 120 kb/d. The biggest offsetting increases came from Kazakhstan 148 kb/d and Russia 145 kb/d.
This chart also projects World C + C production out to December 2023. It uses the September 2022 STEO report along with the International Energy Statistics to make the projection. (Red markers).
It projects that World crude production in December 2023 will be 82,050 kb/d, little changed from the projection in the August report. The rise of close to 3,000 kb/d from May to September has increased since the August report and seems aggressive. However, it is associated with projected US and OPEC + production increases. After August 2022, World production is essentially flat at close to 82,000 kb/d out to December 2023.
Considering the upcoming June production losses shown above in the Kazakhstan and Norway charts, the smooth production increase from June to August appears to be optimistic.
World Oil Production Ranked by Country
Above are listed the World’s 11th largest oil producers.
In May 2022, these 11 countries produced 74.6% of the world’s oil. On a YoY basis, production from these 11 countries increased by 3,212 kb/d.
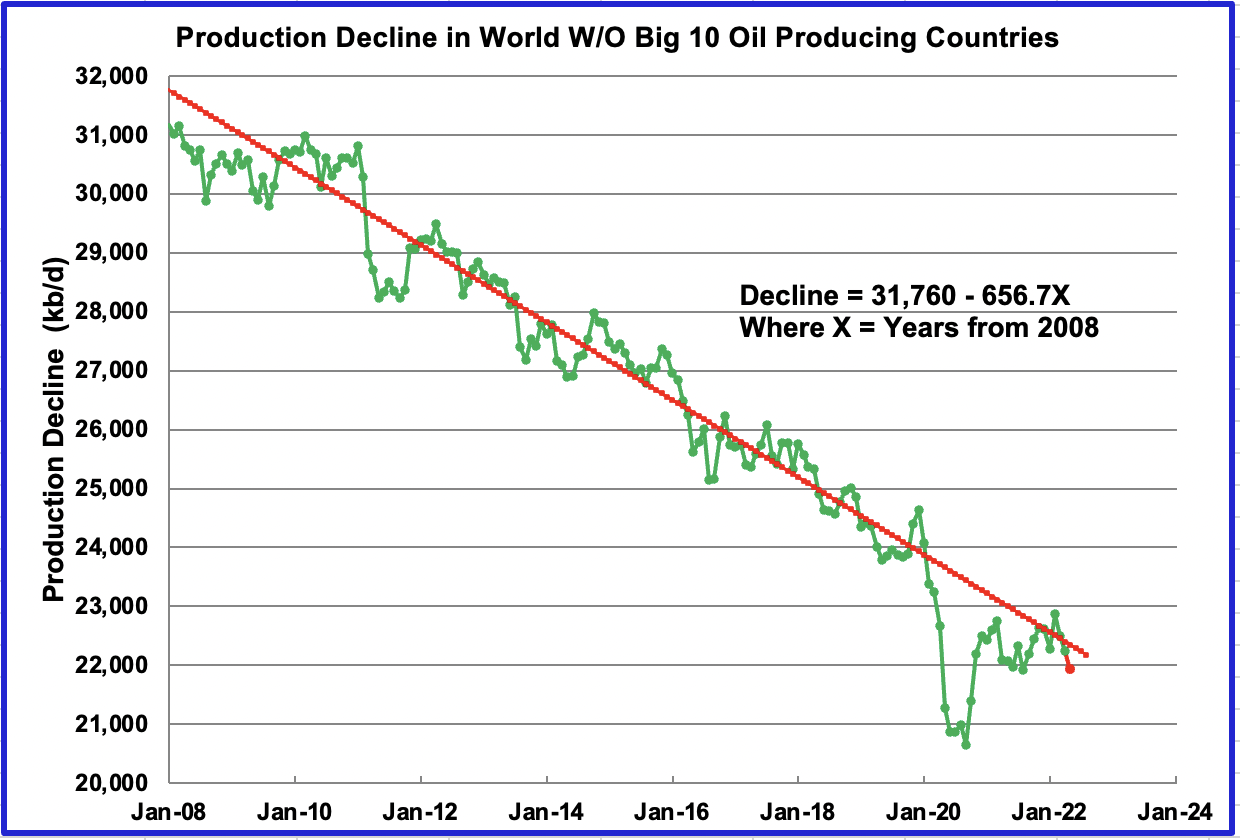
This chart shows the decline rate of World oil production, not including the World’s 10 biggest oil producers. The OLS line covers December 2009 to April 2022. The analysis does not include the data points during the big covid drop but does add in the latest 3 months up to April since production in most of these countries has returned to normal. The decline rate continues to be close to 650 kb/d/yr and has remained unchanged for the last 12 years.
This chart is the same as posted in the August update. Only the last red marker has been added and the OLS line has NOT been recalculated. Encouraging to see the May marker below the OLS line.
1) Short-Term Energy Outlook
The September STEO provides projections for the next 18 months, starting with July 2022 to December 2023, for U.S. C + C and All Liquids for other countries.
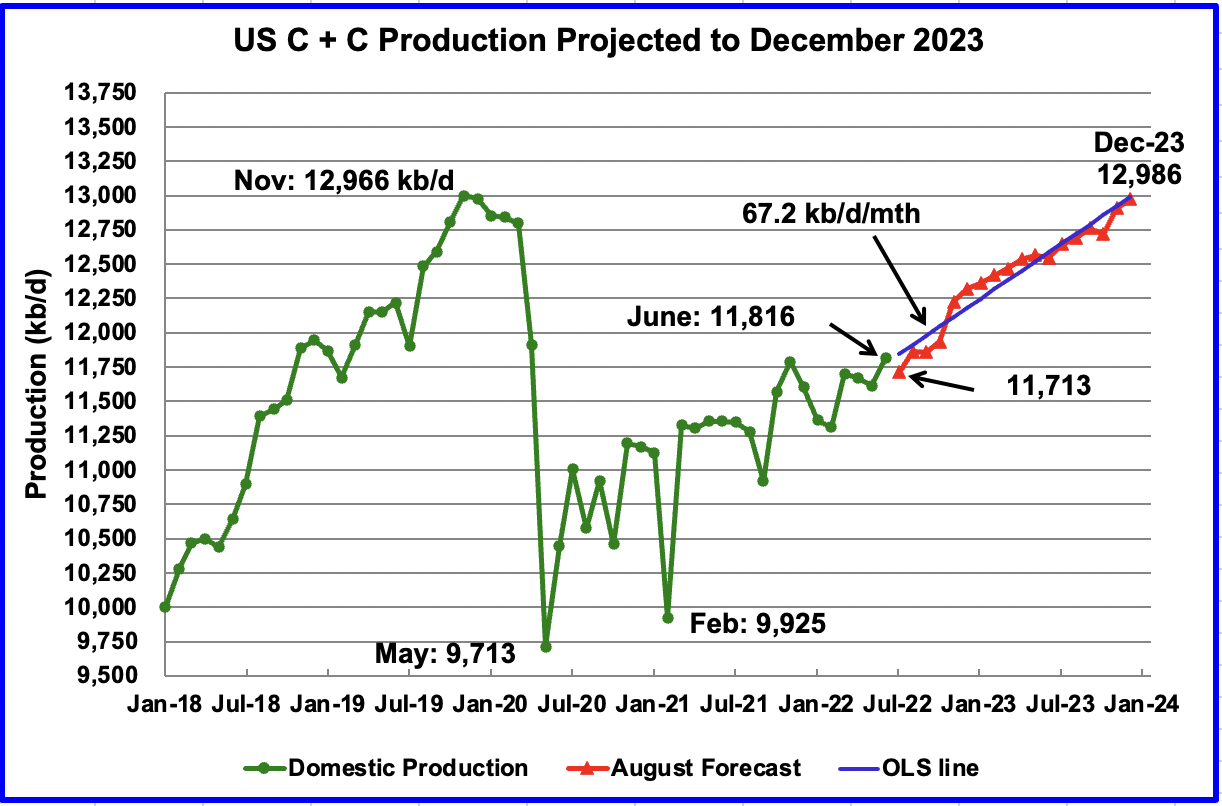
The September 2022 STEO revised down its projected US oil output from July 2022 to December 2023. In December 2023 output is expected to reach 12,986 kb/d, 287 kb/d lower than reported in the August report.
In their August report, the STEO projected US June production to be 11,814 kb/d. They nailed it since it came in at 11,816 kb/d. However, the average June weekly EIA production numbers were 12,033 kb/d. Clearly, this indicates that the STEO has their own independent sources.
Using only the projected data from July 2022 to December 2023 to fit an OLS line, the STEO is forecasting production will increase at an average rate of 67.2 kb/d/mth. If the December 2023 output is achieved, it will be 20 kb/d higher than the November 2019 record.
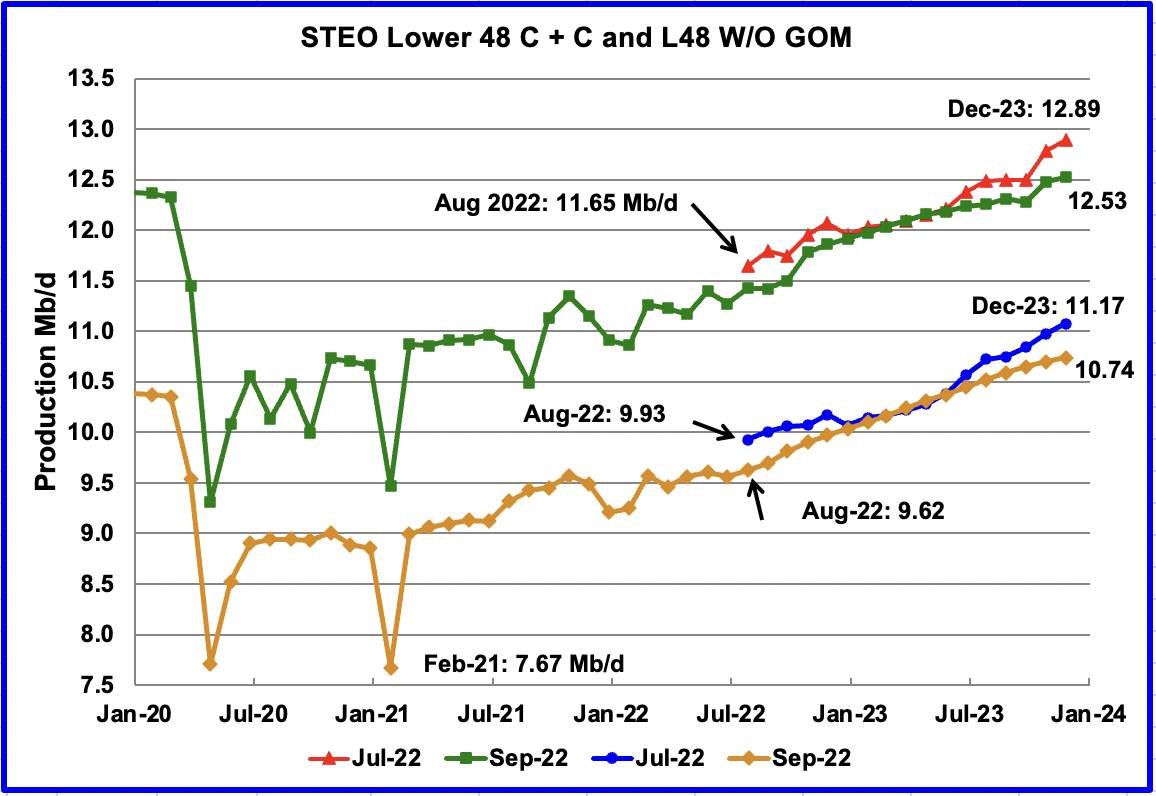
This chart compares the STEO forecast for the L48 from the July report with the current September report to better illustrate how the output forecast for September 2022 changed. For the Lower 48, the December 2023 output has been revised down by 360 kb/d to 12.53 Mb/d over a period of two months.
The September output projection for the Onshore L48 states, blue and orange graphs, has also been revised down from the July forecast. For December 2023, output was lowered by 430 kb/d to 10.74 Mb/d.
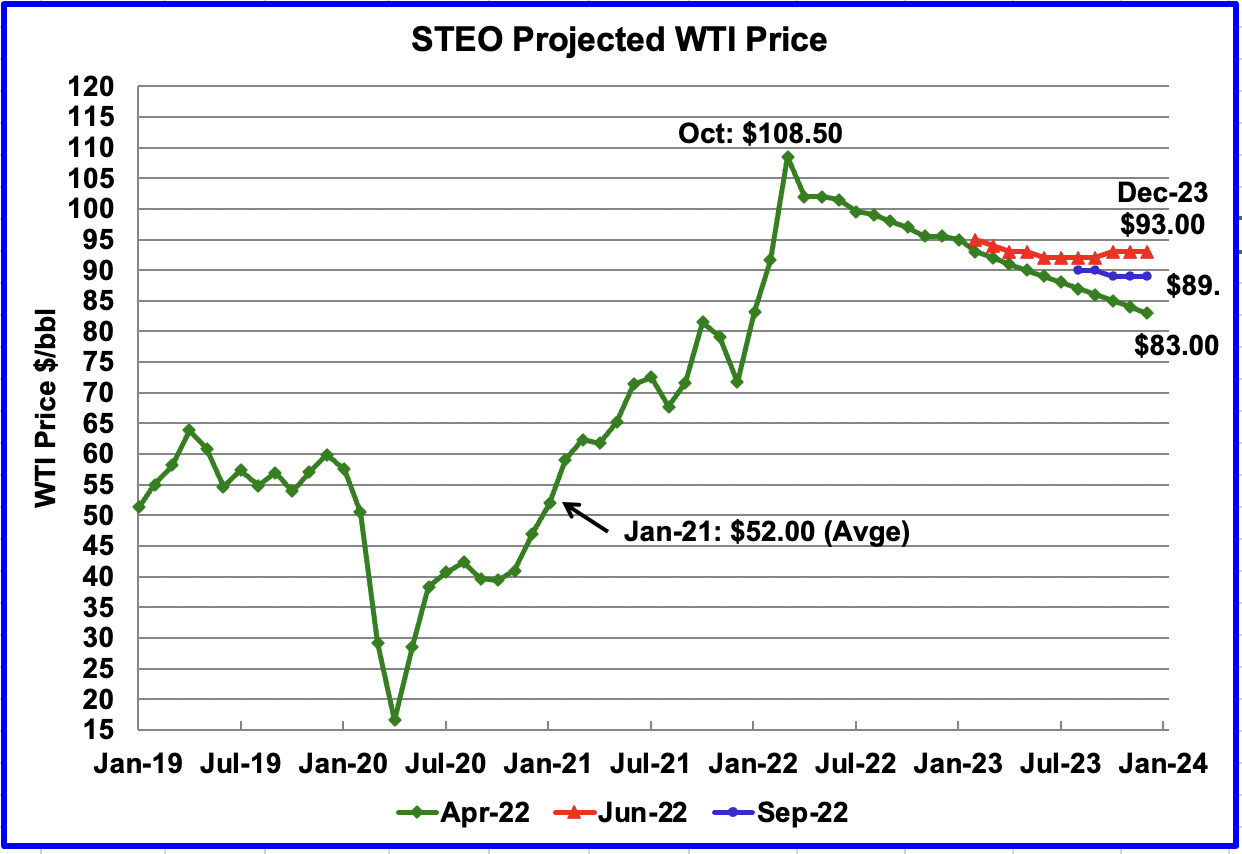
The September 2022 STEO oil price forecast continues to show a steady decline from the EIA’s March peak of $108.50/bbl to $89/bbl in December 2023, blue markers. Essentially the EIA is continuing to forecast that the only direction for the price of WTI going forward is down to the $90/b range. However, what is different with their latest forecast is that the price of oil stabilizes in the $90/b area during the latter half of 2023 as opposed to the April forecast which continued to trend down.
The September forecast shows how the STEO WTI forecasts from April to September have converged on a year-end 2023 WTI price in the $90/b range.
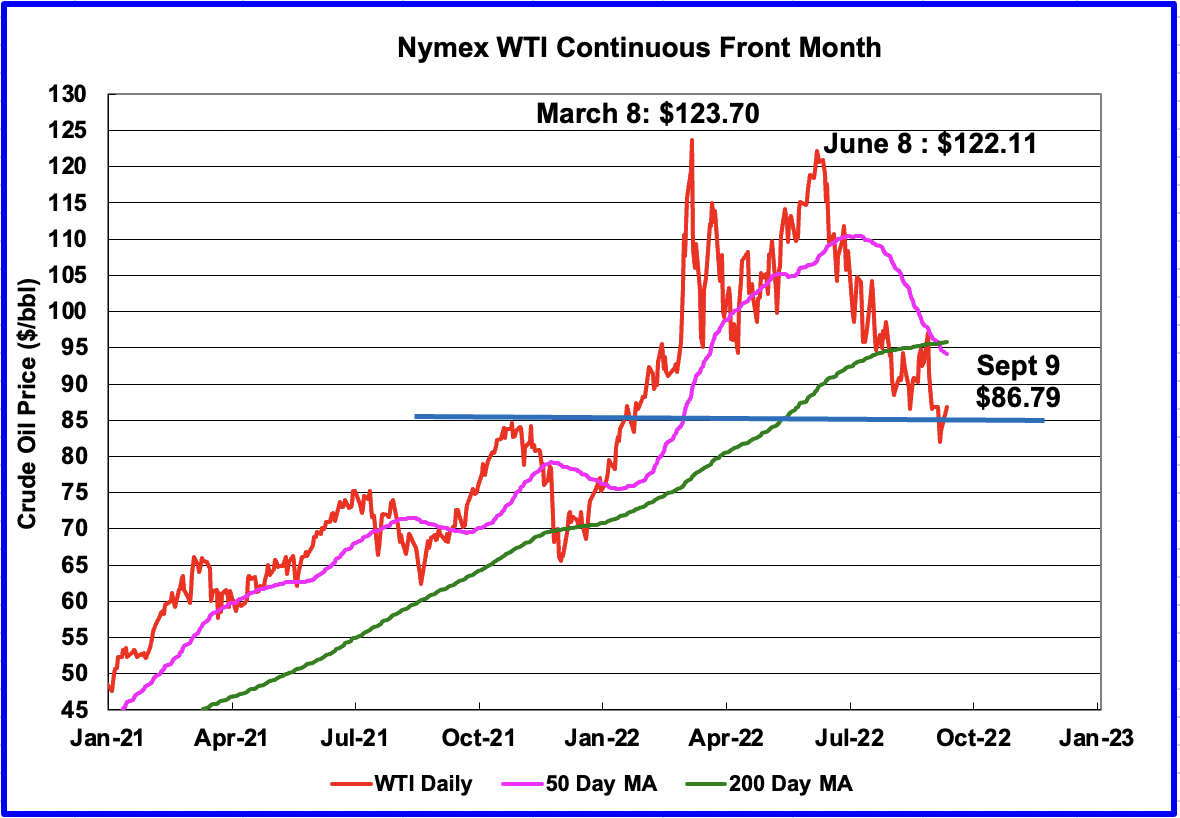
The October WTI contract settled at $86.79 on September 9, $10.11/b lower than the EIA’s forecast average price of $97.00/b for the October contract.
During the week of September 9, WTI hit a low of $81.20/b on September 8 and broke through resistance at $85/b. On September 7, the 50-day MA crossed the 200-day MA on the downside to form a death cross chart pattern. While this pattern portends short-term downside, it also portends longer-term higher prices when/if the pattern reverses.
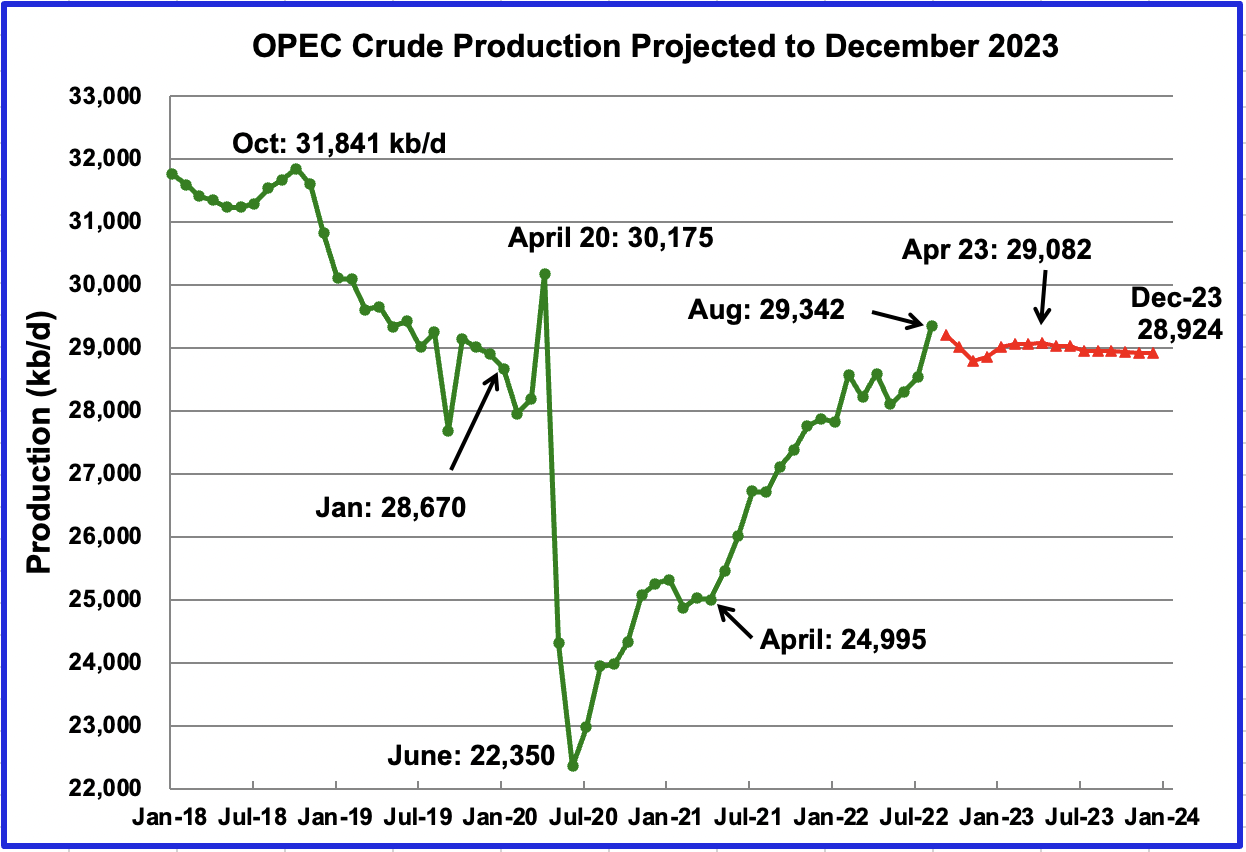
This chart shows the STEO’s September forecast for OPEC crude output from September 2022 to December 2023. OPEC’s output is projected to be essentially unchanged at close to 29,000 kb/d from September 2022 to December 2023. The September STEO forecast for July production of 28,530 kb/d is actually 369 kb/d lower than the crude production reported by OPEC.
The August OPEC report states that the call on OPEC in Q4-22 will be 29.79 Mb/d, which is 0.93 Mb/d higher than the 28.86 Mb/d production the STEO is forecasting for December 2022.
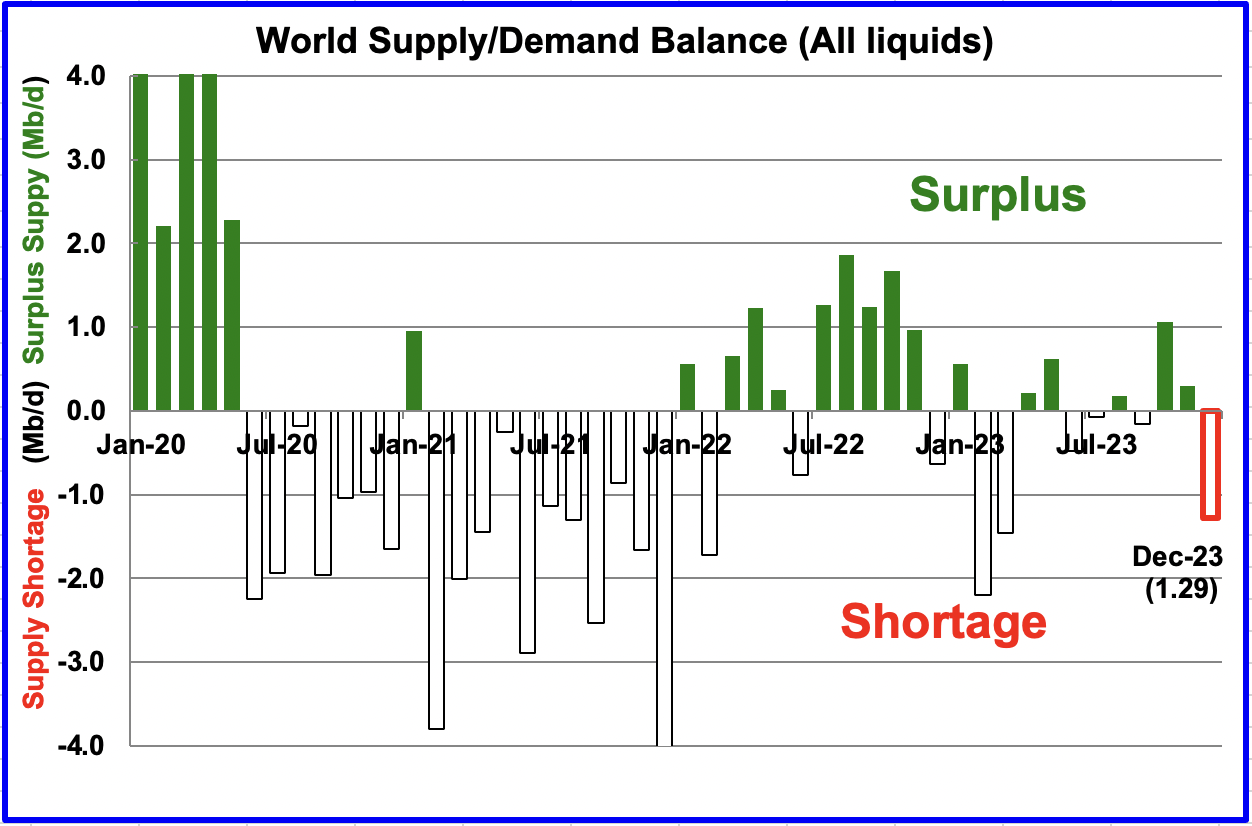
This chart shows the historical world supply/demand balance up to July 2022 and after that, the EIA’s forecast out to December 2023. The surplus of over 1,000 kb/d between August and December may be the reason for the current weakness in WTI, which is sitting close to its lowest level of $86/b on September 9 since the high of $122/b on June 8th. The supply-demand situation for 2023 is expected to be very tight with February 2023 showing a shortage of over 2,000 kb/d and March and December 2023 showing a shortage of over 1,000 kb/d.
Editor’s Note: The summary bullets for this article were chosen by Seeking Alpha editors.
Be the first to comment