

abalcazar/E+ via Getty Images
Investment summary
The market’s compressed Masimo Corporation (NASDAQ:MASI) on the chart in FY22 with the most obvious catalyst being the company’s decision to acquire Sound United, maker of high performance audio products, in Q1 FY22. This analysis doesn’t go into the particulars of the transaction [this has already been extensively covered] but we do dive into the company’s numbers and understand what it means for both the company and investors looking ahead. With the selloff, valuations have compressed substantially and we can now buy MASI at multiples not seen since FY15 at least. Net-net, we rate MASI a buy on a $151 price target.
MASI fair view of fundamentals
In order to gauge the company’s ability to continue expanding operations [with the latest acquisition included] we’ve dug down deep into some of the numbers to get a more accurate snapshot. The market was taken by surprise on MASI’s announcement to acquire Sound United. As seen in Exhibit 1, following the announcement, investors rushed to the hills and exited MASI en masse, with a large gap down at $226 to $172. Price distribution then receded to 52-week lows with authority. Since, price action has been weak and the market’s continued its neutral view on the stock.
Exhibit 1. Price action following the announced acquisition reflects short-term bias in thinking and fails to recognize MASI’s ability to unlock long-term shareholder value.
Data: HB Insights US Equity Fund, Refinitiv Eikon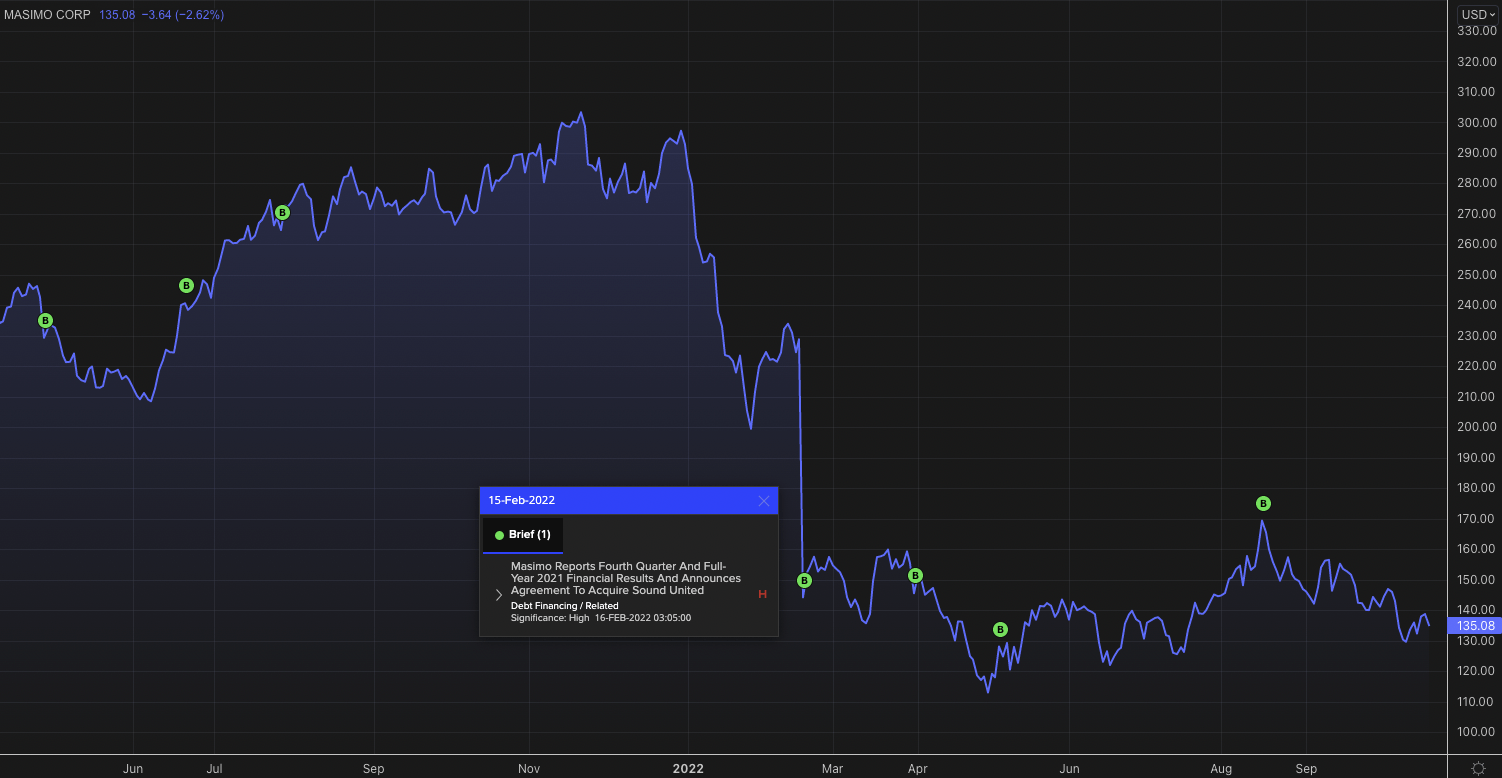
Alas, the MASI share price has fallen beneath its pre-pandemic highs and is now testing a key support channel formed in May [Exhibit 2]. Both momentum and on balance volume – long-term trend indicators – suggest that price action could be flat into the coming weeks and months, providing there’s no surprises/catalysts in the meantime.
Exhibit 2. MASI now testing support of recent uptrend formed in May 2022
Data: HB Insights, Refinitiv Eikon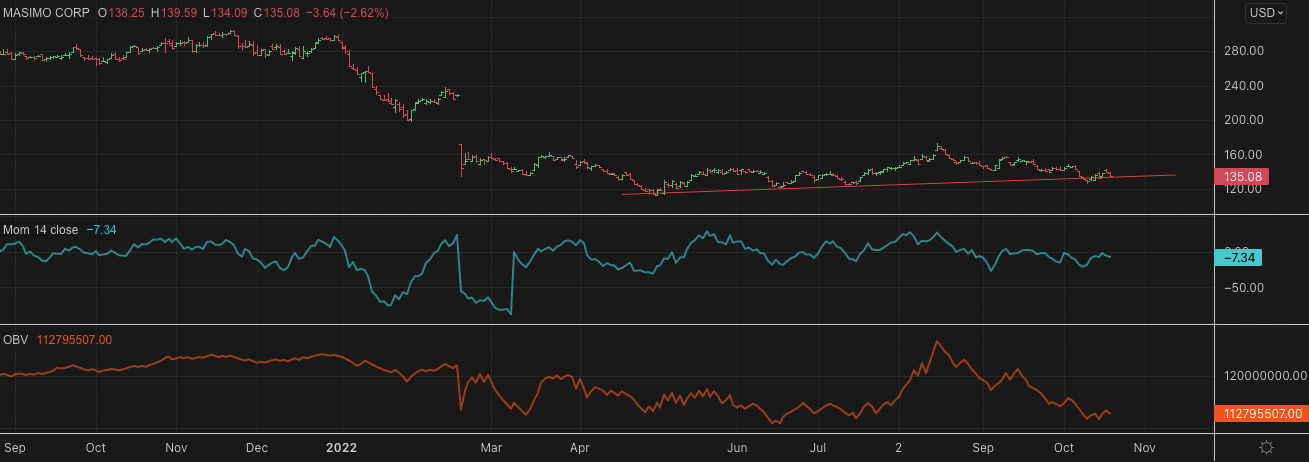
However, we propose that the selloff was an overshoot and has been compounded by the various macroeconomic/systematic variables that have plagued equity markets in 2022. Chief to the debate is the balance of inflation and central bank tightening, however, these have a small impact to MASI’s earnings growth by estimation. The company is lowly-levered and this appears to be coming down after the issuance of $936mm in debt during Q2 FY22. The central debate for MASI, however, is what impact the Sound United transaction will have on measures of profitability and return for both the company and investors. It becomes a debate of multiples contraction vs. long-term EPS accretion, plus effects to FCF, net working capital (“NWC”) and return on invested capital (“ROIC”).
Firstly, analysis of the company’s quarterly numbers over a 5-year time series reveals that the acquisition had a material impact to operating profit and FCF from Q2FY22 onwards. As seen in Exhibit 3 (a)., EPS actuals have remained flat for several years. However, there’s now a divergence in TTM FCF yield to TTM earnings yield for MASI, as seen in the chart below [bottom right hand corner], with the former stretching up to c.200bps and the latter down to 2.47%.
Given management’s directive on EPS accretion following the acquisition, these numbers therefore become paramount in the analysis looking ahead. Investors can note our forward estimates for the company, including the estimated accretion factor form the Sound United transaction, in Appendix 1 [located at the end of this report].
Exhibit 3: (a).
Data: HB Insights, MASI SEC Filings
It’s therefore essential to breakdown measures of profitability for the company looking ahead. Firstly, Exhibit 4 provides a breakdown of both company and investor return on equity (“ROE”) from Q1 FY22 to Q4 FY22 estimates. As observed, the drift in ROE was recognized immediately in the second quarter, compressing quarterly ROE to 1.5% [6.14% annualized] from a print of 2.94% [12.2% annualized].
On face value, it would appear that investors may have reacted accordingly to the news. However, recall that the market prices securities on a combination of past earnings/investment growth and future earnings/investment expectations, hence, it is what lies ahead that’s far more important for MASI. In saying this, investors can note our forecasted quarterly revenue contribution from Sound United into the coming 2-years in the chart below. To see a contribution of c.$280mm to the top-line from Sound United by Q4 FY23 isn’t an unreasonable expectation, by estimate.
Exhibit 3: (b).
Data: HB Insights Estimates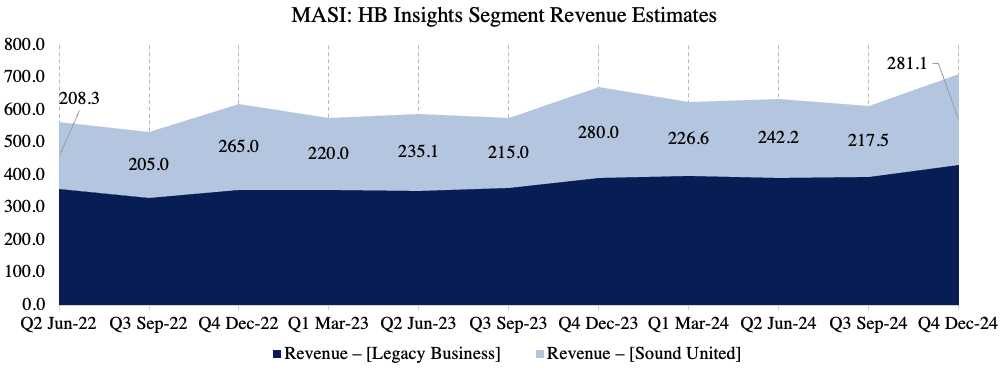
As seen below, our forward estimates [that don’t drift too far off consensus] imply a period of growth at the bottom-line for the company looking ahead. We estimate asset turnover to increase to 0.47 in Q4 FY22 from lows of ~0.16 in Q1 FY22, with a corresponding decrease in financial leverage to 2.24x. Importantly, net margin and ROE both look primed to mean revert as well, and we estimate MASI to deliver an 11.7% ROE for Q4 this year.
In terms of value, at the current P/Book multiple of 5.93x, the quarterly investor ROE is small at 0.25% [1% annualized]. With the prescribed estimates however this analysis suggests that investors should enjoy a 2.05% [8.4% annualized] ROE by the fourth quarter. In this vein, the transaction would prove to be immediately accretive to both company and investors by outpacing the pre-acquisition numbers, thus bolstering the upside case.
Exhibit 4. ROE for both the company and investors looks primed to revert to the upside and outpace pre-acquisition numbers
Note: Breakdown of company ROE performed using DuPont ROE analysis. All figures are represented as quarterly actuals/estimates. (Data: HB Insights Estimates, MASI SEC filings)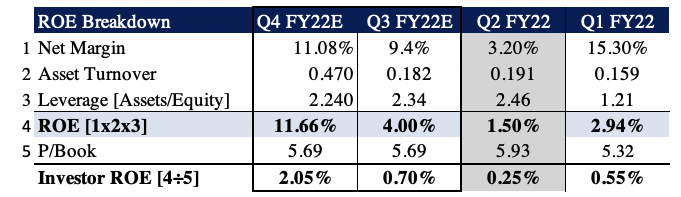
We performed a similar analysis on ROIC to observe where its strengths lie in generating return on its investments. As seen in Exhibit 5, the Sound United acquisition corresponded with a large slump in ROIC at the recorded date. Noteworthy however is the fact that both NOPAT margin and invested capital turnover have both tightened substantially since FY17, resulting in a wind-down to ROIC during this period to date. All three are now at record-low levels.
Regardless, the company still recorded a c.400bps return on its investments last quarter, and has averaged an 11% TTM ROIC over the FY17 period to date. The majority of this return is consistently derived from the NOPAT margin, suggesting that we must continue looking at differentiating factors for MASI when prescribing corporate value [vs. its position with pricing power, competition, barriers to entry, etc.]. Whether the Sound United acquisition fulfils this mandate remains to be seen. Nevertheless, on a 5-year average 11% TTM, we advocate that MASI must deliver these kinds of numbers in order to successfully justify the position, and continue compounding capital above its WACC hurdle of 9.25%.
Exhibit 5. Return on investment trends have narrowed in recent years. MASI must revert to a TTM ROIC of c.11% as one more piece of evidence for the transaction’s success
Note: All figures are quarterly actuals and are in % or absolute values. (Data: HB Insights, MASI SEC Filings)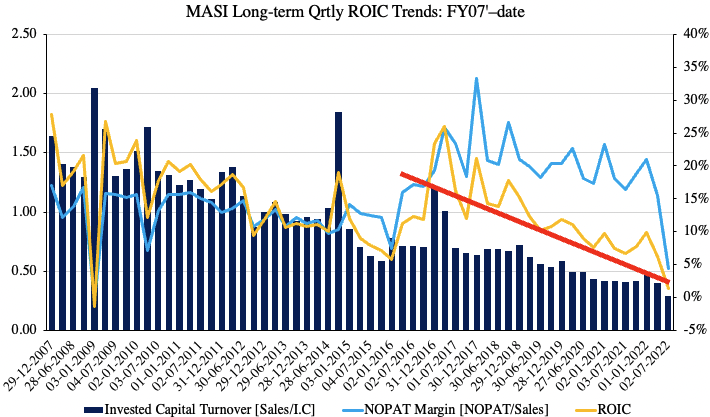
Valuation and conclusion
As mentioned, it’s now a debate of earnings/FCF/ROIC accretion versus contraction of multiples for MASI. The market sold off equities violently in the roll-over to the new financial year, amid a shift in long-term policy rates and tightening of central bank balance sheets. For MASI, this resulted in a large re-rating in both P/E and P/B to FY13/14 levels, as seen in the chart below. Despite a subsequent recovery, multiples then contracted sharply again following news of the acquisition. MASI now trades at 40x TTM earnings, ~34x forward earnings and 5.9x book value – the former still quite a lofty premium.
At 34x forward earnings, this lies just ahead of the GICS Health Care Equipment median forward P/E of 32x, suggesting the market also expects above-sector earnings upside looking ahead. It is also a discount to the company’s 5-year average P/E of 41.4x and therefore represents value in our estimation. Assigning the 34x forward multiple to our FY22 EPS estimates of $4.46 sets a price target of $151.60 for this year.
Exhibit 6. MASI trading below 6-year historical averages on earnings and book value multiples.
Data: HB Insights, Refinitiv Datastream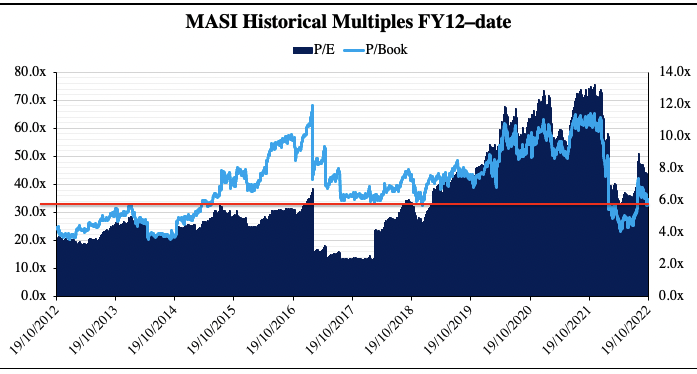
Net-net, we suggest the market has overshot its MASI selloff and that shares remain compressed on the back of this. This presents a buying opportunity on the weakness, at multiples not seen since FY15 at least. Diving a little deeper implies there’s earnings accretion and upside in terms of share price into the coming periods. We estimate a material shift to ROE for MASI looking ahead, and forecast earnings accretion for the company into the coming years as well. We price MASI at $151 on 34x forward EPS estimates, seeking 12.5% /$16.86 per share in doing so. Rate buy.
Appendices
Appendix 1.
MASI forward estimated and EPS accretion factor.
Data: HB Insights Estimates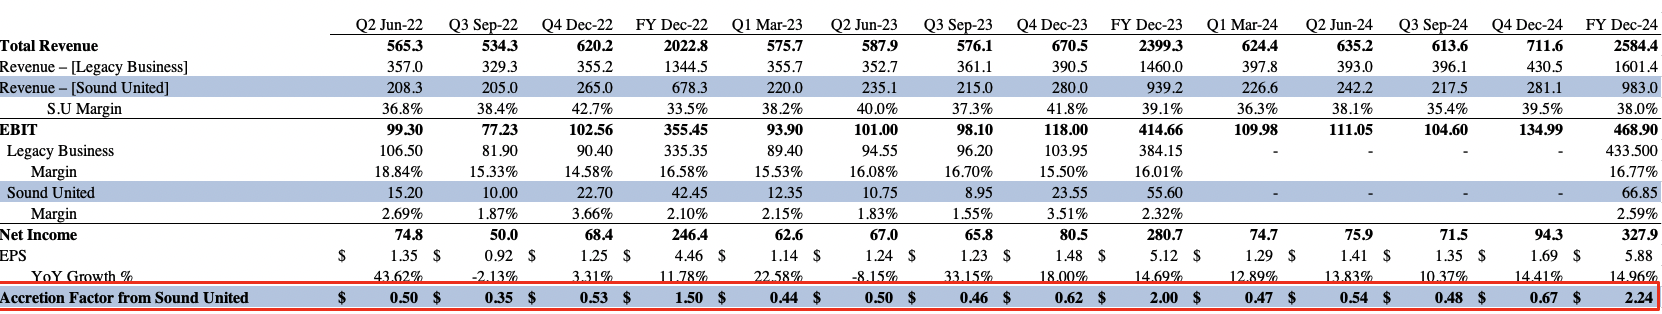
Be the first to comment