

Spencer Platt/Getty Images News
Major markets reverse like dominoes, and this pattern continues until all markets are moving in the same direction. Identifying the leading markets can help you stay ahead of a trend change. Today, we will continue with our theme from last week, showing that the same divergence patterns are building globally and also within the U.S. Below, we look at three global markets, including two U.S. markets that appear to have incomplete uptrends off the COVID lows. This implies that they need one more push to new highs in order to complete their trends. This is ultimately a positive sign for equities, and supports a surprise move to the upside in the coming months.
When all markets are moving in the same direction, we are in a powerful trend. We saw this in 2017 and late 2020/early 2021, where all major global markets, including all U.S. sectors, were moving up together. Adversely, in Q1 of 2022, all global markets were pointing down, which signaled the same pattern in the opposite direction. However, since April of 2022, we have started to see various global markets bottom and start new uptrends, which we pointed out in last week’s update, when we said “Japanese markets bottomed in March of 2022, followed by China, Australia and now Germany and France.”
Markets move in 5 waves. 1,3,5 are in the direction of the predominant trend, while 2 and 4 are corrections within the larger trend. Like we stated prior, most major markets have put in a bottom and have begun a new uptrend before the S&P 500’s current October 13th low. Below, I discuss the S&P500 levels I am watching to confirm a new uptrend plus I discuss the markets that are setting up to make a new high.
Global Markets
The Canadian TSX has a history of leading the U.S. Markets. It’s a commodity rich economy, which tends to get affected from energy price. That being said, the Canadian central bank just announced a surprise 50 BPs increase in rates, while the consensus was expecting 75 BPs. This makes Canada the 3rd central bank to pivot, behind the Bank of England and the Bank of Australia.
As a result, the Canadian TSX broke above it bear market trend line (below). Interestingly, this bear market appears to be only a 4th wave within a developing 5th wave push off the COVID low.
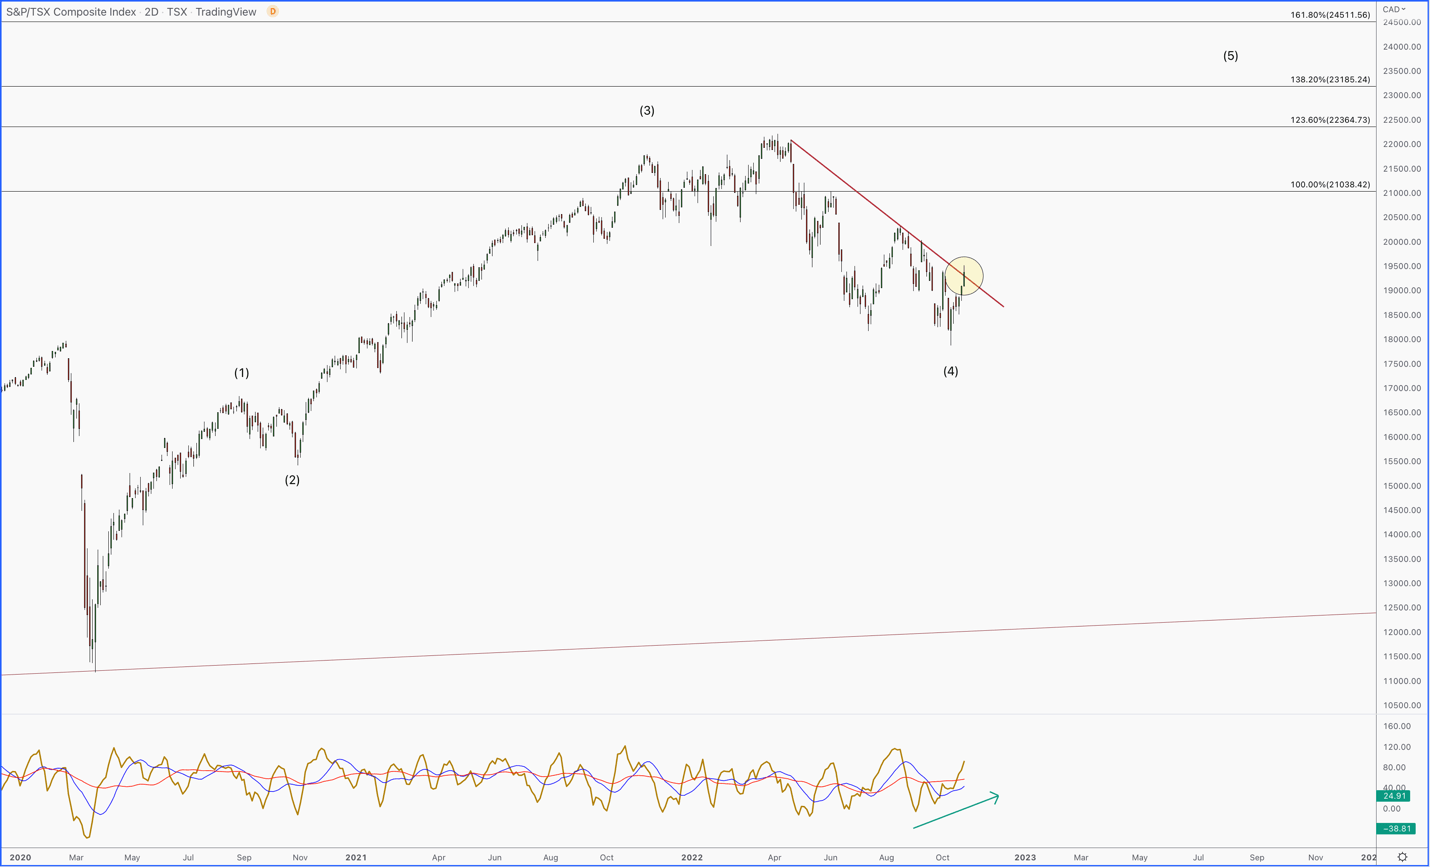
I/O Fund
The same pattern is playing out in Australia. Like Canada, this bear market seems to be playing out as a messy, and complex 4th wave within a larger uptrend. The Australian XJO is testing the bear market resistance line, and very close to signaling a meaningful low was put in.
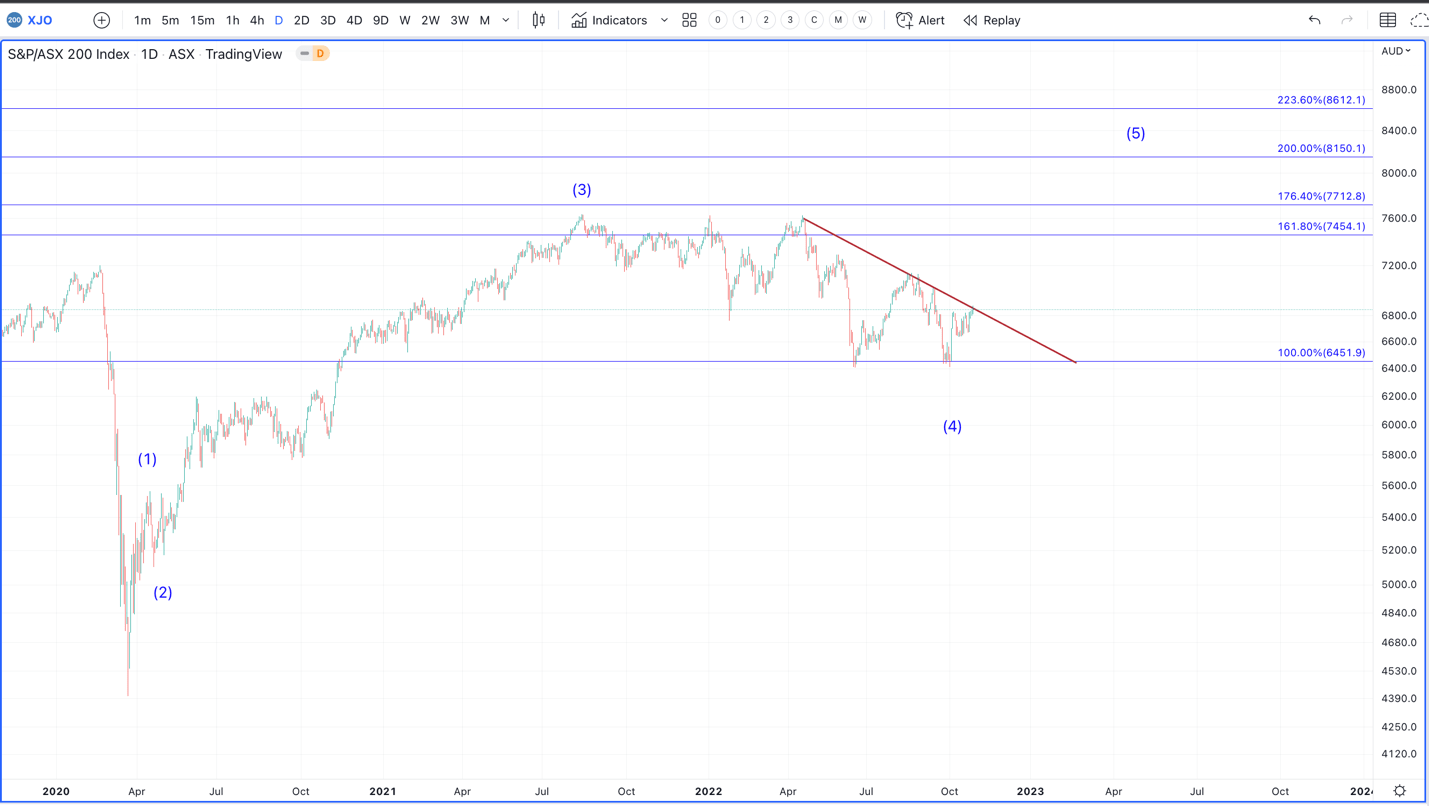
I/O Fund
The same pattern can be seen in Japan. Note that we have a messy and overlapping bear market, which is the opposite of the sharp and quick 2nd wave drop close to the beginning of the new uptrend. This is a very common theme, which supports this bear market as only a 4th wave with new highs to follow.
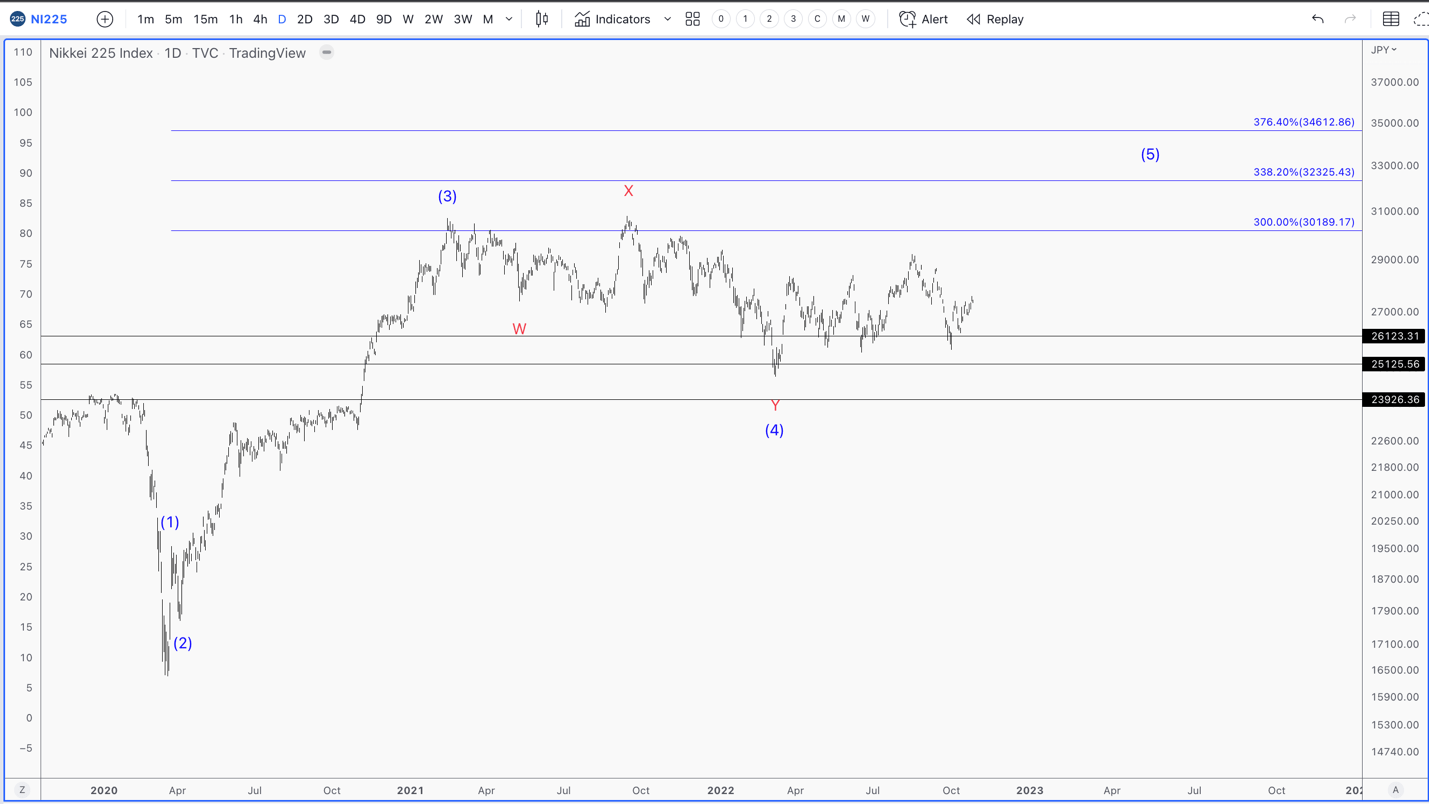
I/O Fund
It’s important to note that we’ve just seen three major global markets that are suggesting a push higher. If accurate this will be bullish for equites. Also, this theme is not limited to only global markets. There are several markets that appear to be finishing up their 4th wave corrections, and suggesting a higher push in order to complete the uptrend off the COVID low.
U.S. Markets
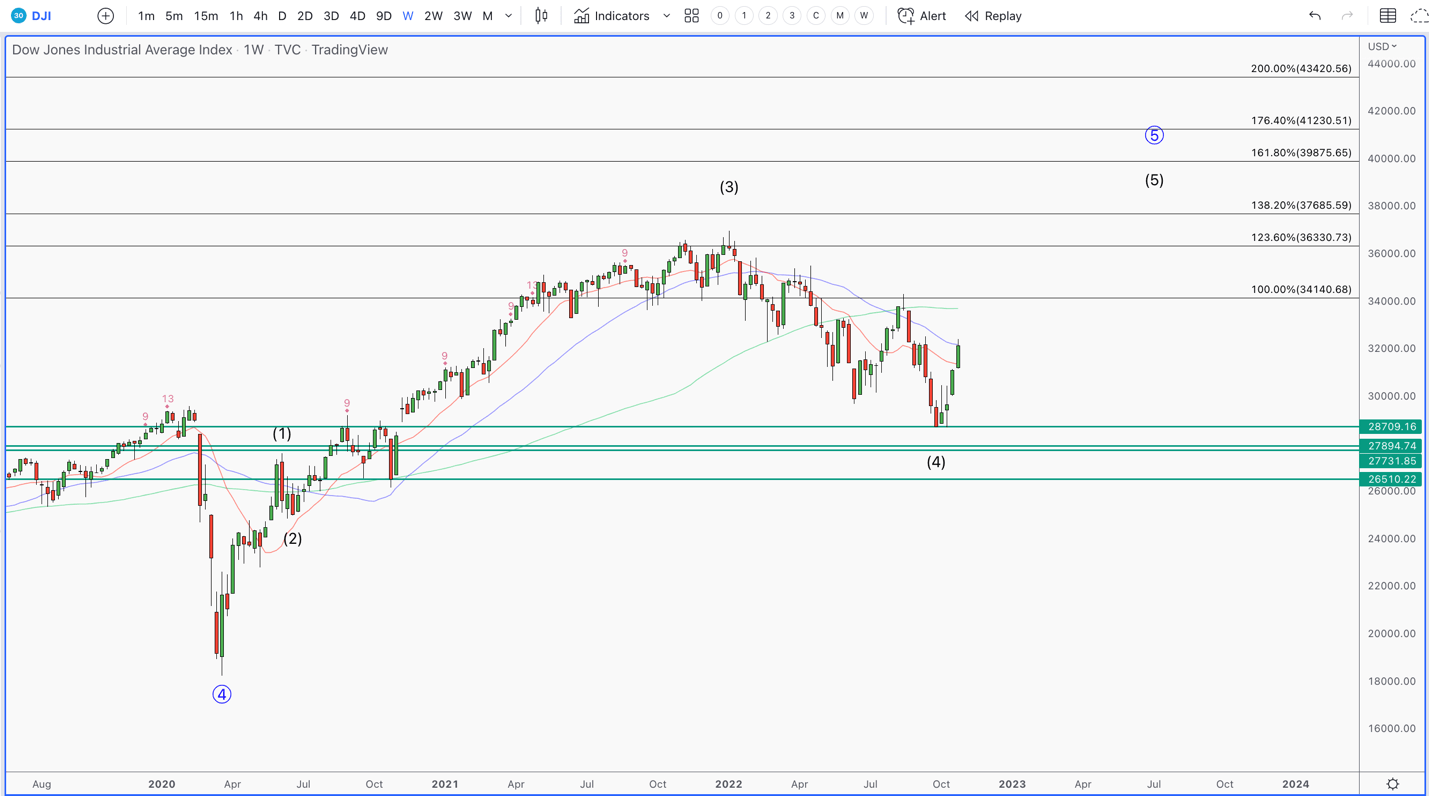
The DJI is showing remarkable relative strength since the October Low. First off, it bottomed in late September ahead of Big Tech and the S7P 500. While most are focused on Google, Microsoft, and Meta, they are ignoring the fact that the S&P 500 and DJI closed green while Microsoft and Google were down. There are simply too many stocks and markets within the U.S. in new uptrends to suggest that we are setting up for a big move down.
The DJI appears to be setting up for a move higher, much like the previously mentioned global markets. The bear market is messy and overlapping, which is characteristic of 4th waves. This pattern is suggesting one more push to new highs in the future.
I/O Fund
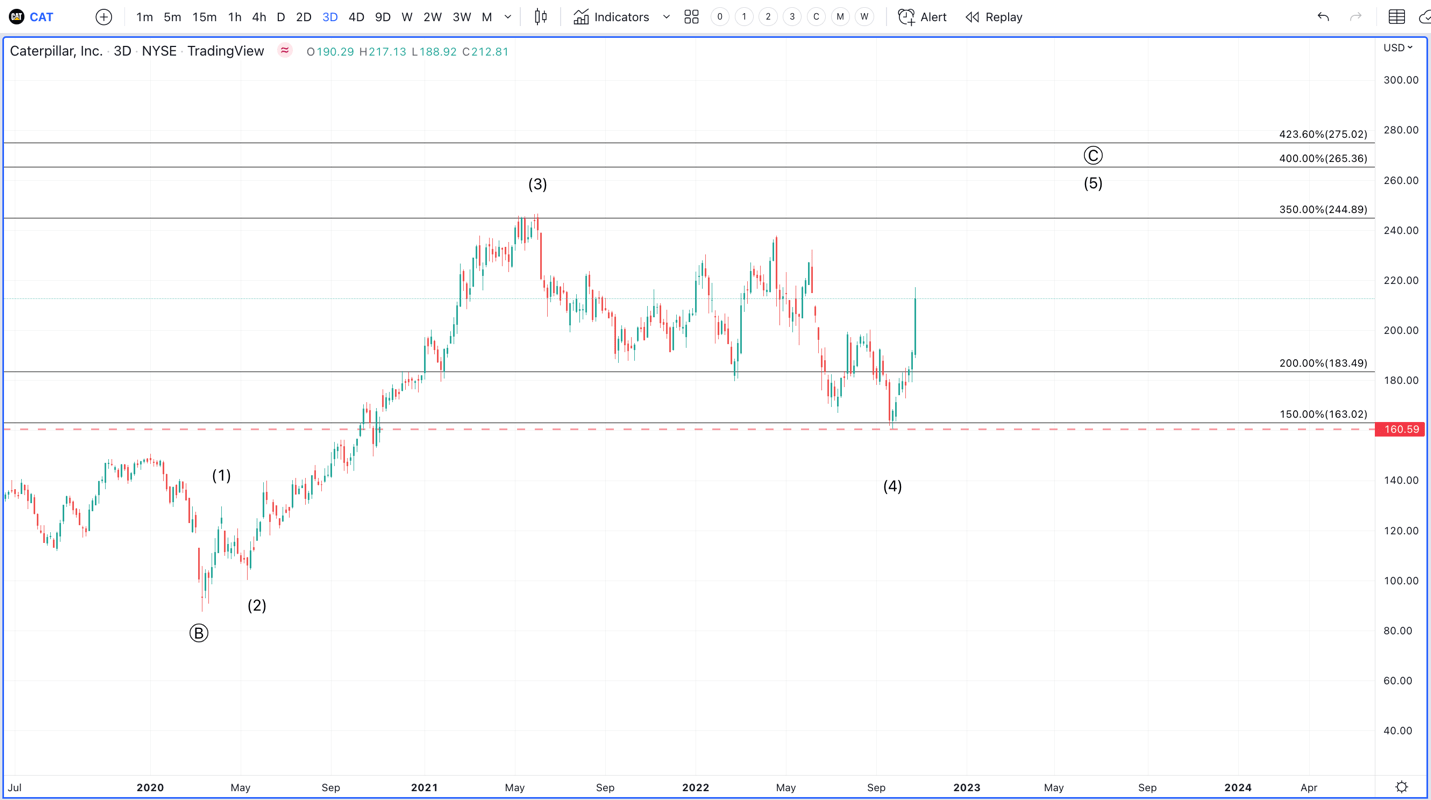
Caterpillar (CAT) is an important stock to track, considering its business is global and tied to economic expansions. Like many stocks, it bottomed in late September, ahead of the S&P 500, and since then has been in a strong uptrend. The gap today based on its earnings looks like a breakaway gap, which tends to happen in 3rd waves. This suggests that a meaningful low was put in, as CAT moves closer to confirming a 5th wave push to new highs.
I/O Fund
You may be asking, what does this have to do with tech? No stocks operate in a vacuum, and at times, we can see great companies become terrible stocks. Most of 2022 was the proof for this claim. So, if a new global uptrend is brewing, expect all stocks to participate, especially beaten down tech.
Next week, we will look at the new leaders within the tech sector who are showing similar patterns that we have shown in this report. Considering the next move higher will be the 5th wave in some markets, I do not expect all stocks and markets to make new highs. However, some are so beaten down that an outsized move would not be a surprise.
S&P 500 Levels
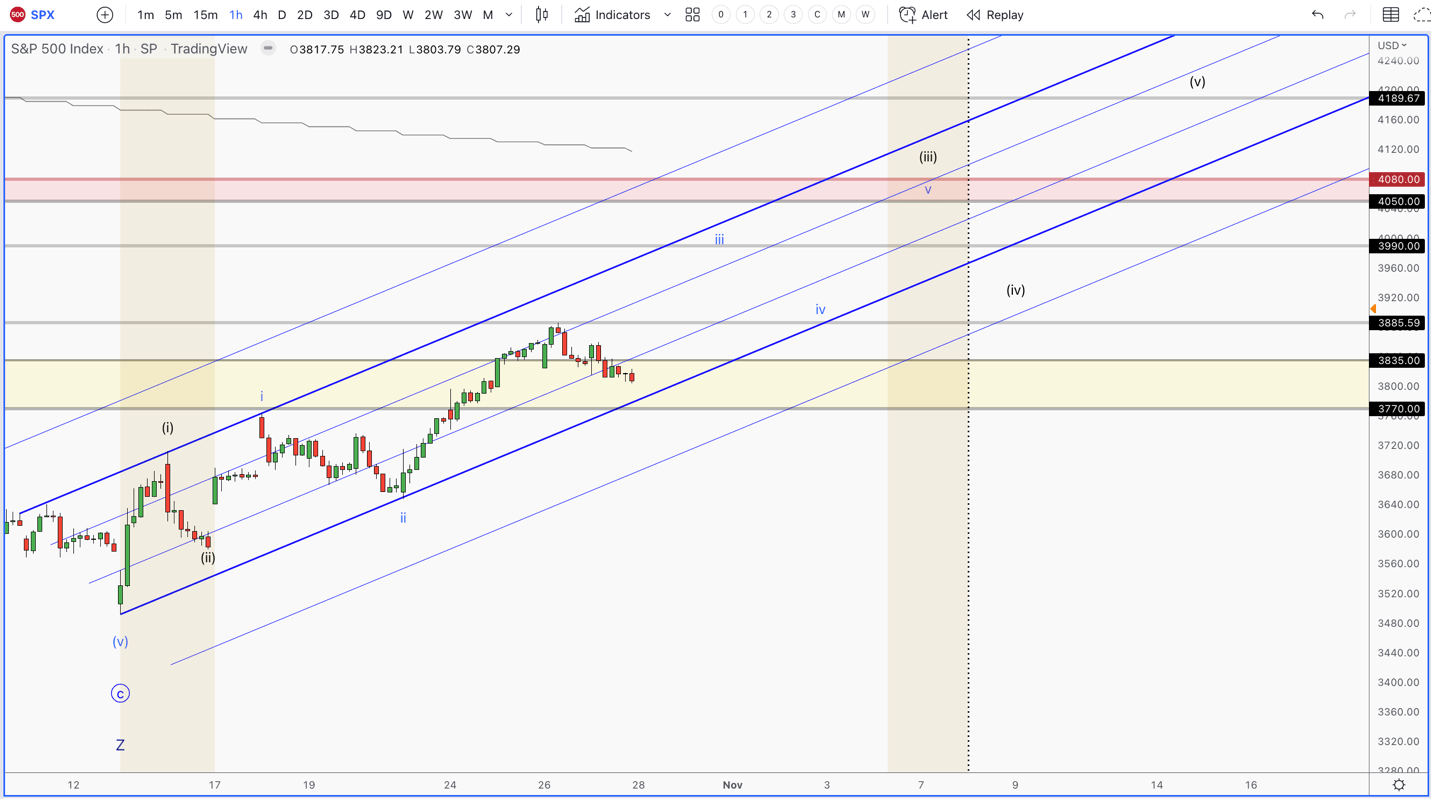
These divergence patterns tend to precede big trend changes. But, until the U.S. broad market confirms it, the risk remains elevated in the market. The S&P 500 has given us a nice 5-wave move off the October 13th low; however, we need this to morph into a larger 5-wave pattern, which is still playing out. Until this develops, the risk remains that we are in a bear market bounce.
I/O Fund
In order to confirm a meaningful low was put in, the current weakness in the market needs to hold 3770 SPX. We then need to make one more high to continue the pattern. If this happens, the real test will be in early November. We have the FED meeting, the jobs report, and an election, all of which tend to move markets. The price resistance overhead of importance is 4050-4090. There are multiple techniques pointing to this region being a wall for the bulls. This also will likely coincide with the 200-day moving average, which halted the last bear market bounce.
If we do make it to this region by next week, risk will be high. This will be the biggest test for the bulls, and one worth managing risk around. If we instead break down below the 3775 SPX region, it will signal more weakness in the broad market. However, this will only intensify the divergences in the market, as not all stocks will make new lows.
In conclusion, more and more signs are pointing to a bigger trend reversal underway. Several markets are in new uptrends and suggesting a push to new highs is on the horizon. This will lift all boats, but I do not expect all stocks/markets to make new highs. It’s important to identify the winners, and stick with them in these new uptrends. Not all prior leaders will keep leading, which is why we perform this analysis.
Be the first to comment