

Mismatched Bridge Construction DNY59/iStock via Getty Images
Old stock market lore says that the market returns and fills prior gaps.
We now have two recent gaps in the S&P 500, one at around 4200 and one at around 3800.
So, which gets filled first?
Finviz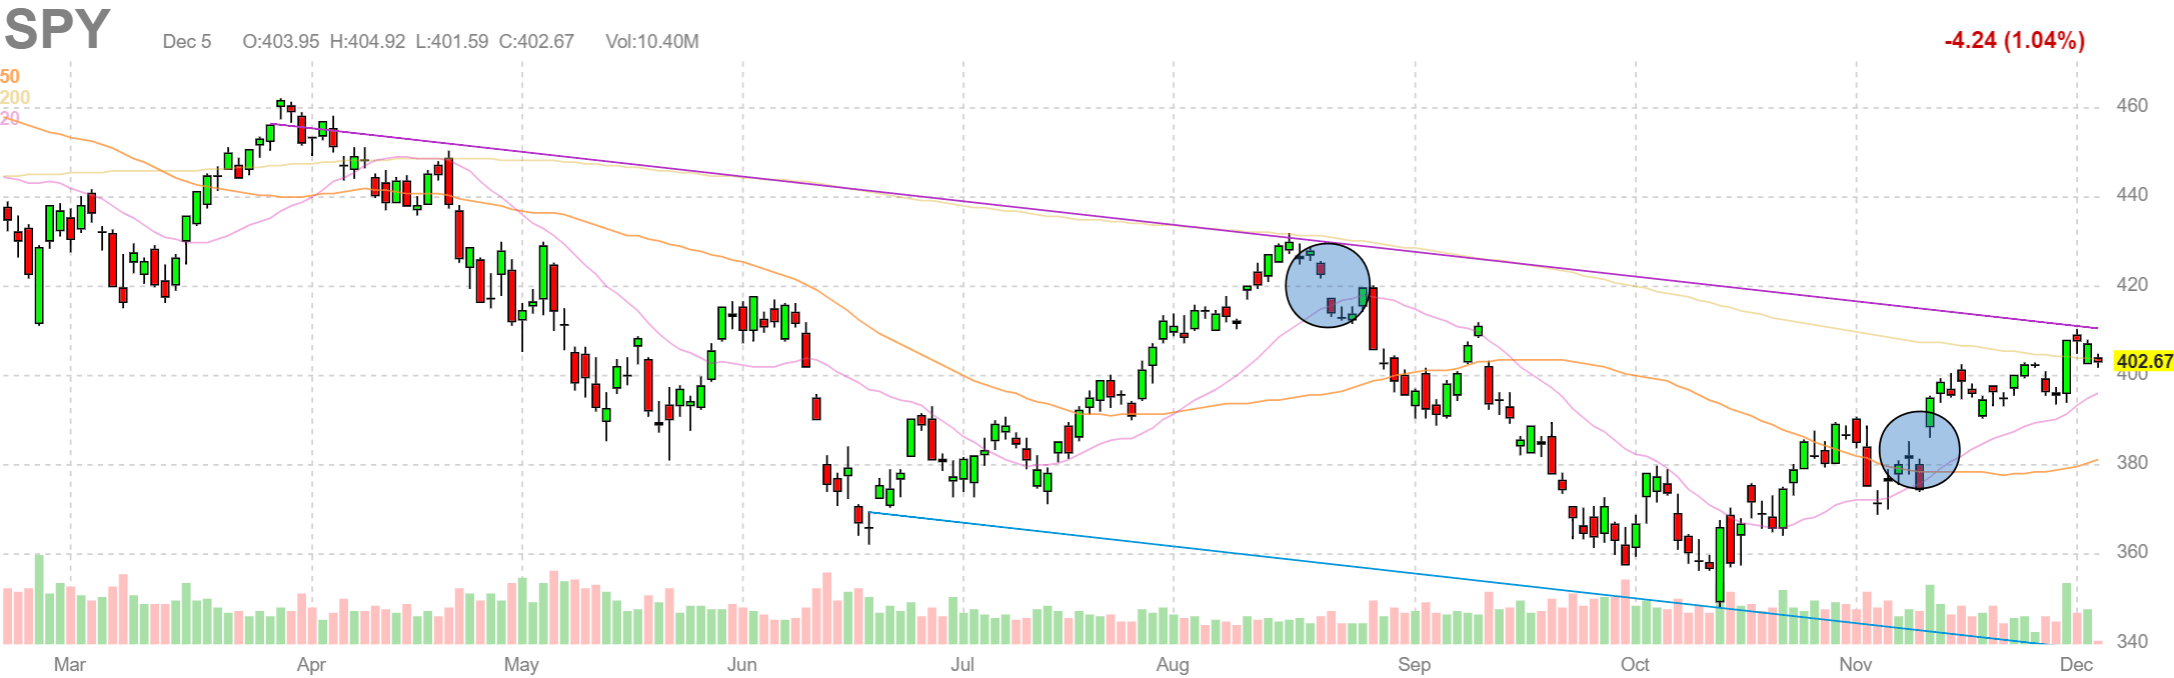
Wall Street needs the market to go up as much as possible before the end of the year to save bonuses and jobs. The Fed needs it to go down to wipe out phantom savings and force austerity.
So far, the market is not anticipating a large Fed Funds rate increase.
The 1-Month T-Bill rate tracks the FFR over extended periods and shows real-time view of market’s short-term rate.
The grey line below is the Fed Funds Rate – the vertical pop at the end is a 50 bip possible rate hike next week (not even the 75 bips of the prior 4 raises).
Note how the 1-month rate trended up prior to the two previous Fed rate hikes, and was doing so late last month but has now pulled back. Market participants are not investing toward a large rate hike.
U.S. Treasury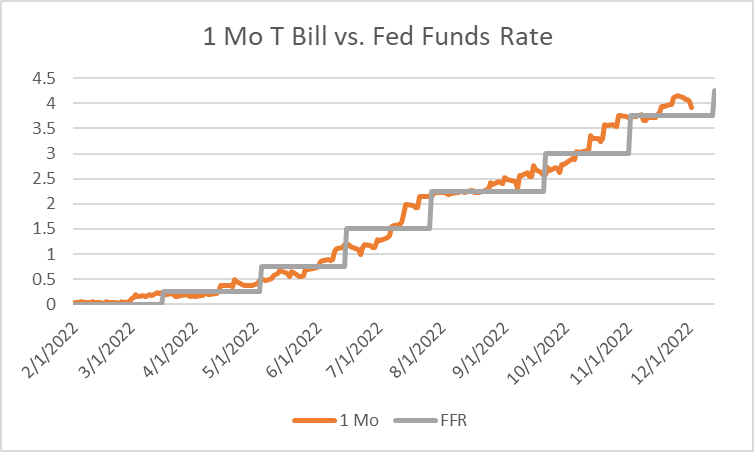
The next chart shows the progression of the Yield Curve since the beginning of the Fed rate hikes in March. As the short-term rates increased, the curves rose and flattened. Now note the Green line, which is the curve as of last Friday – little change in the rates from 1-month to 1-year, but a meaningful pull back in longer rates. The market is calling an “all clear” – expecting these nasty high rates to decline next year (even as the rates now are close to the average of the past century).
U,S, Treasury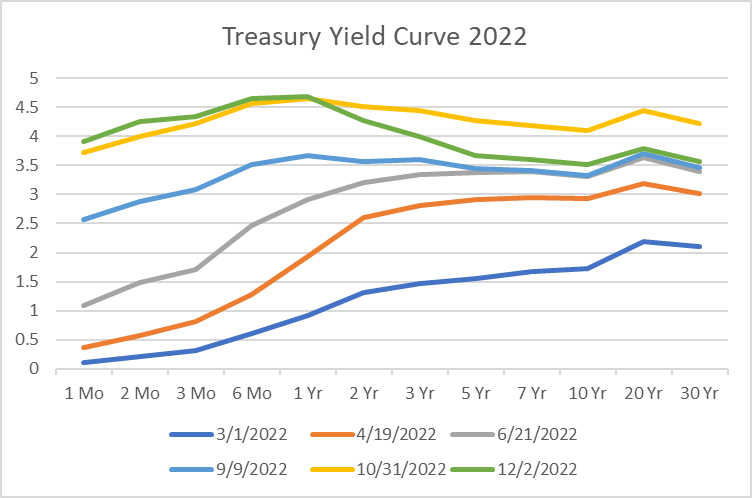
The Yield Curve has been inverted for several months. The recent move in longer rates has accelerated the inversion as can be seen in the next chart.
U.S. Treasury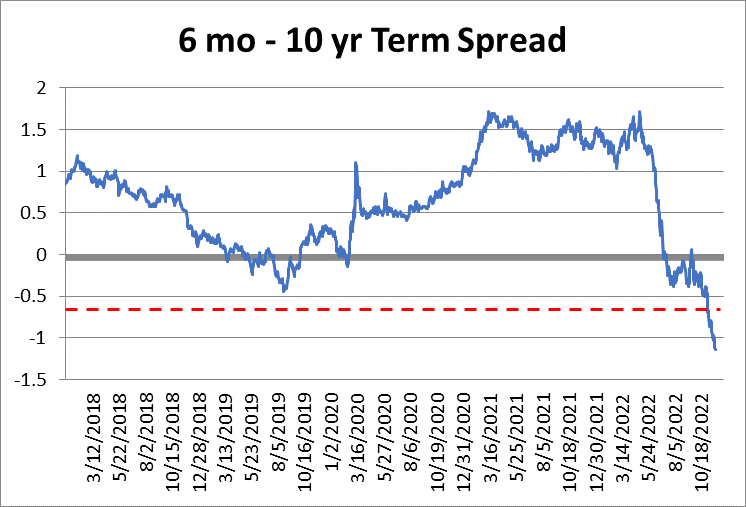
So, back to the question raised earlier – which gap will be filled first – the one above where we are now, or the one below where we are now?
Anything is possible in the short-term – over the next two months. History says that it is quite probable for the market to be higher at the end of the year given the track record of the October-December period and this being a mid-term election year. But note in the first graph that we are still in a market downtrend, and we are on the back side of a recent short-cycle rise, and follow through to the downside is probable. The Fed has been signalling that they will raise rates again next week which would be a negative to the market. None of this looks good for filling the higher gap.
If we extend our view outward, the Yield Curve inversion has been a reliable predictor of the future. This level of inversion has preceded recessions and large downslides in the stock market. Historically these bad behaviors have begun several quarters to more than a year after the inversion.
Thus, the inversion is NOT telling us that the bear is over and the bull is beginning as we are hearing some investment managers say this week. This implies that we have a long way to go before the next true long-term bull market period begins.
This does not mean that we will not see opportunities to grab gains over the next year. Active investors will have more opportunities to play the 3-5 month cycles that occur in bear and bull markets. Unfortunately, most individual “investors” are passively saving money in 401(k)s or like-kind accounts that they don’t trade, so are at the whims of the longer economic cycle that may see a continued downtrend.
Be the first to comment