

cagkansayin
Buy bonds, sell stocks
The past 12 months has been nearly the worst in history for a portfolio consisting of both bonds and stocks. Unfortunately, given the infatuation with the 60/40 portfolio among pension funds and financial advisors, many have suffered accordingly.
Whilst it was known that bonds were unlikely to act as the hedge to the 60/40 portfolio’s stocks during times of heightened inflation, we may be entering a brief period where bonds are set to once again offer the diversification potential so sought after in recent times. In fact, it would not be so outlandish of me to say bonds are now a better buy than stocks.
Though the secular bull market in bonds is likely over and despite the incredible returns and diversification benefits provided by US Treasuries during the past few decades, when compared to stocks their performance has been mediocre.
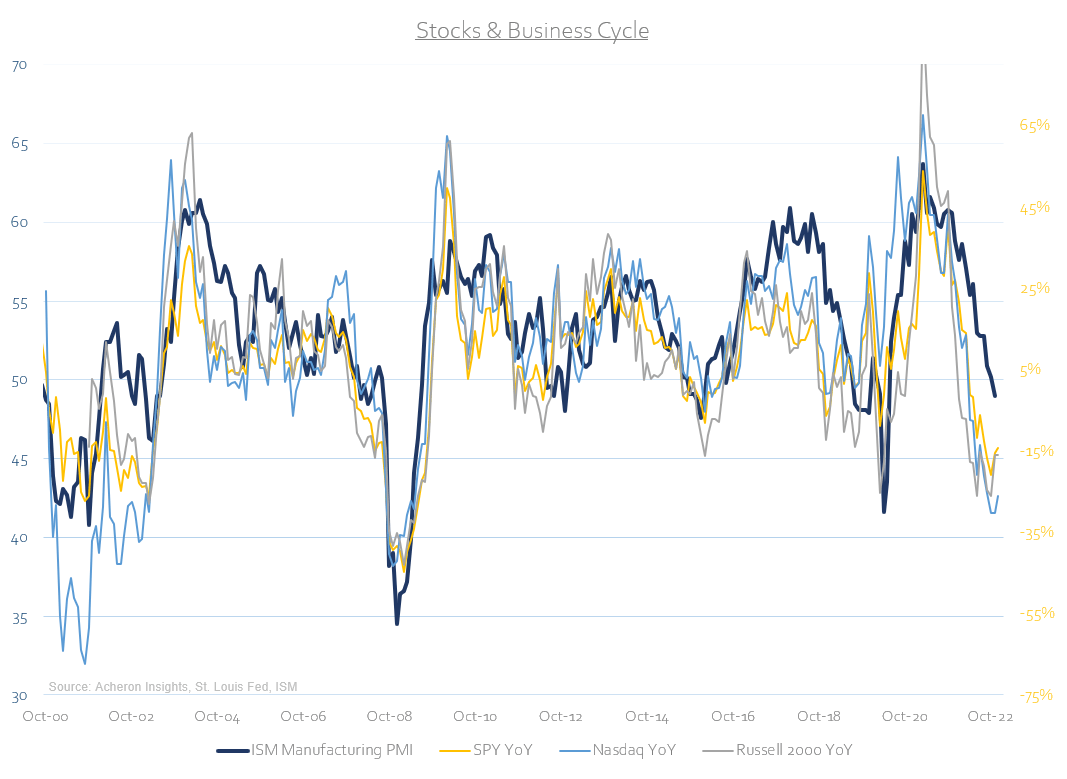
This is perhaps more representative of how favourable the monetary and liquidity conditions have been for stocks in recent times, a dynamic particularly evident during 2020 and 2021.
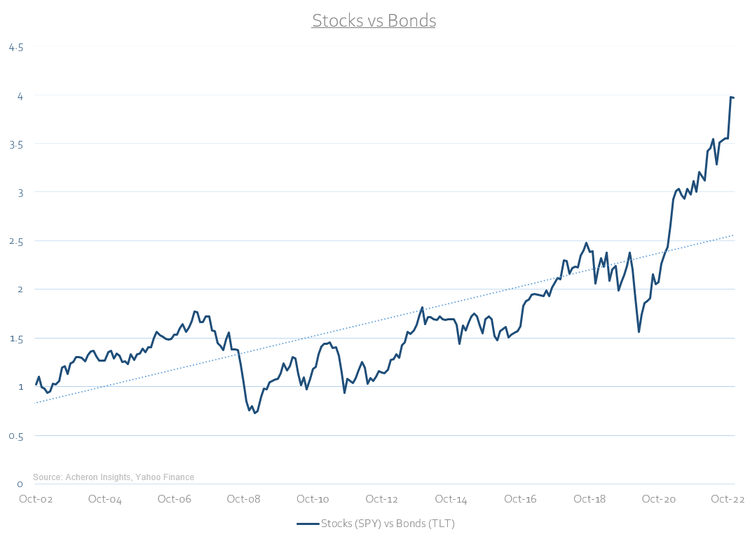
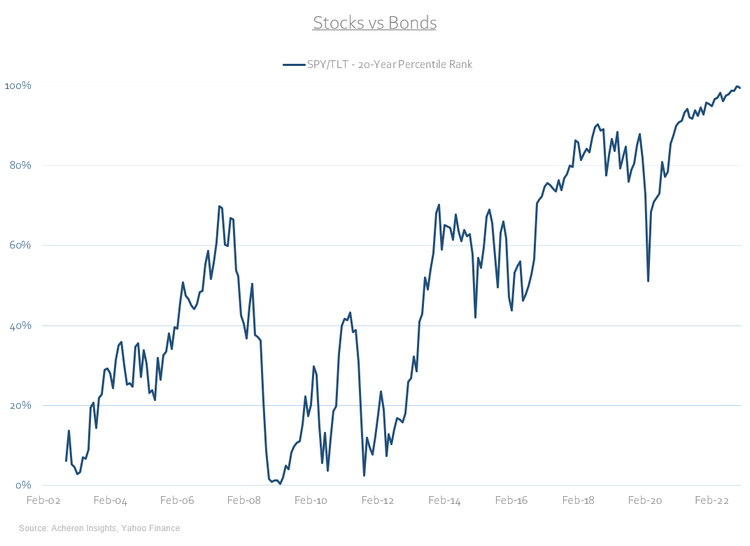
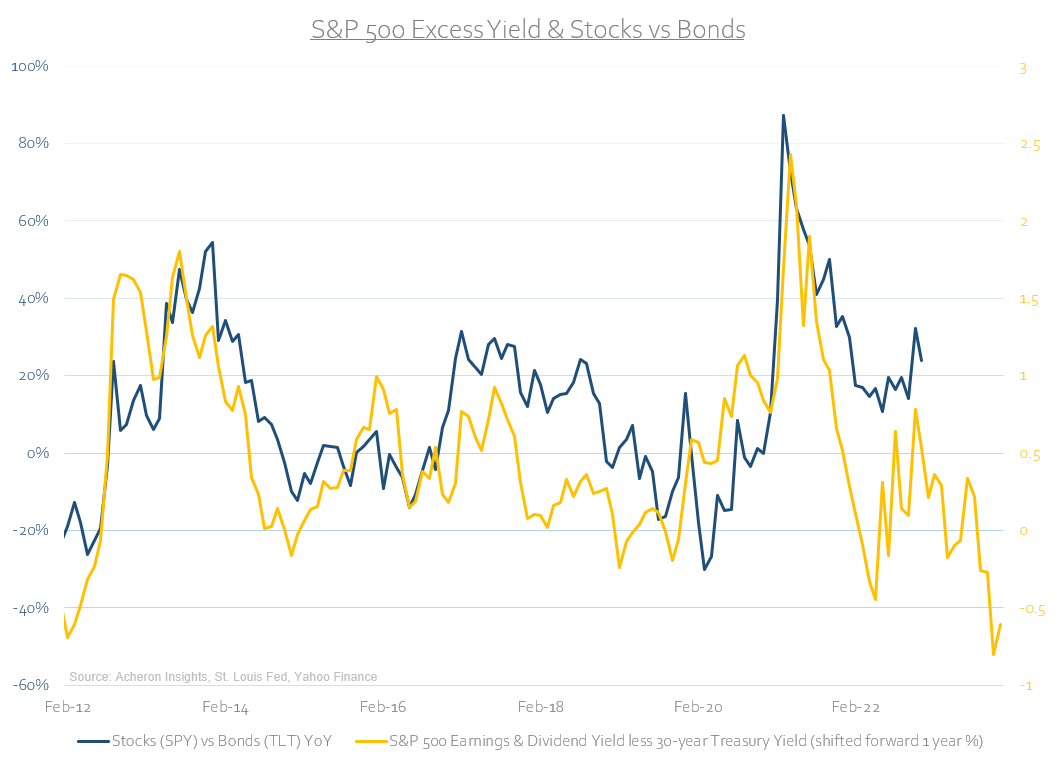
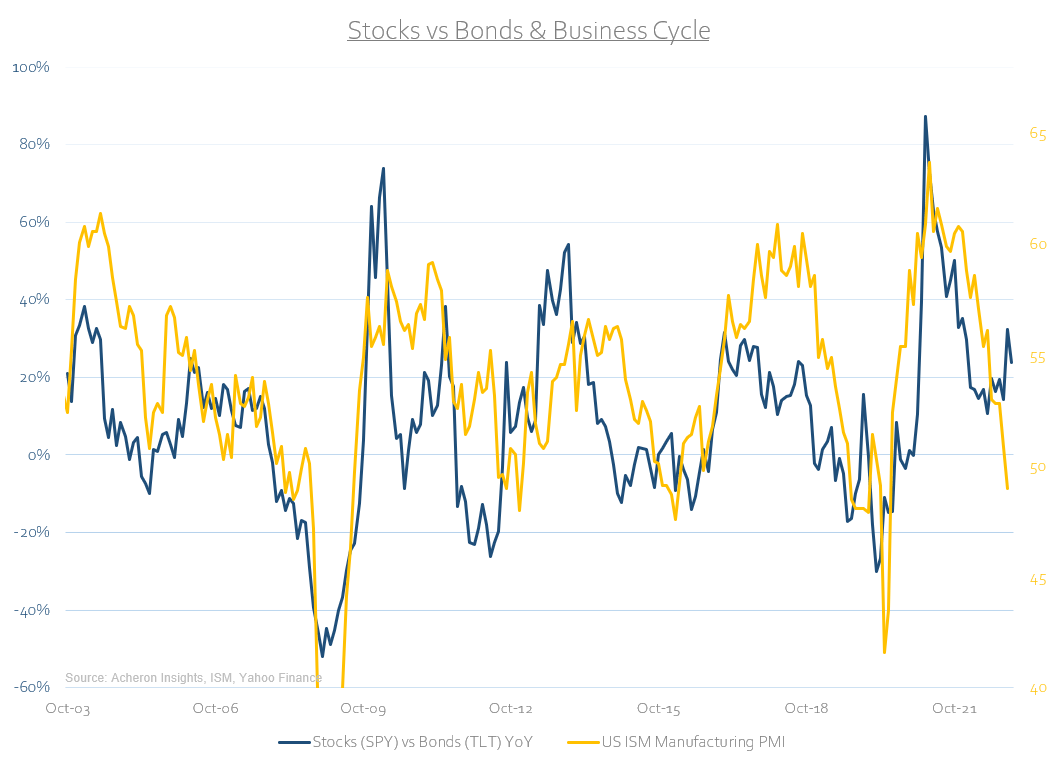
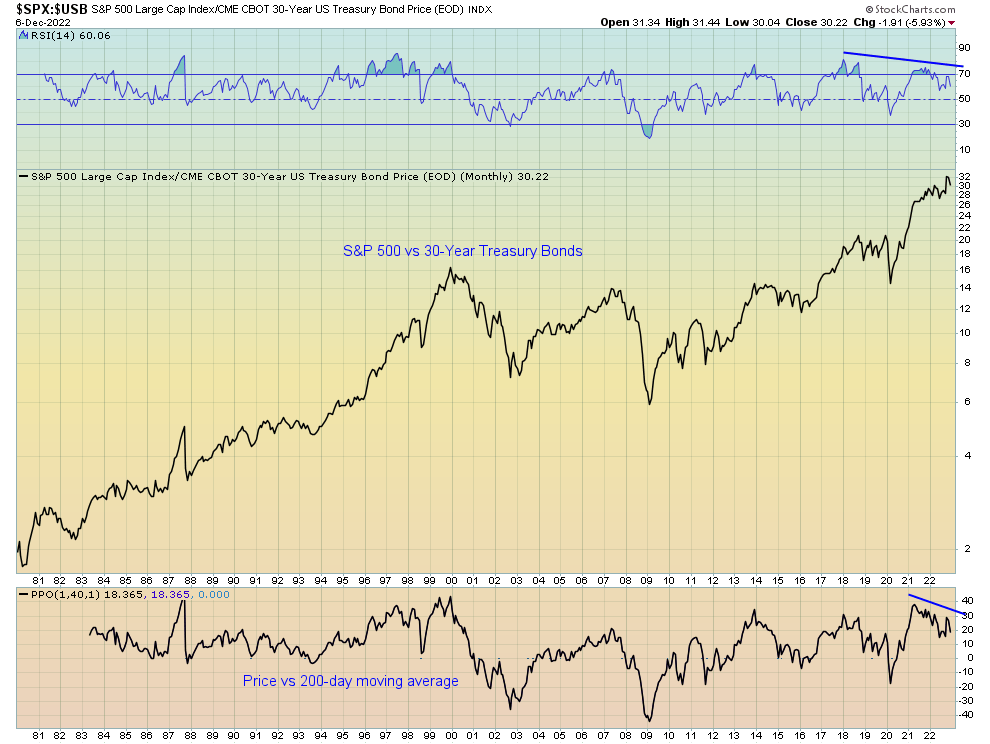
On a relative basis, stocks are nearly the most overbought compared to bonds in history, and over the past two decades, the relative performance of the S&P 500 ETF (SPY) relative to the long-term US Treasury ETF (TLT) is in the 100th percentile.
Importantly, not only are stocks overbought versus bonds, they are also overvalued.
Indeed, when we compare the relative yield on the 10-year Treasury Note to both the S&P 500’s dividend yield and cyclically-adjusted earnings yield on a 3-year Z-Score basis, stocks have reached overvalued territory versus bonds.
The last two times these relative valuations measures reached such extremes were in 2007 and 2018, both of which preceded a period of bond outperformance to the tune of 40-60% versus stocks.
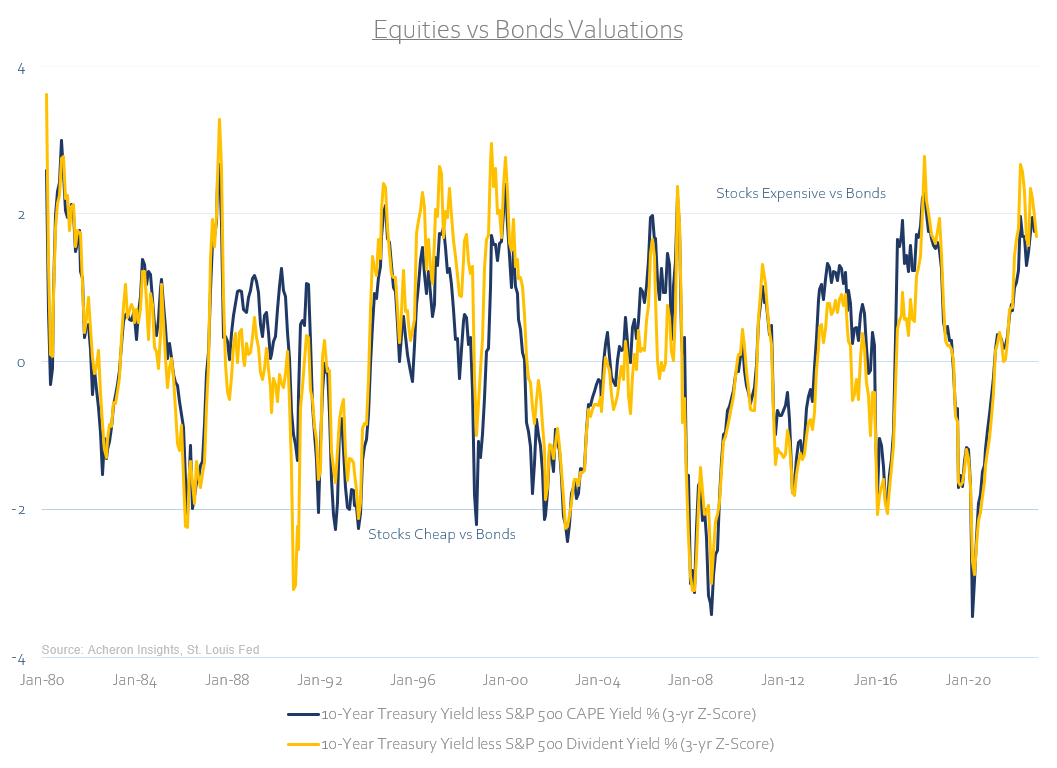
Even if we were to extend this analysis back 100+ years, bonds have rarely been this undervalued on a relative basis to stocks. Again, such relative valuation dispersions tend to precede periods of cyclical outperformance of bonds versus stocks, as we can see below. I do not expect this time to be different.
Growth and liquidity favour bonds over stocks
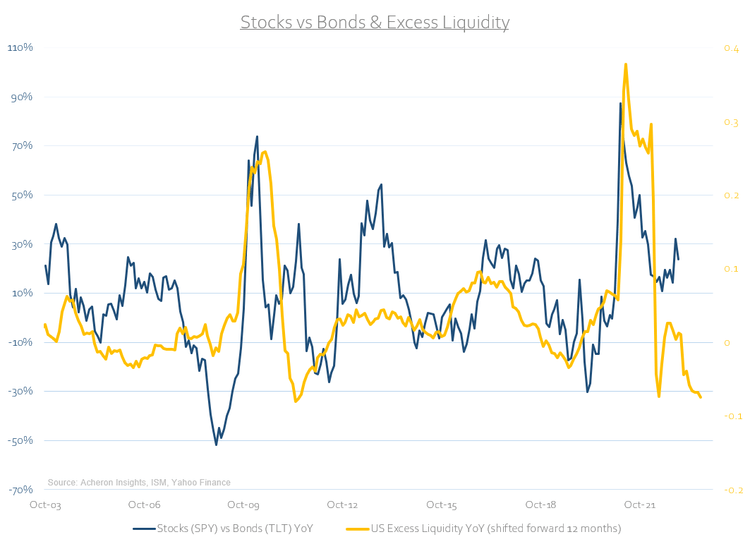
It is not just from a relative valuation perspective but from a business cycle and liquidity cycle perspective also suggesting one should overweight bonds and underweight stocks. As it stands, the growth and liquidity cycles are tailwinds for bonds and headwinds for stocks over the next year or so.
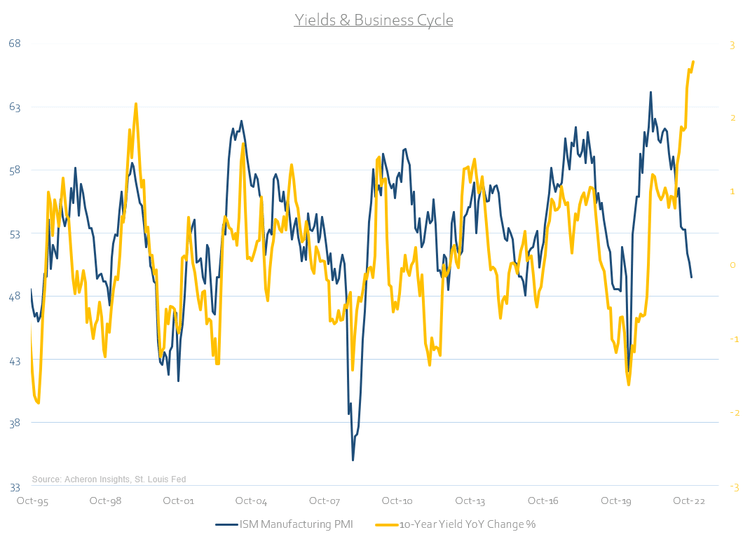
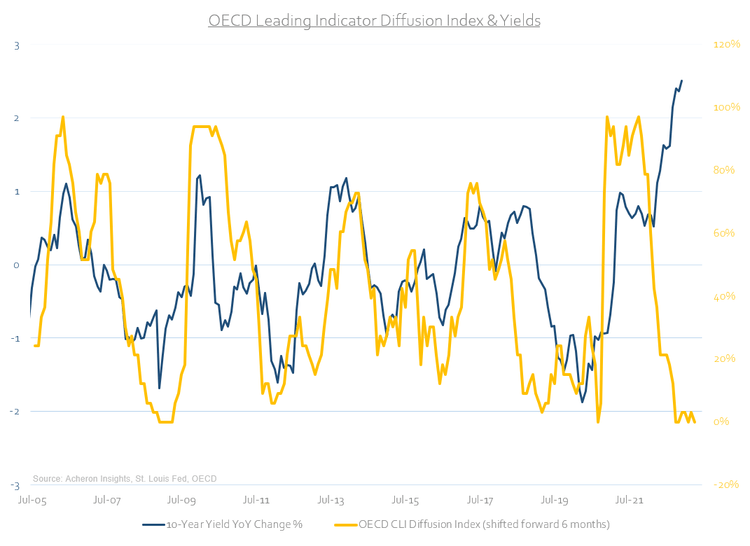
Just recently I detailed my premise for why bonds are undervalued from a business cycle perspective (which can be found here and I encourage you to read). Not only have yields diverged from economic reality, but the leading indicators of economic growth suggest they are set to fall.
Although inflation is likely to remain at a higher level on average over the coming years, inflation is set to decline materially in the months ahead. When both inflation and growth decelerate in unison, bonds generally respond well.
They may not be the home run they once were during cyclical downturns, but they generally react to declines in both growth and inflation better than stocks.
This relative reaction functions of both bonds and stocks to growth and inflation movements is illustrated below per the excellent work of AQR Capital Management.
Source: AQR Capital Management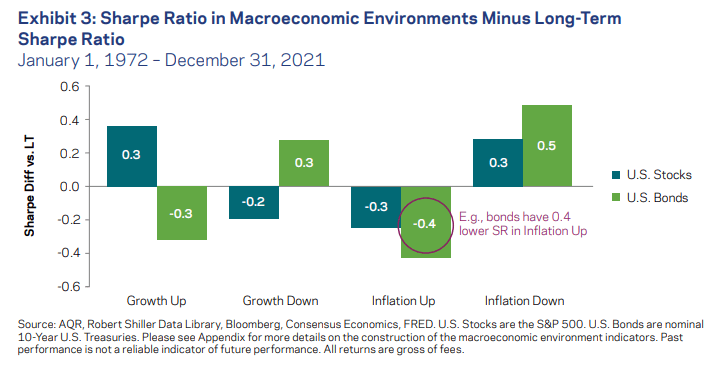
To be sure, the stock market has done a solid job at pricing in the cyclical (and perhaps recessionary) slowdown facing markets, but, given the outlook for the liquidity and growth cycles, there is little justification to overweight stocks at this point in time.
It is bonds that offer far greater value from a business cycle perspective.
And from a liquidity cycle perspective.
Even from a technical perspective, stocks are overbought versus bonds. As we can see below, the latest highs in the stock/bond ratio have come on significant bearish divergences in both RSI and momentum (per the price versus the 200-day moving average). Such significant momentum divergences tend to be indicative of trend exhaustion and precede turning points in price action.
Unfortunately for the stock market, and I am talking about the broad market as a whole here, the outlook remains questionable from a cyclical perspective. Earnings and bottom-up earnings estimates are yet to adjust to reflect the growth cycle outlook facing stocks in 2023.
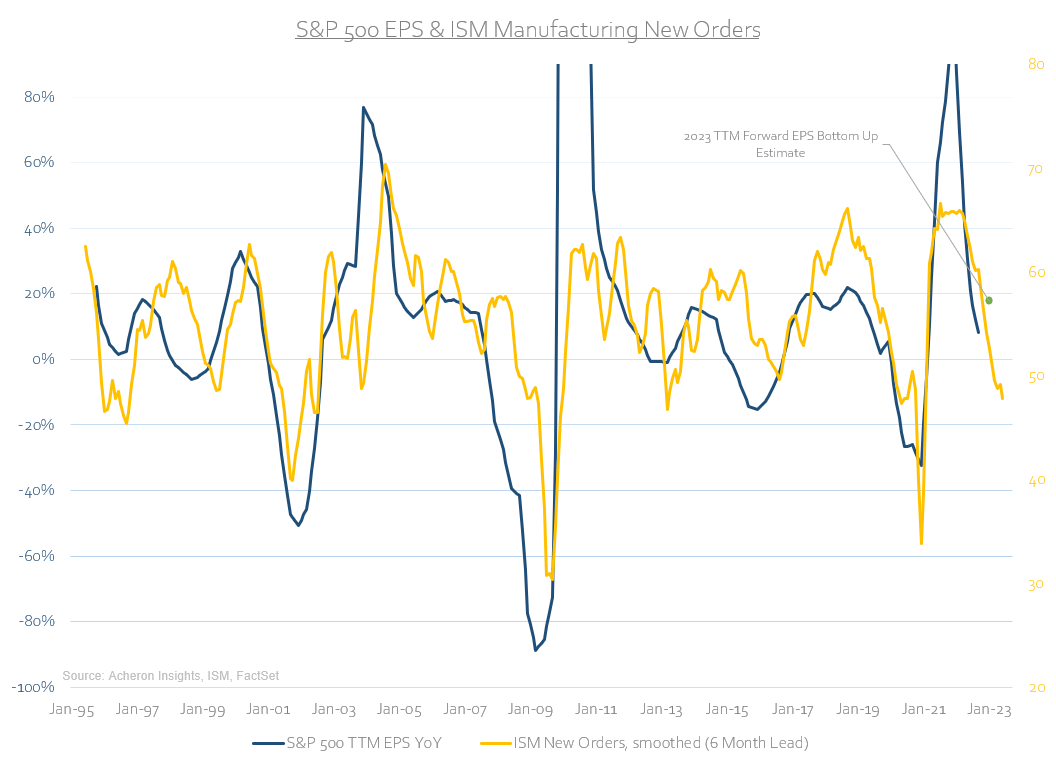
This becomes increasingly apparent when we consider the fact that profit margins are to yet account for the significant increase in labour costs over the past year. Earnings and profit margins will need to adjust lower at some point next year.
Source: John Hussman, Hussman Investment Trust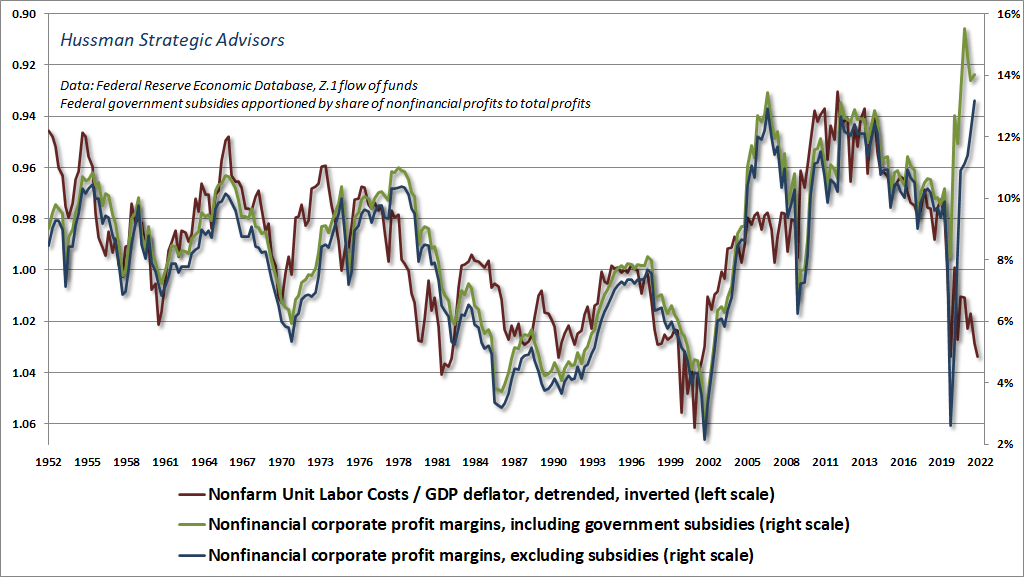
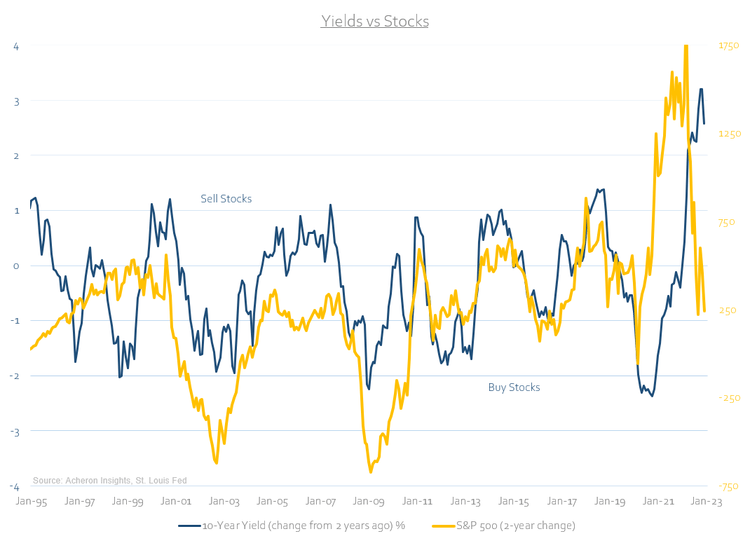
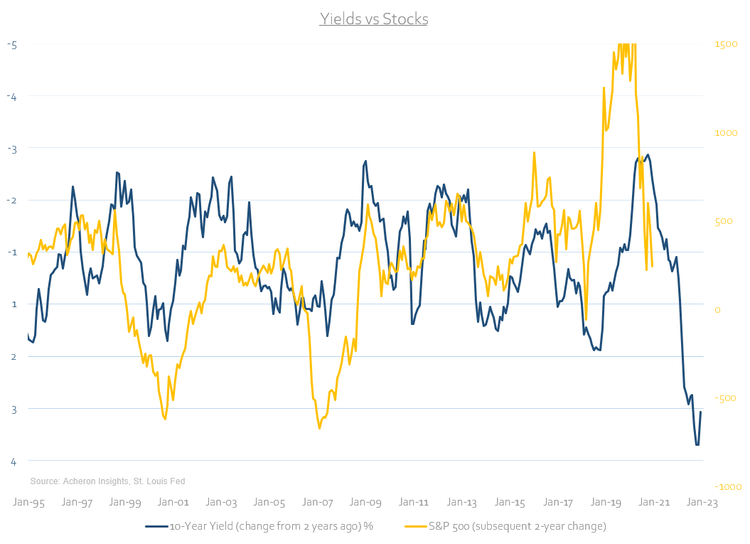
One metric I use to guide my asset allocation toward equities is the two-year change in yields. This is a simple yet effective metric championed by macro hedge fund manager Alex Gurevich.
If the two-year change in the 10-year Treasury yield is positive (i.e. rates are higher than they were two years ago), then you underweight stocks, and if the two-year change in yields is negative, then you overweight stocks. Sometimes it’s best just to keep things simple.
As we can see below, yields today remain at significantly higher levels than where they were two years ago. If history is any guide and despite the significant correction in stocks this year, we are not at a stage where overweighting equities is the right move.
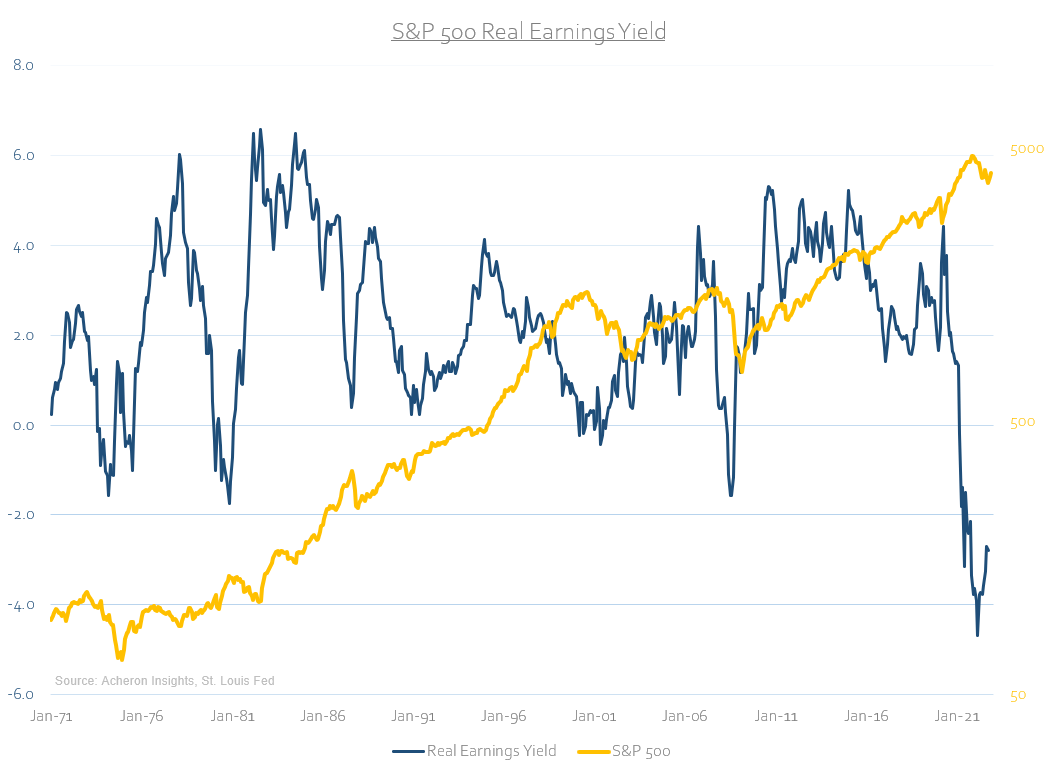
In a similar manner, the S&P 500 real earnings yield bodes poorly for stocks over the coming quarters. Again, using this metric to guide your stock market asset allocation process generally bodes well.
When the real earnings yield is positive, you overweight stocks. When it is negative, you underweight stocks. The real earnings yield remains significantly negative at present.
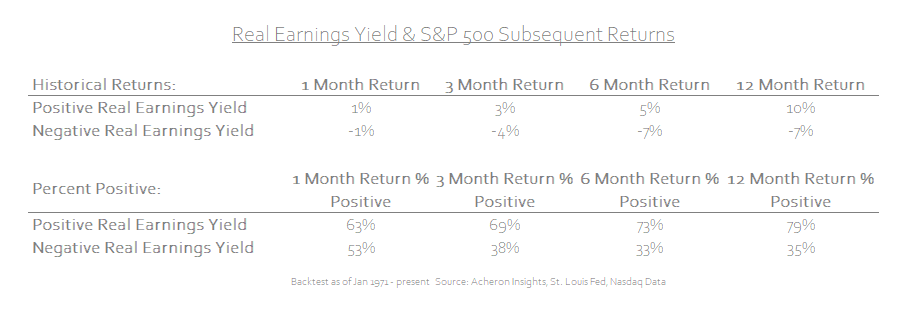
Such metrics are of course not foolproof, but using simple measures to guide your stock market allocations has historically served well as the risk versus reward over the subsequent 12 months is clear.
I would rather overweight stocks when there is a 79% historical chance of positive returns over the next 12 months versus a 35% chance. Buying the S&P 500 index at a time when its real earnings yield was negative has historically not been a productive use of one’s capital.
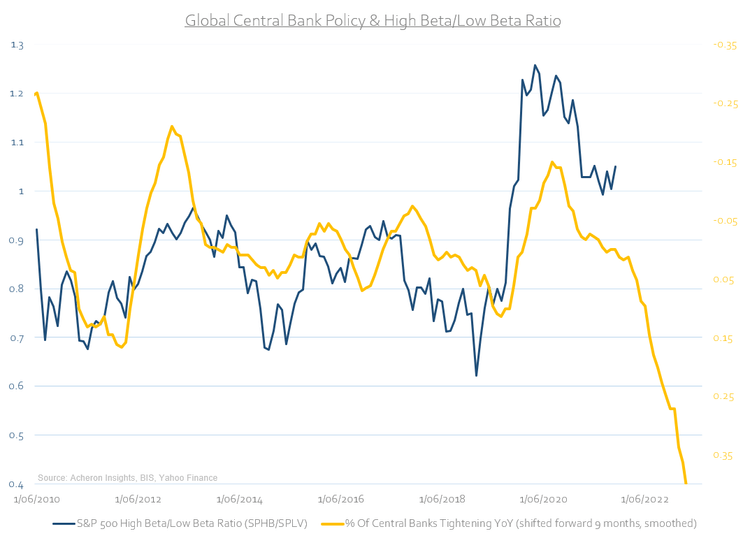
Nowhere is this more apparent today than in the high-beta areas of the market. The high-beta/low-beta ratio is an excellent measure of the movements in ultra-risk assets such as crypto, and everything else down the furthest points of the risk curve. As we can see below, liquidity and financial conditions do not favour such risk seeking behaviour at this point in time.
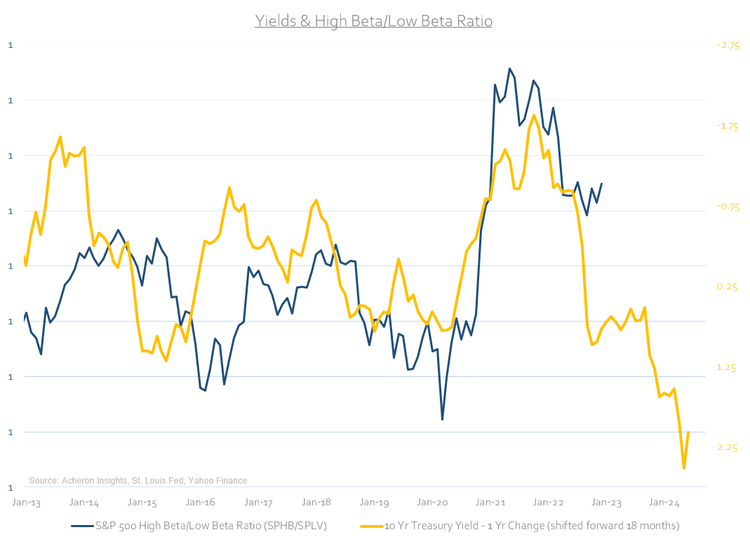
Clearly, higher yields are destroying the TINA trade. There is now an alternative to stocks. When Uncle Sam is offering you upwards of 3.5-4% on the short end of the Treasury curve, there is little need for institutions and investors to take on the high-risk, levered, yield-enhancing investments in order to eke out an additional percent or two return. The game has changed.
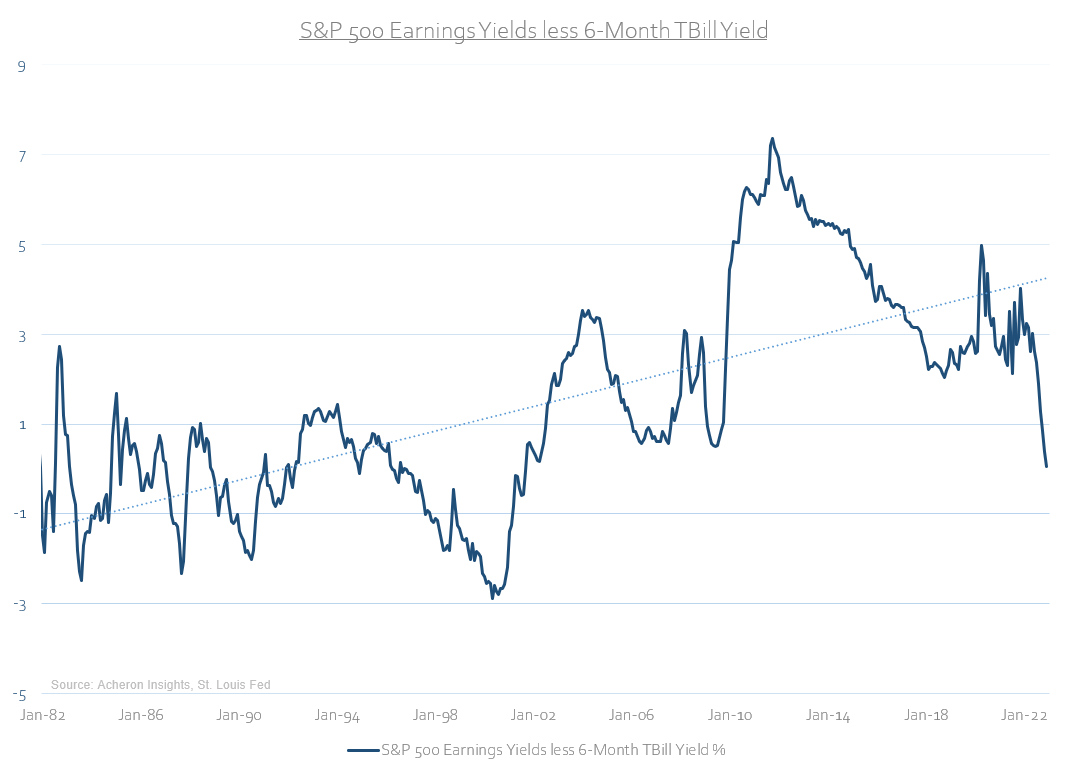
Underweighting risk and positioning your portfolio in a defensive nature is no longer the drag on returns that it has been over the past decade-plus. If we compare the yield offered by the six-month US T-Bill relative to the S&P 500 earnings yield for example, we can see how attractive such yields are relative to what has been on offer over the past decade. You can now be paid to wait.
This dynamic was highlighted by BlackRock President Rob Kapito during the company’s latest earnings call. He simply highlighted the fact that over the past couple of decades, ultra-low interest rates have resulted in asset managers needing to have a significant allocation to leverage, alternatives, growth and illiquid assets in order to meet their nominal 7.5% return targets.
Asset allocators had no choice but to go all-in on risk, all the while being supported by loose financial conditions and easy monetary policy. Now, with yields offering what they are, there is simply no need for all that additional risk and leverage associated with the TINA trade.
As these institutional asset pools slowly de-risk, flows out of high-beta assets into Treasuries will only continue over the coming years. Asset managers are learning to love Treasury bonds again.
In this environment, a broad allocation to stocks will not serve you as well as it has previously. From a cyclical perspective, bonds might just do alright. Buy bonds, sell stocks.
Editor’s Note: The summary bullets for this article were chosen by Seeking Alpha editors.
Be the first to comment