

shapecharge
There has been a significant improvement in the inflation fundamentals in recent weeks. Even though I expect reported inflation to remain uncomfortably high through at least the end of this year, it’s becoming clear, on the margin, that the inflation dynamics are improving for the better.
It all began earlier this year when the M2 numbers began to show a significant slowdown, a development I have highlighted at length in previous posts. It’s now pretty clear that the surge in M2 was a one-off phenomenon, fueled primarily by a monetization of multi-trillion-dollar-deficits which began in 2020 and continued through at least the third quarter of last year. Since then the federal deficit has plunged and M2 growth has gone flat. The thing that was driving inflation on the margin was money printing designed to enhance the “stimulus” of government handouts, and that has ground to a halt. That’s great news, but the lags between money and inflation are “long and variable,” according to Milton Friedman.
There’s still a lot of inflation in the pipeline which will be showing up in coming months and quarters, even though the source of rising inflation has been all but extinguished. Soaring housing prices in recent years are now boosting rents, and will do so for at least the rest of this year; rents comprise about 30% of the CPI. Wages and salaries are rising, but they are likely to keep ratcheting up until the economy eventually adjusts to a new, lower-inflation equilibrium, and wages invariably lag rising prices. Energy prices have turned down in a big way in the past month, but lots of other prices are still moving up to offset increased energy costs that were created months ago. Commodity prices are plunging of late, but it will take months before commodity-derived products begin to reflect those lower input costs. And don’t forget monthly social security payments, which are due to increase by a significant amount early next year based on the recorded inflation this year, which could well be more than the 5.9% adjustment that was made to 2022 payments. Think of this as “inflation momentum” which will take time to dissipate.
The market is now beginning to look across the valley of still-high inflation this year to the other side when inflation news will start improving. Markets are good at reading the inflation tea leaves; if only politicians were so smart.
So here are the inflation tea leaves that most impress me, and which can only be the result of a sharp moderation in the growth of M2 money. Taken together, these developments are the polar opposite of what you would expect to see if the Fed were making a too-loose mistake.
Chart #1
Chart #1 compares the level of the dollar (inverted) to an inflation-adjusted index of non-energy commodity prices. A strong dollar has almost always coincided with weak commodity prices, but we saw just the opposite in the past two years. Now, rather suddenly, commodity prices are diving, responding in a more typical fashion to the fact that the dollar is quite strong these days. Copper prices are down 30% from their high earlier this month, reversing about half of what it gained over the past two years. “Dr. Copper” is famous for reflecting changes in underlying economic and financial fundamentals.
Chart #2
I first created Chart #2 about 40 years ago, and I have been updating it ever since. It’s done a pretty good job, over the years, of comparing actual currency values to their “fair value” which is otherwise called purchasing power parity. If my estimates are correct, a dollar spent in Europe at the exchange rate of $1.02 per euro buys roughly 15% more stuff than it does in the U.S. We leave soon for 2 weeks in Italy, and I’ll have a chance to test whether my calculations of PPP are correct.
The larger story is that a strong dollar means the world’s demand for dollars is very strong, and that is helping to soak up all the extra M2 that was printed in prior years.
Chart #3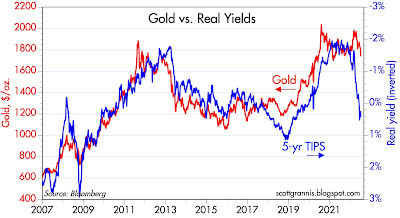
I commented frequently in the past year or so that gold was not moving higher on news that inflation was exceeding expectations because gold rose in anticipation of higher inflation today years ago. The recent weakness in gold is thus best interpreted as the gold market anticipating lower inflation in the years to come.
Chart #4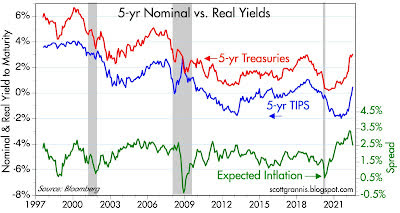
Thanks to the introduction of TIPS (Treasury Inflation-Protected Securities) in 1997, we have a direct reading of the bond market’s inflation expectations for coming years. It’s called the Breakeven Inflation rate, or the rate which will make you indifferent to holding nominal T-bonds or TIPS (and calculated simply by subtracting real rates from nominal rates). The bond market now expects the CPI to average 2.5% a year over the next 5 years, and that’s down sharply from an all-time high of 3.6% registered in mid-June. Wow.
Consistent with the improvement in the outlook for inflation contained in these charts, the bond market has adjusted downwards, by a whopping 100 bps, its expectation of the Fed’s target rate at the end of 2023 (was 4%, now 3%).
All good news, of course, especially since it means the risk of recession (typically brought on by a punishingly tight Fed) is likely lower than the broader market thinks. And it’s a clear message to the Fed that they needn’t (and definitely shouldn’t) panic and raise rates too much or too fast.
Editor’s Note: The summary bullets for this article were chosen by Seeking Alpha editors.
Be the first to comment