


If you see these cats named MH.PA, MH.PC, or MH.PD, go ahead and take them in. They’re valuable.
kelvinjay/iStock via Getty Images
Investment Thesis
The preferred shares of Maiden Holdings have been abandoned due to the dividend suspension in 2018. The company initiated a strategic review and has been in a turnaround since 2018. One part of their new strategy has been aggressively repurchasing the preferred shares at a discount to par value on the market. The company owns nearly 75% of the preferreds at this point and likely will seek to buy the rest in the coming year.
With stock equity / preferred equity coverage greater today than it has ever been the preferred shares are trading at a clear discount to fair value. The three trade at an average price of $3.10 with par value of $25.00. I argue they have fair value of at least $11.67 – the average repurchase price of preferreds so far by management. Implied return in this case would be 274%.
Even in an extreme situation similar to 2018 where the company saw book value decrease 88%, liquidation value of the preferreds would still be covered by equity value at current prices.
Maiden Holdings Business History And Overview
Maiden Holdings (NASDAQ:MHLD) historically focused on serving the needs of regional and specialty insurers in the United States, Europe, and select other global markets prior to turnaround efforts launched in 2018. They wrote auto and life insurance for retail customers in the EU as well as reinsurance programs.
Results for 2018 were abysmal with a net loss of $124m driven by a $160m underwriting loss. President and CEO of the time Art Raschbaum soon after retired for “personal reasons” and Lawrence Metz was promoted to these positions. Metz has been with the company since 2009 and was serving as General Counsel and Secretary just prior.
Along with Raschbaum the company’s CFO also retired and the boss of its reinsurance operations Patrick Haveron was promoted to the position. By 2020 Haveron was promoted again to co-CEO alongside Metz with Chairman Barry Zyskind saying, “Today’s announcement recognises the significant contributions that [Haveron] has made, not only since that time but over the course of his career at Maiden.” That career also started in 2009, same as Metz.
The turnaround efforts have focused on a three-pronged strategy meant to leverage the company’s expertise in specialty insurance and reinsurance.
-
Asset management – investing in assets and asset classes in a prudent but expansive manner in order to maximize investment returns and is principally enabled by limiting the amount of insurance risk we assume in relation to the assets we hold and maintaining required regulatory capital at very strong levels to manage our aggregate risk profile;
-
Legacy underwriting – judiciously building a portfolio of legacy run-off acquisitions and retroactive reinsurance transactions which we believe will produce attractive underwriting returns; and
-
Capital management – effectively managing the capital we hold on our balance sheet and when appropriate, repurchasing securities or returning capital to enhance common shareholder returns.
Amongst these three pillars management evaluates the risk-reward potential against the cost of their debt at a weighted average interest rate of 7.6%. Here’s their portfolio as of Q2’22.
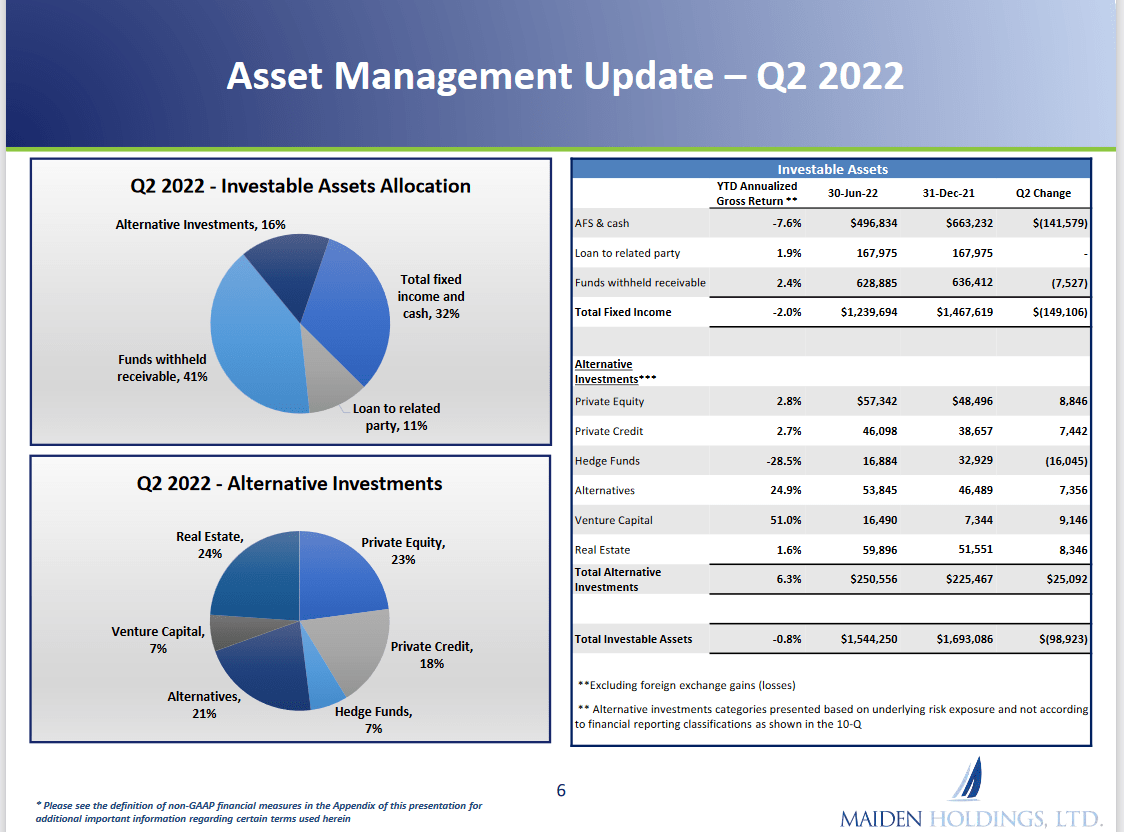
Q2’22 Investment Portfolio
From this we can see that YTD returns of -0.8% are not managing their 7.6% hurdle. Of note though is that $328.5m (21.3%) of the portfolio is invested in floating rate securities which should benefit from rising interest rates.
The company also reports along two operating segments: Diversified Reinsurance and AmTrust Reinsurance. The Diversified Reinsurance segment consists of a portfolio of predominantly property and casualty reinsurance business focusing on regional and specialty property and casualty insurance companies located primarily in Europe. This segment includes an operating business formed in November 2020 called Genesis Legacy Solutions (GLS). As stated in their filings the company:
specializes in providing a full range of legacy services to small insurance entities, particularly those in run-off or with blocks of reserves that are no longer core, working with clients to develop and implement finality solutions including acquiring entire companies that enable our clients to meet their capital and risk management objectives. We acquire legacy liabilities and (re)insurance reserves from companies and provide retroactive reinsurance coverage for portfolios of (re)insurance business, primarily via loss portfolio transfer contracts (“LPT”). Additionally, we provide reinsurance contracts to other (re)insurers to mitigate some of their risk of future adverse development (an adverse development cover, or “ADC”) on insurance risks relating to prior accident years.
By 6/30/2022 GLS had already established $40m in insurance liabilities and is expected to continue growing.
The AmTrust Reinsurance segment represents all business ceded to Maiden Holdings by AmTrust. The two companies have a tight relationship as Chairman Barry Zyskind runs AmTrust and founded Maiden. Much of the underwriting loss in 2018 was related to AmTrust insurance liabilities.
A Bermuda-based paper, The Royal Gazette, featured a March 2019 story which highlighted how AmTrust affiliates created Maiden to offload risk onto. Which they did, causing the 2018 results. Here are the relevant passages:
Doing a bit of digging, we find that Maiden Holdings and its sister company, AmTrust, Inc were founded by the Karfunkel family, a couple of brothers who began their less than illustrious careers by being sanctioned by the SEC in 1971 for selling unregistered securities, among other things. After re-entering the business, they started AmTrust, Inc in 1998, a once fast-growing insurance company which won over the analyst community by posting impressive growth, largely by gobbling up smaller players in the industry. The current CEO of AmTrust is one Barry Zyskind who was also a director of Maiden.
The Karfunkels created Maiden Holdings in Bermuda as a sort of captive reinsurance vehicle and a way to lay off mounting claims risk. Underpriced insurance policies from AmTrust were reinsured by Maiden giving AmTrust a competitive advantage, until it blew up. With Mr Zyskind having a hand in both operations, it was a perfect set up.
The extent of these losses has become quite evident over the past several months with Maiden continuing a long string of deeply negative earnings reports. For example, in the latest quarter, the company reported an operating loss of about $235 million, or $2.83 per share, quite staggering considering the current market value of the company is only about $100 million and the company’s book value is just around $300 million according to Bloomberg data. Maiden stock has been steadily declining for some time and more recently the company eliminated dividends on both the common and preferred shares. The vast majority of the earnings debacle was due to adverse loss development in the AmTrust reinsurance segment.
While I believe this represents additional risk in the company, my thesis centers around the preferreds which are more secure in the capital stack. And management seems incentivized to eliminate the preferreds.
Over the last two quarters management has been highlighting reduced expenses. In Q1 expenses were down 21% YoY; in Q2 they were down 18.1% YoY. Additionally management has been working to unlock the value of $1.27 per share in net deferred tax assets which is not on the balance sheet. They’ve been saying quarter after quarter that they believe evidence of performance is building which would allow full realization of the tax asset. For a company with book value per share of $2.62 this is material to them moving forward. If the company is able to generate further profits these will be leveraged by not having to pay taxes.
Maiden Holdings Preferred Shares
Maiden Holdings has three preferred securities all of which seem to be trading at a discount to their fair value. Consider that each of the preferred shares have a par value of $25.00.
|
Ticker |
Current Price |
|
NYSE:MH.PA |
$3.38 |
|
NYSE:MH.PC |
$2.94 |
|
NYSE:MH.PD |
$3.04 |
|
Preferred Average Price |
$3.12 |
Since Q1’21 or for the last six quarters the company has been repurchasing the preferred shares aggressively. As of their Q2’22 investor presentation they owned 74.3% of all the preferred shares combined.
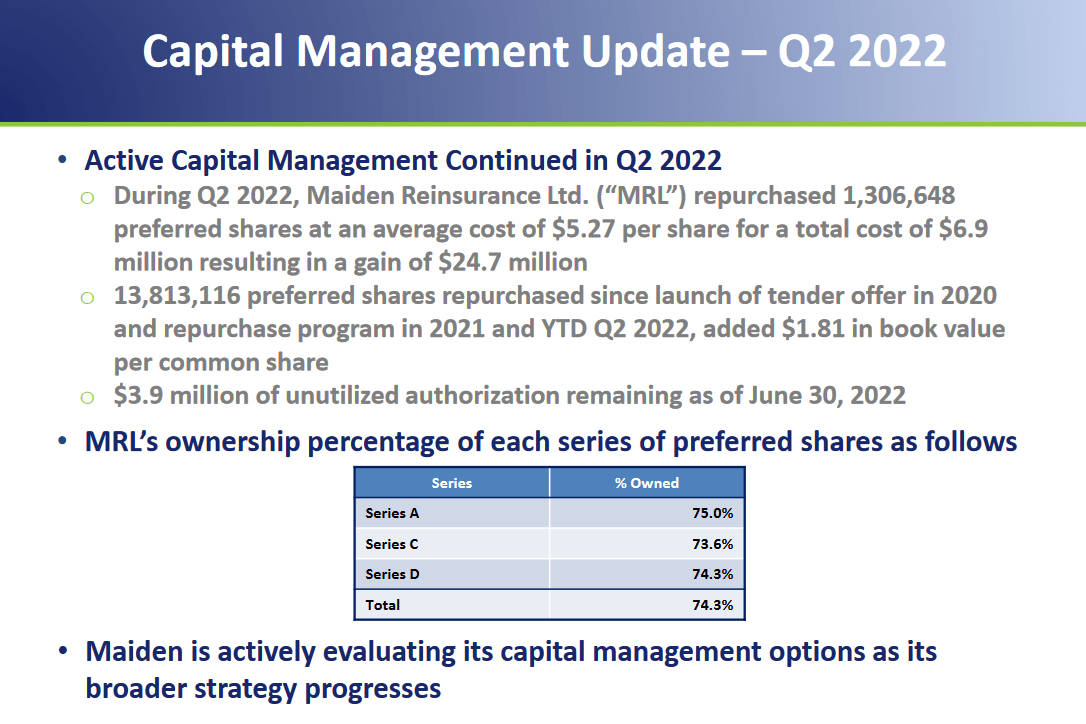
Q2’22 Investor Presentation: Highlights of Preferred Repurchases
The result is that the carrying value of the preferreds on the balance sheet has decreased from $228.948m in Q1’21 to $119.672m in Q2’22. That’s a 47.73% decline which has helped drive a 15.48% increase in stock equity during the same time. Here’s a table with the relevant data.
|
Q1 2021 |
Q2 2021 |
Q3 2021 |
Q4 2021 |
Q1 2022 |
Q2 2022 |
% Change |
|
|
Cash and Cash Equivalents |
78,116,000 |
42,109,000 |
29,310,000 |
26,668,000 |
36,975,000 |
37,766,000 |
-51.65% |
|
Debt |
255,180,000 |
255,236,000 |
255,292,000 |
255,347,000 |
255,402,000 |
255,459,000 |
0.11% |
|
Total Equity |
426,611,000 |
404,212,000 |
383,174,000 |
384,257,000 |
367,665,000 |
347,933,000 |
-18.44% |
|
Preferred Stock |
228,948,000 |
181,384,000 |
167,418,000 |
159,210,000 |
152,338,000 |
119,672,000 |
-47.73% |
|
Stock Equity |
197,663,000 |
222,828,000 |
215,756,000 |
225,047,000 |
215,327,000 |
228,261,000 |
15.48% |
|
Stock Equity / Preferred Equity ((SE/PE)) |
0.863 |
1.228 |
1.289 |
1.414 |
1.413 |
2 |
120.93% |
What’s perhaps most notable about this change with regards to the preferreds is the stock equity / preferred equity ratio increasing 120.93%. That change means that stock equity of $228.261m now covers the value of the preferred by 2x. To me that reads as the preferred are more secure today than they were in Q1’21. But let’s look a little deeper over the last five years.
|
2017 |
2018 |
2019 |
2020 |
2021 |
% Change |
|
|
Cash and Cash Equivalents |
67,919,000 |
200,841,000 |
48,197,000 |
74,040,000 |
26,668,000 |
-60.74% |
|
Debt |
254,482,000 |
254,694,000 |
254,908,000 |
255,126,000 |
255,347,000 |
0.34% |
|
Total Equity |
1,232,626,000 |
554,916,000 |
507,718,000 |
527,816,000 |
384,257,000 |
-68.83% |
|
Preferred Stock |
465,000,000 |
465,000,000 |
465,000,000 |
394,310,000 |
159,210,000 |
-65.76% |
|
Stock Equity |
767,626,000 |
89,916,000 |
42,718,000 |
133,506,000 |
225,047,000 |
-70.68% |
|
Stock Equity / Preferred Equity ((SE/PE)) |
1.651 |
0.193 |
0.092 |
0.339 |
1.414 |
-14.37% |
From this data we can see that the current stock equity / preferred equity ratio of 2x is greater than it’s been in any time in the last five years. This includes the data from 2017 which is the year they reported losses per share of $2.32 for the year and a -24% decrease in book value to $9.25 at the time. When the stock equity / preferred equity ratio was 1.651x during that year we can see each of the preferreds traded above $20.00.
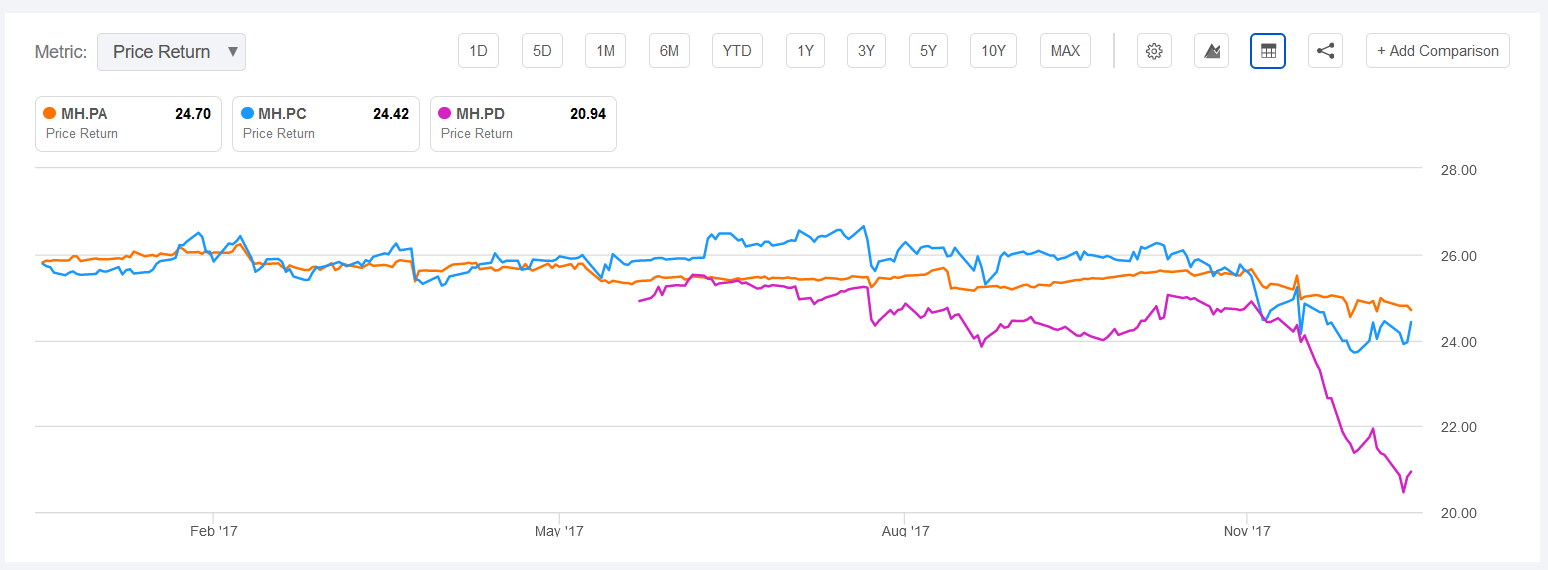
Seeking Alpha: MH Preferreds 2017 Price Chart
Even in 2018 when the SE/PE ratio ended at 0.193x the preferreds traded above levels they are at today. In fact, for most of the year the preferred traded above $15.00. That’s 381% above the current average preferred price of $3.12. Of note in this chart is it includes the dividend suspension date of December 1st, 2018. Dividends have not been paid since and the preferreds are non-cumulative.
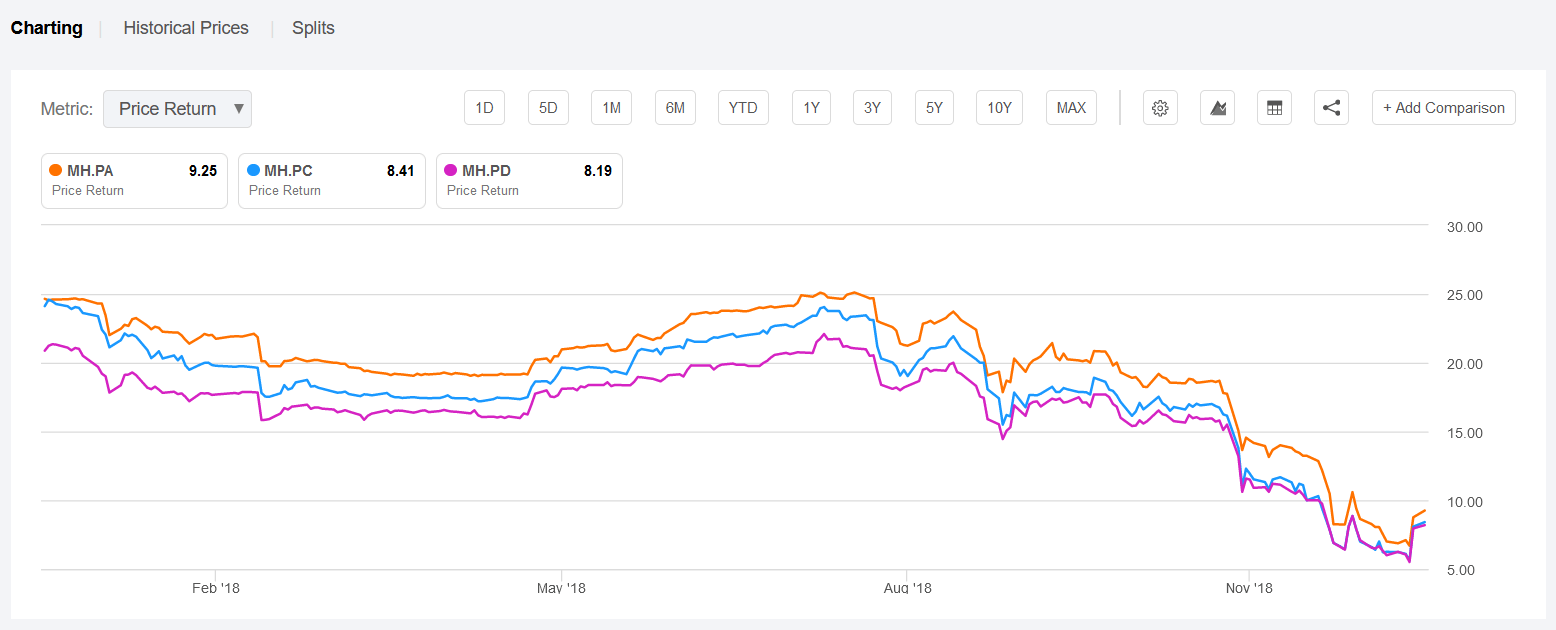
Seeking Alpha: MH Preferreds 2018 Price Chart
During 2018 management initiated a strategic review and has been amidst turnaround efforts since. This included former CEO Art Raschbaum stepping down and current co-CEO Lawrence Metz getting promoted to the position. If we consider that stock equity value has grown from $89.916m to $228.261m since 2018 that’s 153.86% growth or 38.47% annually. Compared to SPY returns over the same period of just 75.61% this reflects positively on the turnaround efforts.
Yet while this has been happening the price for the preferreds have dropped off a cliff, particularly this year.
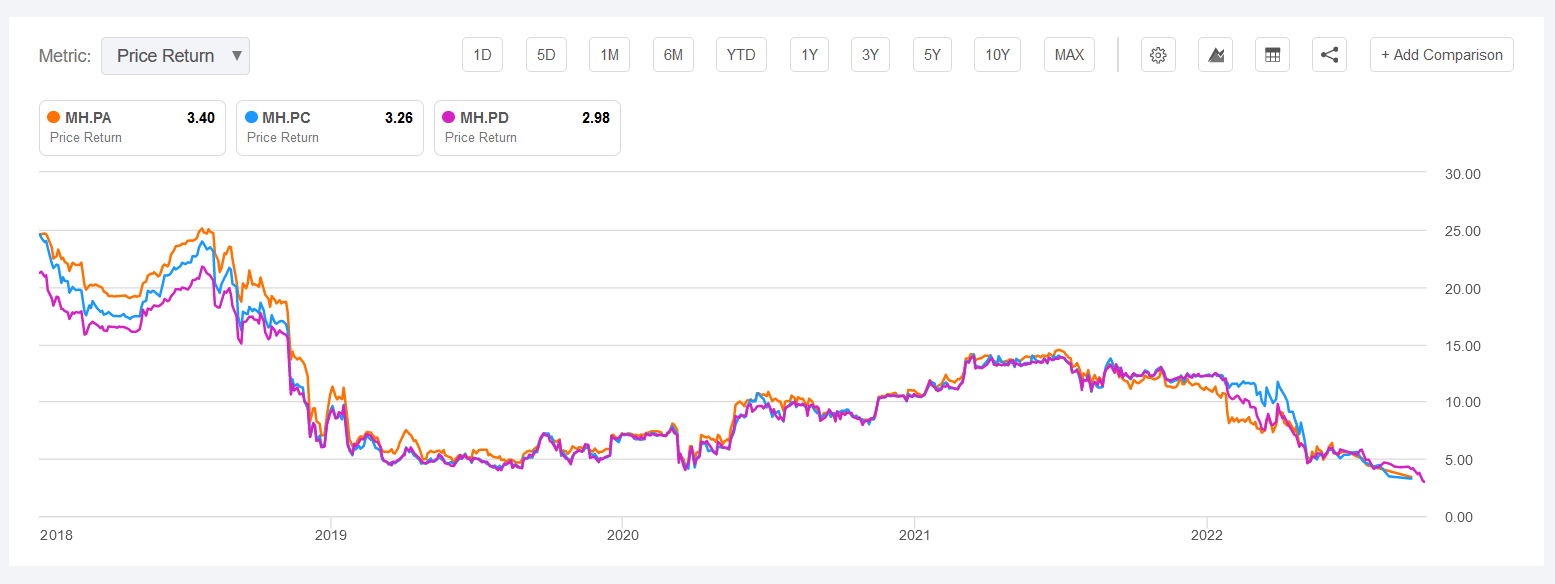
Seeking Alpha: MH Preferreds 2018-2022 Price Chart
These shares are trading at all time lows. Yet from a balance sheet their SE/PE coverage has never been greater. Not only are the preferreds more secure from a balance sheet perspective, the company generated net income in 2020 and 2021 totaling $69m. That equals 58% of the current preferred value of $119.672m. Net income so far this year has been -$887,000 which isn’t great but shows the company is not bleeding money.
Preferred Repurchase History
Repurchasing preferred shares has been done as part of the capital management pillar of their three-pillar turnaround strategy.
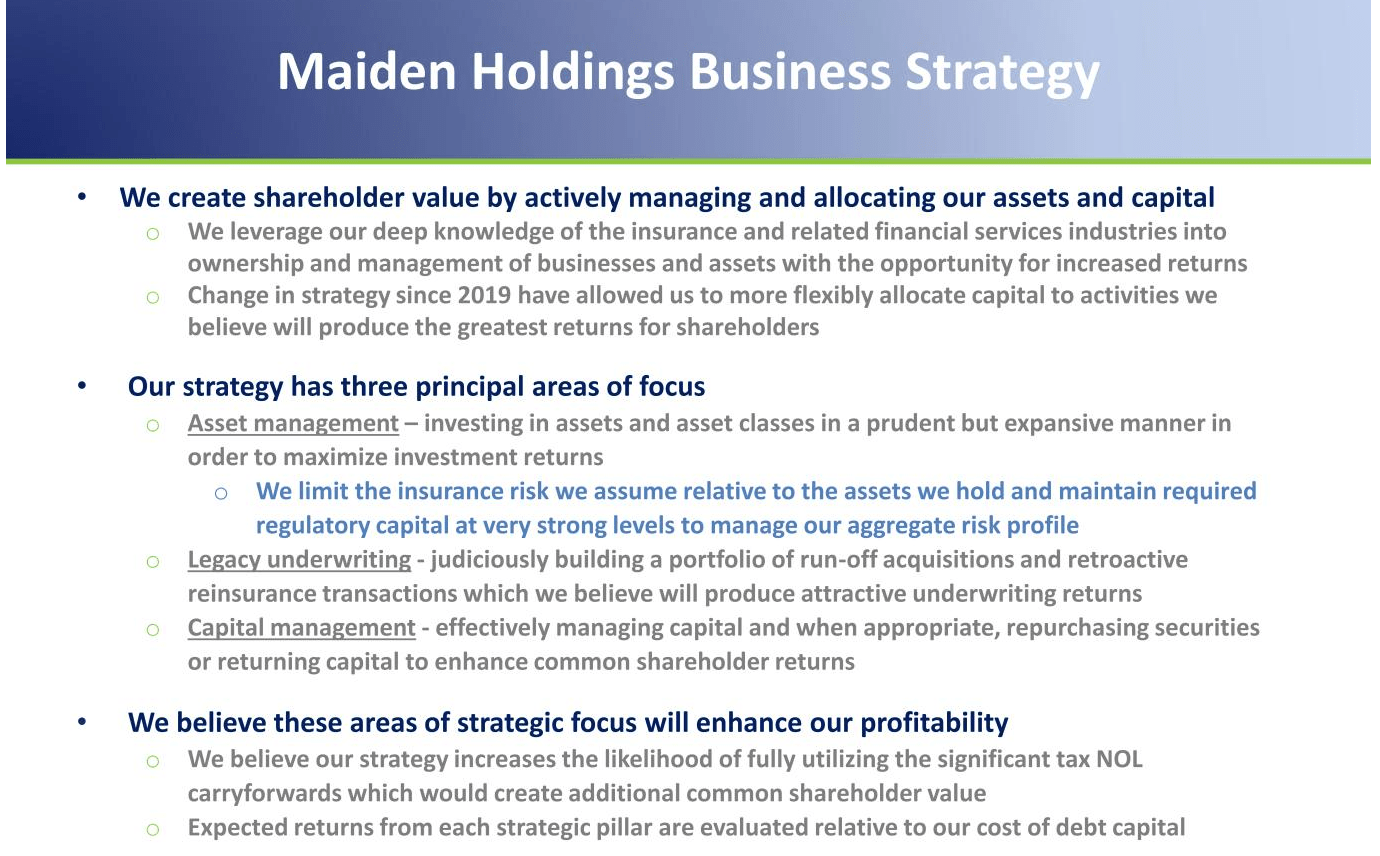
Q2’22 Investor Presentation: Business Strategy
It may be helpful to review the repurchase history of the preferreds to get a sense of pricing. Management first initiated repurchases with a tender offer in November 2020. The preferreds were each trading near $9.00 when the offer was made for up to $100m of them at $10.50. The tender offer was undersubscribed and resulted in only $29.69m actually being redeemed.
Filing with Results of Tender Offer
In March 2021 the board authorized a repurchase of up to $100m preferred shares. Before the end of the month $97.4m had already been spent repurchasing the preferreds at an average price of $14.71. This left $2.6m to repurchase preferreds.
The board increased this to another $50m in May 2021 which only $3.861m is left as of Q2’22. That means the company has spent almost $150m in repurchases since the end of 2020. Here’s a table of the repurchase history overall.
|
Type of Repurchase |
Time Frame |
Price |
|
Tender offer |
November 2020 |
$10.50 |
|
Private Repurchase |
March 2021 |
$14.71 |
|
q2’21 Market Repurchases |
June 2021 |
$14.33 |
|
q3’21 Market Repurchases |
September 2021 |
$13.42 |
|
q4’21 Market Repurchases |
December 2021 |
$12.18 |
|
q1’22 Market Repurchases |
March 2022 |
$11.27 |
|
q2’22 Market Repurchases |
June 2022 |
$5.27 |
|
Average |
$11.67 |
Over the last two years the company has been repurchasing the preferred shares at an average price of $11.67. That is 274% higher than current prices of $3.12. And in just two years they have repurchased 74.3% of the preferreds overall.
With the pricing even lower today I suspect the rest of the $3.861m will have been utilized. I think there’s a possibility that they may announce another round of repurchasing. Let’s consider that the carrying value for the preferreds as of Q2’22 was $119.672m. With the average preferred price at $3.12 currently that means they are trading at an 88% discount to par value.
If we apply that discount to the carrying value we can estimate how much it would cost the company to repurchase the shares. Doing the math, it comes out to just $14.45m. This is without factoring in the leftover $3.861m which they may have used already.
| Liquidation Values | Shares Outstanding (m) | Liquidation at par | Current Price |
Market Liquidation |
| MH.PA | 1.500 | $37.50 | $3.38 | $5.07 |
| MH.PC | 1.744 | $43.60 | $2.94 | $5.13 |
| MH.PD | 1.543 | $38.58 | $3.04 | $4.69 |
| Total | 4.787 | $119.68 | $14.89 |
They had $37.766m in cash and cash equivalents as of Q2’22 so this is within reach to do this. If they wanted they could announce a tender offer at $4.50 which would only cost $21.54m to repurchase the rest. This would be extremely accretive to book value resulting in a 43% increase to MHLD book value per share.
|
Q2 2022 |
Repurchase @ 4.50 |
% Change |
|
|
Cash and Cash Equivalents |
37,766,000 |
16,224,500 |
|
|
Debt |
255,459,000 |
255,459,000 |
|
|
Total Equity |
347,933,000 |
326,391,500 |
|
|
Preferred Stock |
119,672,000 |
0 |
|
|
Stock Equity |
228,261,000 |
326,391,500 |
42.99% |
It would also offer preferred holders a 44% return from current levels.
Yet in reality it would seem that the preferreds should trade at a premium to average repurchase prices. Why do I say that? As these repurchases have been done it has increased the safety of the preferreds that are left. One way that this is shown demonstrably is via that stock equity / preferred equity ratio I went over above. Theoretically the value of these shares should be proportional to the SE/PE ratio. Instead they’ve been inversely proportional; as SE/PE rose the price declined.
|
Type of Repurchase |
Time Frame |
Price |
SE/PE Ratio |
|
q2’21 Market Repurchases |
June 2021 |
$14.33 |
1.228 |
|
q3’21 Market Repurchases |
September 2021 |
$13.42 |
1.289 |
|
q4’21 Market Repurchases |
December 2021 |
$12.18 |
1.414 |
|
q1’22 Market Repurchases |
March 2022 |
$11.27 |
1.413 |
|
q2’22 Market Repurchases |
June 2022 |
$5.27 |
2 |
|
% Change |
-63.22% |
62.87% |
To me this represents a clear market inefficiency. How much of an inefficiency is up for debate though I would say they are at least worth the average repurchase price of $11.67.
Some Details On The Preferreds And Baby Bonds
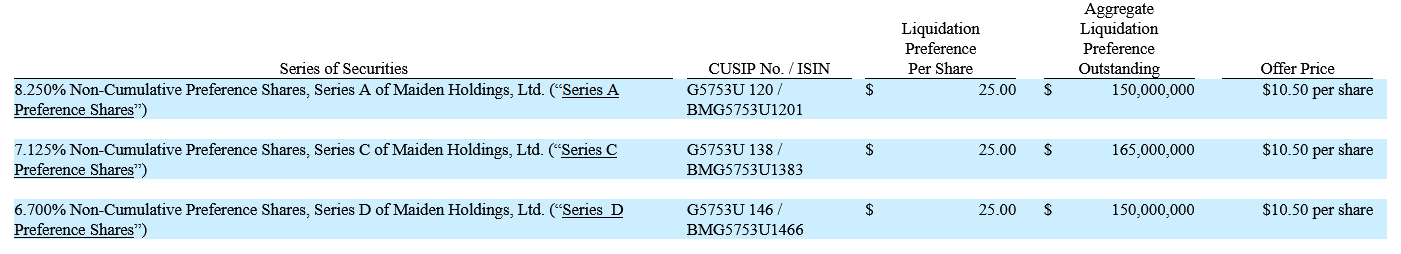
There are three outstanding preferreds all of which are non-cumulative and currently callable. Here are the details:
|
Par |
Original Coupon |
Issue Date |
Call Date |
|
|
$25.00 |
8.25% |
8/23/2012 |
8/29/2017 |
|
|
$25.00 |
7.125% |
11/20/2015 |
12/15/2020 |
|
|
$25.00 |
6.70% |
6/8/2017 |
6/15/2022 |
At this point the coupons on the preferred do not really mean anything. In my opinion the preferreds should trade at the same price as they sit in the same place in the capital stack. Another way to put this is these securities all represent the same piece of ownership in MHLD as the other. The only reason why these would trade differently is if one believed that a dividend would be initiated down the line which seems unlikely.
Of note about the preferreds is that given that dividends have not been paid out to them the company is unable to pay dividends on the common stock nor is it able to repurchase common shares. For management to unlock these capital allocation tactics they would either need to start paying a dividend on the preferreds or simply retire all of them.
One risk to this is that management technically has the power to change the terms of the preferreds given their majority ownership of them. If management wanted to pursue another route of to unlocking these capital allocation tactics they could move to change the terms of the preferreds. Despite owning a majority of the preferreds since June 2021 they have continued to repurchase them increasing total ownership of preferreds from 61% to 74%. This suggests to me that changing the terms does not seem to be their strategy, though it is a risk and should be noted.
A final feature of the preferreds is that after six quarterly periods without a dividend preferred owners are entitled to elect two directors to the board. At this point if interests representing 20% voting ownership in the preferreds wrote in they could theoretically nominate two directors.
Back in June 2020 this actually happened. While the election was called and two board members were nominated they were not actually elected. According to the shareholder meeting announcement “The tabulated votes of the Preference Shareholders totaled fewer than a majority of the Preference Shares of the Company and thus failed to achieve a quorum.”
With the company itself owning the majority of shares at this point though I don’t know if this feature would even really work any longer. But it is something of note.
As another note the company has two publicly-traded baby bonds: MHLA and MHNC. Here are some details on those:
| Price | Par | Dividend Yield | Issue Date | 1st Call Date | Maturity Date | |
| NYSE:MHLA | $15.50 | $25.00 | 10.69% | 6/7/2016 | 6/14/2021 | 6/14/2046 |
| NYSE:MHNC | $17.38 | $25.00 | 11.15% | 11/18/2013 | 12/1/2018 | 12/1/2043 |
These issues could see a revaluation higher if the preferreds are fully extinguished. The reason being is that the debt-to-equity ratios would come down as stock equity increases. For instance, if the $4.50 tender offer scenario occurred then debt-to-equity would decrease over half from 1.64x to 0.78x. Though it seems both of these issues seem to be trading off their dividend yield rather than valuation.
Signs Of Market Inefficiency
Something else I’ve noted while researching is the discrepancy in trading between the preferreds and the MHLD common stock. Just take a look at the past year.
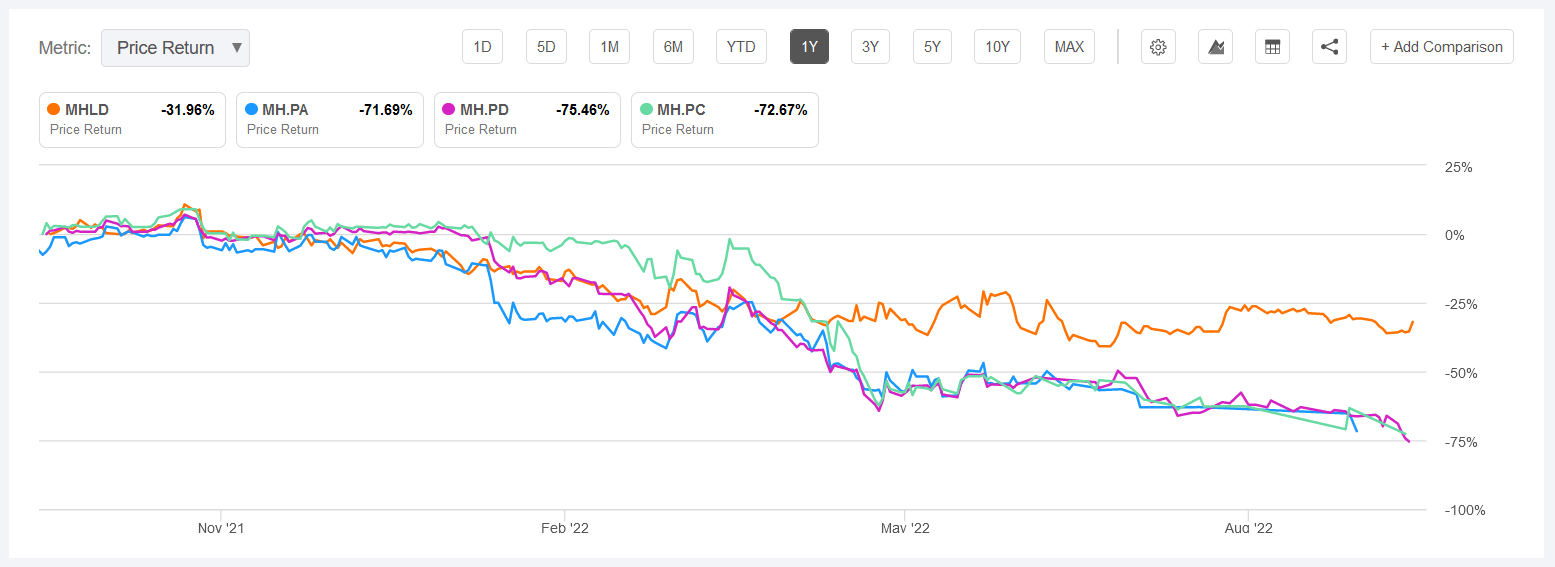
Seeking Alpha: MHLD and Preferreds 1-Year Chart
The preferred shares are down over twice as much as the common. This simply doesn’t make sense particularly within the context of the SE/PE ratio increasing during this time making the preferred more secure relative to the common stock. Additionally there have been repurchase programs that are buying the preferreds, not the common.
A couple of things are likely driving this inefficiency. The first is that Maiden Holdings itself is a microcap company with a market capitalization of just $183m. The preferred shares as they trade represent only a $14.89m market cap when added all together. Institutional investors likely are not playing in areas that are this small. And even less likely to be involved when it’s a preferred share with a suspended dividend.
Preferred shares typically attract a natural base of income investors. In the case of the Maiden preferreds these investors have not only been burned by the 2018 dividend suspension but have been given no reason to believe that dividends would be reinstated. So these investors likely have abandoned the shares as well.
In times of market panic stocks that are more illiquid typically see more volatility. The Maiden preferreds added together only have a 10-day average trading volume of 5,200 shares. And the bid-ask spreads are typically quite wide on any given day. So the preferreds are illiquid and with the recent turmoil in the markets I think we’re seeing this type of illiquidity create further inefficiency in pricing to the downside as people try to get out.
Even the pricing amidst the individual preferred securities is inefficient. In all likelihood each of these shares is worth the same amount given they sit at the same place in the capital stack. Despite that MH.PA is at $3.38 while MH.PC is at $2.94. Last week the situation was flipped with MH.PA at $2.85 and MH-C at $3.26.
I was able to dig up that the iShares Preferred and Income Securities ETF (PFF) is a significant owner of each of the three preferreds. I reviewed around a dozen other preferred ETFs and did not see any other which held the Maiden preferreds. From PFF’s annual report in March 2022 I pulled the following data. Their semi-annual report last year was filed at the end of September so it’s likely new data here will be forthcoming.
|
Security |
# of Shares |
Total # Outstanding |
% Ownership |
|
MH-A |
476253 |
1500000 |
31.75% |
|
MH-C |
524230 |
1744000 |
30.06% |
|
MH-D |
474349 |
1543000 |
30.74% |
Compared to September 2021 the ETF has decreased their exposure to each of the preferreds by about 6%.
|
Security |
9/30/21 |
3/31/22 |
% Change |
|
MH-A |
508544 |
476253 |
-6.35% |
|
MH-C |
559816 |
524230 |
-6.36% |
|
MH-D |
506640 |
474349 |
-6.37% |
This amounted to about 100,000 shares being sold in six months which likely put pressure on the preferreds as well.
The last detail reflecting possible market inefficiency is just about reversion to the mean. Using StockMarketMBA.com’s preferred database list I was able to pull a data set of 517 preferred shares with par value of $25.00. These preferreds inclusive of the Maiden preferreds had an average price of $21.51. Based on a combination of our fundamental understanding I think this is another data point which reflects inefficiency.
A Bear Case: What Would It Take To Impair Preferred Shares
Let’s take a second and consider the other side of the argument here. Let’s say that in a worst case scenario we see another book value haircut like 2018. Book value per share was $9.25 in 2017 and just $1.08 in 2018. This was an 88% decrease.
Current book value per share sits at $2.62. Applying an 88% haircut would mean that the equity would be worth $0.3144. With 87.161m shares outstanding this would imply a book value of $27.40m. If we consider the liquidation value of the preferreds at current prices is $14.89m then even in this extreme scenario the remaining equity value would still cover the preferred liquidation value.
Conclusion: Maiden Holdings Preferred Shares Are Underpriced
Really the question is by how much. Management at this point is incentivized to repurchase the 25% of preferreds they do not already own and have been repurchasing at average prices significantly above current prices. Without eliminating the preferreds management will continue to be unable to issue dividends on the common stock or repurchase common shares.
I’ve shown that despite the best equity coverage of the preferreds in the last five years the securities are trading at all-time lows. Management has aggressively rebought the preferreds as part of their capital allocation strategy and seems poised to fully eliminate them in the coming year.
I make an argument that fair value for the preferreds is likely above the average repurchase price of $11.67. Even if the company did a tender offer where all preferred owners sold out at $4.50 then buying in today could generate 44% returns. A tender offer at this level is not only doable with current cash on hand it would be extremely accretive to book value.
There are risks related to the AmTrust and Barry Zyskind relationship, risks which keep me away from the common. Though given my analysis I think these risks are not as material to the preferred thesis. And even in the case of another 88% haircut to book value stock equity would still be greater than the current liquidation value of the preferreds.
A major risk could be that management decides to do nothing with the remaining preferreds and simply leaves the orphaned. If management does this they accept inherent limitations on their capital allocation tactics like issuing common dividends or repurchasing the common. With the situation as it stands it seems rather that management is incentivized to close out their dealings with the preferred shares both to generate book value increases and unlock these capital allocation tactics.
A less risky way to play this situation could be investing in either of the baby bonds as they stand to re-rate demonstrably if the preferreds are extinguished. The securities are more secure in the capital stack and offer a dividend as well.
And a more risky way to play this is with MHLD common stock. There are a number of factors which seem to be driving book value per share which could help to rerate the stock. The preferreds coming off the balance sheet is theoretically a good thing for the common as it basically eliminates a debt. It’s also going to help juice book value growth over the near term.
Ultimately though my recommendation is to go with the preferreds. They represent the most inefficient piece of the puzzle from my reading and are poised to benefit from the company’s strategy. With additional security guaranteed by the position in the capital stack the downside is mitigated while the upside could be very significant.
There is even an argument to be made that these preferreds are worth par. If the company is profitable moving forward and continues expanding the SE/PE ratio, then why not?
Be the first to comment