

jetcityimage/iStock Editorial via Getty Images
Investment Thesis
Retailers have been under the weather recently, as the macro headwinds intensified, with inventory management falling under the microscope. Macy’s Inc. (NYSE:M) has also suffered since reaching its November highs. M has declined more than 50% as the market parsed its valuations, given falling revenue and profitability estimates.
Our price action analysis suggests that M has failed to recover from its massive bull trap (significant rejection of buying momentum) in November. The market then distributed its gains from December to May, after forcing an initial steep selloff in December. A subsequent rapid liquidation to force a bottom leading into its FQ1’23 earnings card was significant. Notably, M has already dropped into a bearish bias and struggled for upward momentum.
Our valuation model indicates that the market could expect M to underperform as its growth normalizes.
Given its bearish bias and valuation, we urge caution. Notwithstanding, we believe the stock could be at a near-term bottom, as it last traded close to its near-term support.
As such, we now rate M stock as a Hold as we wait for more constructive price action signals. A subsequent bull trap could be a critical early warning signal suggesting a steeper sell-off.
Macy’s Good Days Are Over
Macy’s revenue change % and adjusted EBIT margins % consensus estimates (S&P Cap IQ)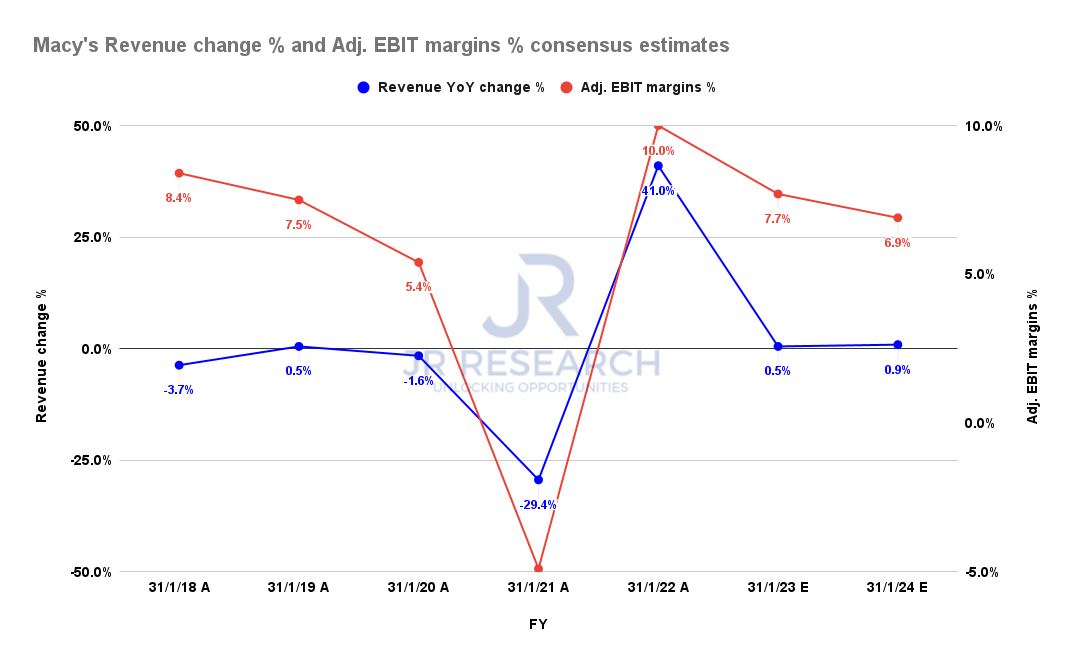
After registering a 41% YoY revenue growth for FY22, the consensus estimates (generally neutral) suggest that Macy’s revenue increase is expected to normalize to just 0.5% for FY23. Consequently, its adjusted EBIT margins could also be impacted, falling through FY24, reaching 6.9% (Vs. 10% in FY22).
Macy’s FCF margins % consensus estimates (S&P Cap IQ)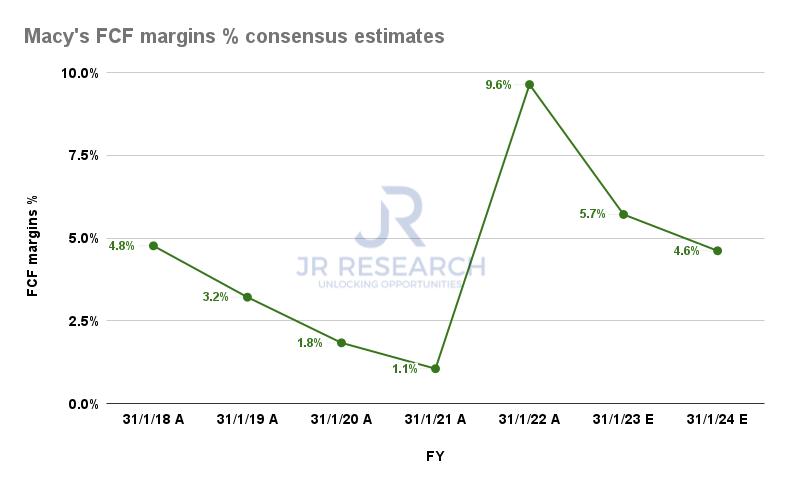
Notably, its free cash flow (FCF) profitability is projected to moderate significantly through FY24. The Street’s consensus suggests that Macy’s could post an FCF margin of 4.6% in FY24, broadly in line with its 5Y average of 4.7%. Therefore, the good days in 2020-21 will likely be well over as the market normalizes its forward expectations of Macy’s operating model.
Macy’s Stock – Digestion Started In November’21
M price chart (TradingView)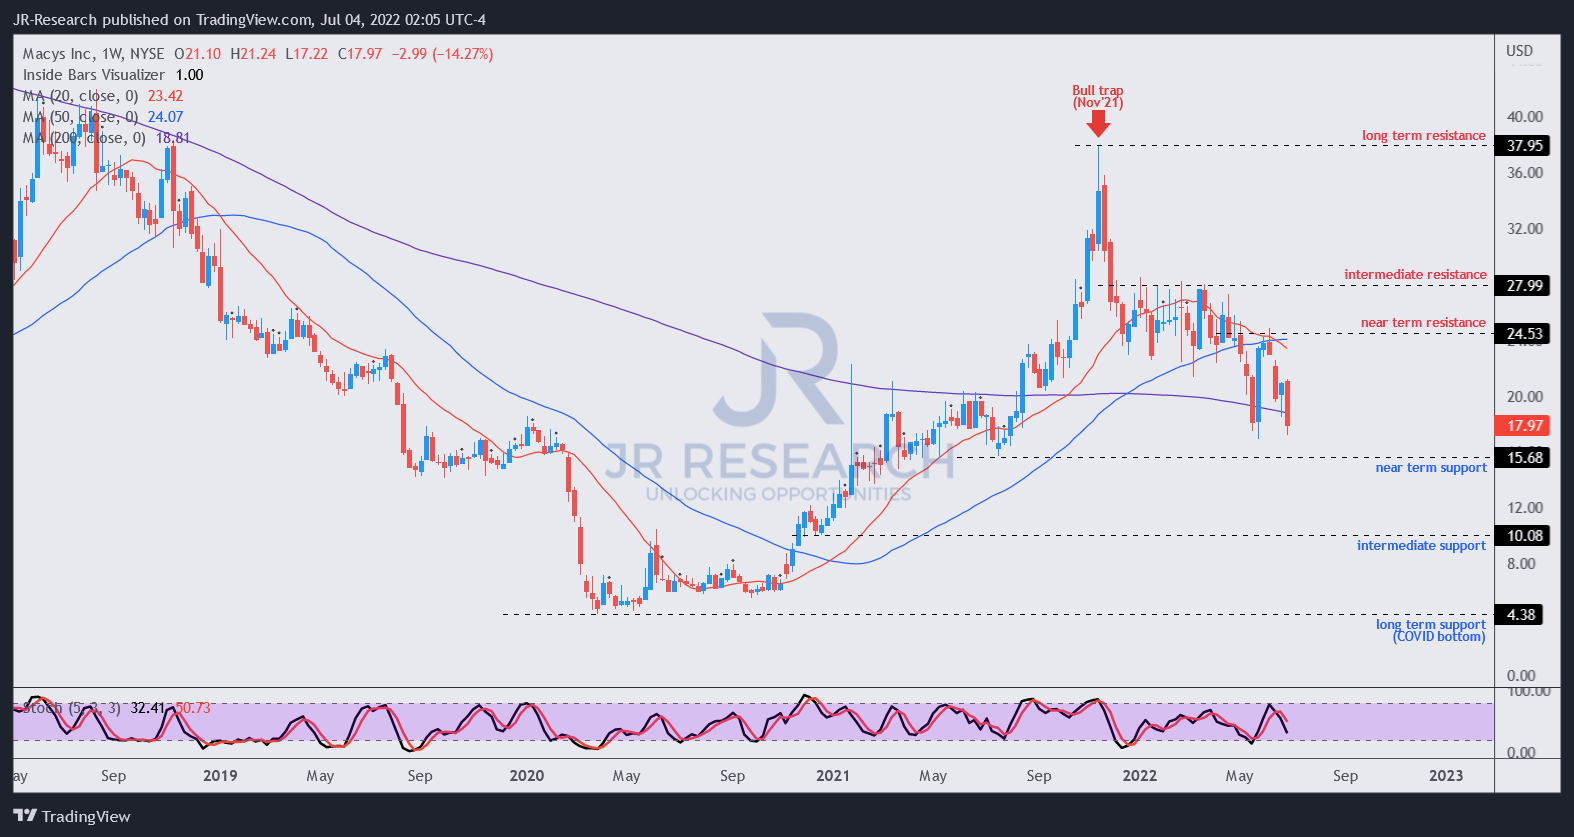
Our analysis suggests that the early warning signal to digest M’s massive gains from its COVID bottom started in November 2021, as seen above. The massive bull trap has set the stage for the market to force an initial steep liquidation in December.
The subsequent distribution phase then kept M from recovering its upward momentum, as the market drew in dip buyers but prevented it from retaking its intermediate resistance ($28) decisively.
However, the steep sell-off leading into its FQ1 earnings card was significant. A solid card helped stage a short-term rebound, which turned out to be a bull trap, as the marked drew in dip buyers astutely.
M has retraced its post-earnings gains and is re-testing its May lows. Therefore, June’s bull trap has sent M stock into a decisive bearish bias, as the market rejected further buying momentum.
We believe M’s bearish bias could force it lower to re-test its near-term support ($15.5) moving forward.
M Stock Valuation Is Not Constructive
| Stock | M |
| Current market cap | $4.85B |
| Hurdle rate (CAGR) | 11% |
| Projection through | CQ4’26 |
| Required FCF yield in CQ4’26 | 18% |
| Assumed TTM FCF margin in CQ4’26 | 4.6% |
| Implied TTM revenue by CQ4’26 | $30.34B |
M reverse cash flow valuation model. Data source: S&P Cap IQ, author
The market set up the bull trap in November as M traded at an FCF yield of about 8%. Furthermore, it set up its intermediate resistance at an FCF yield of about 12%. Notably, M posted a 5Y and 10Y mean of its FCF yield at 12.35% and 11.32%, respectively.
Therefore, we believe the market is signaling that it expects M to underperform moving ahead. Notably, M traded at an FCF yield of about 22% at its June bull trap, as the market rejected buying momentum.
As a result, we believe it’s appropriate to use an FCF yield of about 18% to model its current valuation dynamics. Applying a market-perform hurdle rate of 11%, we require M to post a TTM revenue of $30.34B by CQ4’26. However, the current consensus estimates indicate that Macy’s is unlikely to meet our revenue target.
Accordingly, we believe the market requires higher FCF yields to compensate for a markedly lower implied hurdle rate and expects M to underperform.
Is M Stock A Buy, Sell, Or Hold?
We rate M as a Hold for now.
M is likely at a near-term bottom, re-testing its May lows. However, it has already dropped into a decisive bearish bias, and a possible re-test of its near-term support ($15.5) is likely moving forward.
Our valuation model indicates that M will likely underperform the market moving ahead. Therefore, investors should consider avoiding adding exposure at the current levels.
Be the first to comment