

Adam Smigielski/E+ via Getty Images
In my article on Micron Technology (NASDAQ:MU) published on May 3, I presented a thesis that the macro backdrop is onerous for memory demand and hence MU’s business. I also pointed out that for Micron, gross margin “GM” is an excellent metric to measure supply-demand balance, and hence the health of the business. Micron’s GM has plateaued for four quarters, indicating that GM may decline soon. The price of MU’s shares was at $71.26 at the time of publication of that article. The price has declined to $53.65 at the close on July 1, representing a decline of about 25%. This is compared to a decline of about 8.4% in the S&P 500 over the same time span. In this article, I will provide an update to the thesis. In particular, the macro outlook has worsened and I expect MU’s GM, profitability and share price to continue to decline.
Micron’s business is in a down cycle. Gross margin, profitability and share price will likely continue to decline
Micron is a great company. It is very competitive with the other semiconductor memory suppliers of the world. Its balance sheet is strong and it generates significant free cash flow. It has been reducing its cost structure, making it more profitable through a cycle. Micron and its peers have been more rational in their capex investment. I look forward to buying MU shares someday, but today I am short into this down cycle.
It is my opinion that despite the high-tech nature of the manufacturing process, memory is a commodity, and the business is cyclical. Profitability is driven by supply demand balance. As a result, Micron trades like a cyclical commodity stock with low PE ratios. Hence, in order to profit from trading in MU stock, one must trade it like a cyclical commodity business, selling close to the top and buying close to the bottom.
I have found that MU’s GM is the best indicator to foretell the top and the bottom of the cycle. A chart of MU’s historical GM and share price is shown in Figure 1. The last GM data point is management’s guidance for F4Q, which is 41.5% at the mid-point.
Figure 1: Micron’s historical GM and price. Note: the price in Figure 1 is the closing price the day after earnings print. (Company releases and SA data base)
Figure 1 shows that historically, MU’s price peaked and then declined after the GM rolled over and declined and bottomed and then increased after the GM bottomed out and increased. However, in the current cycle, the GM has plateaued for four quarters and investors have been selling ahead of the GM decline likely because of the weakening macro outlook. In retrospect, the plateauing of the GM was likely an indication that despite continuous cost reduction, MU is losing pricing power and has to pass along most of its cost savings to its customers in order to maintain market share. This would have been an early indication of slackening demand.
Micron’s consumer facing business is down, and cloud, enterprise and auto businesses will probably roll over shortly
This down cycle is driven by the macro-induced demand destruction. This is not lost to management and the analysts. The words “macro” and “macroeconomics” appeared no less than ten times in the F3Q2022CC. The macro headwinds are front and center in everyone’s concern.
Micron reported that the consumer facing businesses (smartphone and consumer PC) are deteriorating rapidly during F3Q. This is something that I have pointed out in my May 3 article. Micron also reported that the data center, enterprise, and auto business are holding up. During the Q&A session, analysts expressed their concerns for the robustness of the data center business as enterprise CIOs are concerned with the macro-outlook and are pulling back on their budget. Analysts also pointed out that Chinese data centers have already pulled back their spending. Further, memory inventory is elevated in the data center supply chain, even higher than before the pandemic. While management did not provide any concrete answers, it is likely that the analysts’ concerns are simply leading indicators of a downturn in the data center business.
Similarly, when enterprise customers tighten their budget, the enterprise client business will likely decline. The auto business is always very sensitive to the economy. With the macro backdrop deteriorating rapidly, I will not be surprised that the auto business will roll over soon. Hence, it is likely that all of MU’s business segments will decline in the next several quarters, further impacting revenue, GM, profitability and share price.
Management has indicated that market visibility is worsening. This can be seen also in the lower revenue and GM guidance for F4Q and wider bands for the guidance. Revenue guidance is at $7.2 billion compared to analysts’ consensus of $9.02 billion, a big miss. The revenue guidance band is widened from a typical +/- $200 million to +/- $400 million. Similarly, the GM guidance represents a drop of 520 basis point at the mid-point and the band is widened from a typical +/- 1% to +/-1.5%. Further, management refused to predict when this cycle will bottom. Frankly, I do not think that they know because this down cycle is macro-driven and they, like most people, have very limited visibility on the trajectory of the macro.
I give management credit for doing things that are within their control. Management will cut operating expenses and capex. They will reduce wafer front end utilization in 2023. However, given the long lead time in the manufacturing cycle and the rapidly declining demand, management expects inventory, now at 108 days of sales, to explode by perhaps as much as 20 more days of sales. This will likely further exacerbate the downturn in GM due to potential write downs, lower utilization of wafer front end, and higher COGS carried in inventory. As a result, I expect GM to decline further beyond F4Q, taking MU’s share price down with it along the way.
Gross margin is probably the best indicator to watch for the bottom
An investor’s natural question is: when will the share price bottom? I do not know, but I will let my GM indicator guide me. I believe it is the best indicator for predicting the turning of the cycle. I will watch both the GM and the rate of decline of the GM. When the rate of decline moderates, it may be time to close my short positions and go long.
Some readers have commented in my May 3 article that the low PE ratio of MU shares will provide support for its share price. Unfortunately, earnings will likely decline in a down cycle, causing the PE ratio to increase. Hence, I believe that for most cyclical stocks like MU, the time to buy is when PE is sky-high. The time to sell is when the PE is low. Yet others have suggested that MU’s book value of about $43 per share may provide a floor. Unfortunately, cyclical companies may sell below book value in a down cycle. Hence, an investor may not find comfort in the book value to provide support should the macro get very ugly.
Macro indicators are useful to gauge the bottom of Micron shares as well
The macroeconomic headwinds impacting the worldwide economy are well known: Inflation, Fed tightening, war in Ukraine, Europe mired in a recession and energy crisis, high energy prices, China’s economy is hurting due to the collapse of its property developers, COVID lock-down, and policies against its tech companies. These same headwinds are impacting demand for MU’s memory products worldwide as well.
Typically, a memory down cycle lasts about eight quarters. With the plateauing of the GM for four quarters, we may be one to four quarters into this down cycle, depending on when you count as the start of the down cycle. Hence, there may be four or seven more quarters to go before this down cycle ends. However, since this cycle is driven by the macro, macro will likely determine the duration of this cycle. Hence, it pays to watch the macro indicators.
Shown in Figure 2 is a list of macro indicators that I intend to watch in conjunction with my GM indicator. I borrowed this list from Mr. David Rosenberg of Rosenberg Research. You can find his work on this list of indicators here between time stamps 1:36 and 4:32.
Figure 2: List of macroeconomic indicators to watch for market bottom. (Rosenberg Research)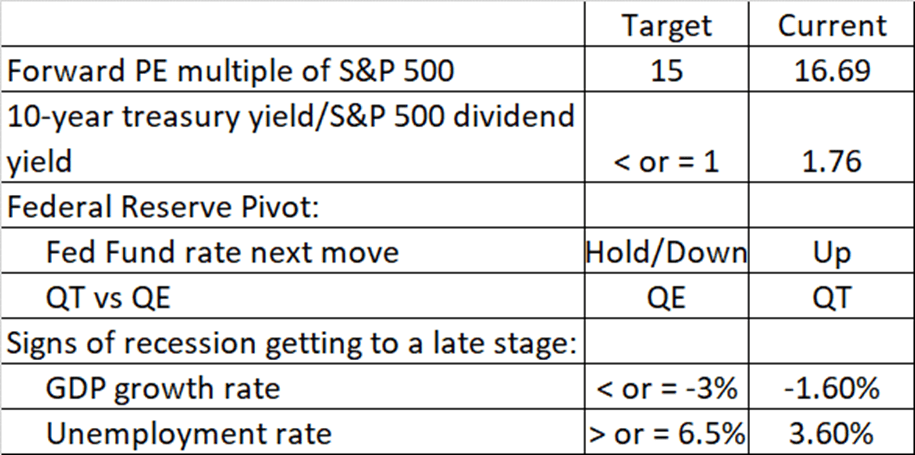
When my GM indicator shows an inflection and when most of these indicators in Figure 2 have reached or come close to their respective target values, then it would be time to close my short positions and go long MU shares. Until then, I will let my short positions ride.
Looking at the indicators in Figure 2, one should not find too much comfort in the forward PE of the S&P 500 being so close to the target value. I believe that downward revision of forward earnings will come in earnest when 3Q earnings are reported starting in several weeks. Downward revision will likely continue for at least the next six months, if not longer, thereby increasing the forward PE ratio.
The current 10-year treasury yield is 2.889% while the S&P 500 dividend yield is 1.64%. For the ratio of the two yield numbers to reach parity, either the treasury yield has to come down a lot or the S&P 500 has to decline a lot. Both will probably happen as the recession advances. This just tells me that there is much downside risk for MU share price, even though it has already declined by 45% from its peak of this cycle.
Risks
In the last cycle, investors have anticipated the peaking and bottoming of MU’s GM and acted accordingly ahead of the inflection points. Hence, there is a risk that investors may buy before the bottom, thereby reducing the return on my shorts and reducing the potential gain of my future longs. The economy may not worsen as much as I expect and hence MU’s shares may rebound rapidly. Micron, with its share price down significantly, may attract a suitor, causing share price to jump. Selling short always carries a risk of potentially unlimited loss. Buying put option carries a risk of complete loss of one’s capital.
Takeaway
Micron’s management has guided GM and revenue to decline 520 bps and 16.7%, respectively, QoQ at the mid-point. More importantly, the revenue guidance is 20% below analysts’ consensus, a big miss! It is likely that this down cycle will last well into 2023, resulting in Micron’s share price to continue to decline. This down cycle is driven by macro headwinds. Hence, it pays to watch my GM indicator for its inflection as well as some macro indicators to guide the timing of the closing of my shorts and to go long.
Be the first to comment