


da-kuk/E+ via Getty Images
Despite a recent pullback in equity markets, valuations for most indices are hardly compelling. While PE ratios are now closer to historical averages, rising interest rates, economic uncertainty, and a potential decline in earnings present further downside risks. Broad market indices are generally hiding the dispersion in performance across sectors though. Energy remains fairly strong and has buffered the performance of the S&P 500 somewhat. In addition, many large cap stocks have performed relatively well. In comparison, biotech, tech, and many small cap stocks have declined substantially and appear inexpensive relative to historical norms.

Figure 1: S&P 500 PE Ratio (source: Created by author using data from multpl.com)
At this point in time, earnings probably represent the biggest threat to valuations. Earnings have been extremely strong in recent years which has driven stock market performance. Earnings would need to decline by approximately 25% to return to trend levels. Above trend consumer spending on durables goods, declining savings rates and rapidly rising inventory levels all point towards a potential decline in profits in the near future. It is likely that earnings weakness is already being priced in by the market somewhat and is at least in part responsible for multiple compression over the past few months.
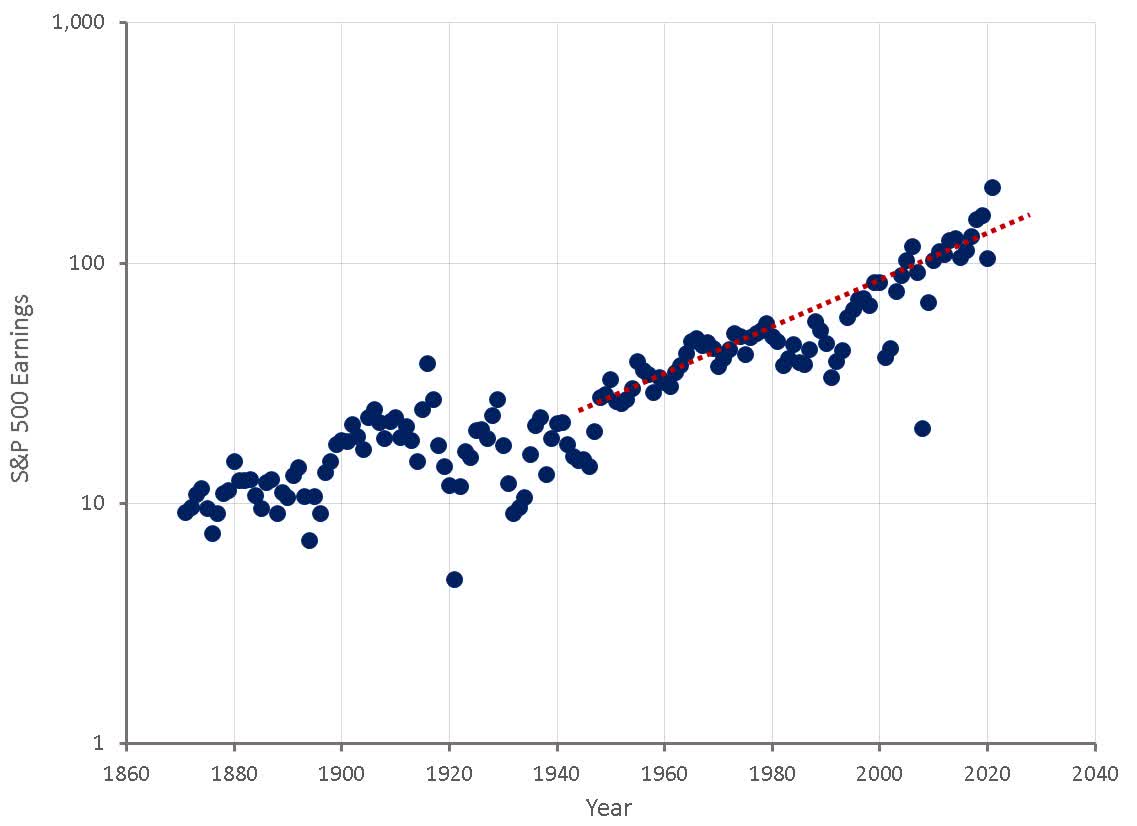
Figure 2: S&P 500 Earnings (source: Created by author using data from multpl.com)
Relatively high PE ratios over the past 30 years have been supported by a benign inflationary environment, both in terms of the amount of inflation and the volatility of inflation. The market does not currently appear to be assigning a high probability of inflation and interest rates remaining permanently higher going forward. If interest rates were to move substantially higher and remain there, then it is possible that stocks could fall a further 20-30%.
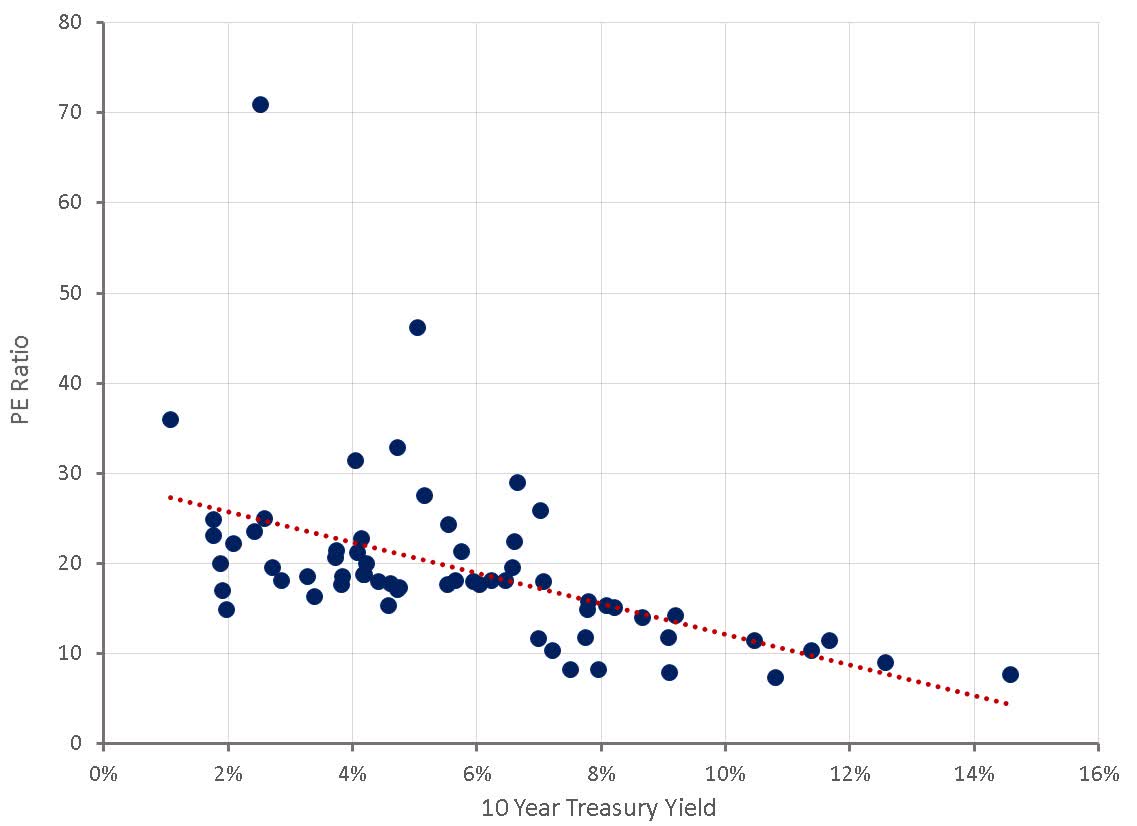
Figure 3: PE Ratio and Treasury Yields (source: Created by author using data from multpl.com)
The opportunity cost of investing and uncertainty are key determinants of valuation. In an environment with larger opportunity costs and higher uncertainty, valuations should be lower. Comparing the earnings yield of the S&P 500 with inflation rates and the volatility of inflation, it can be seen that this relationship has generally held up over the last 150 years.
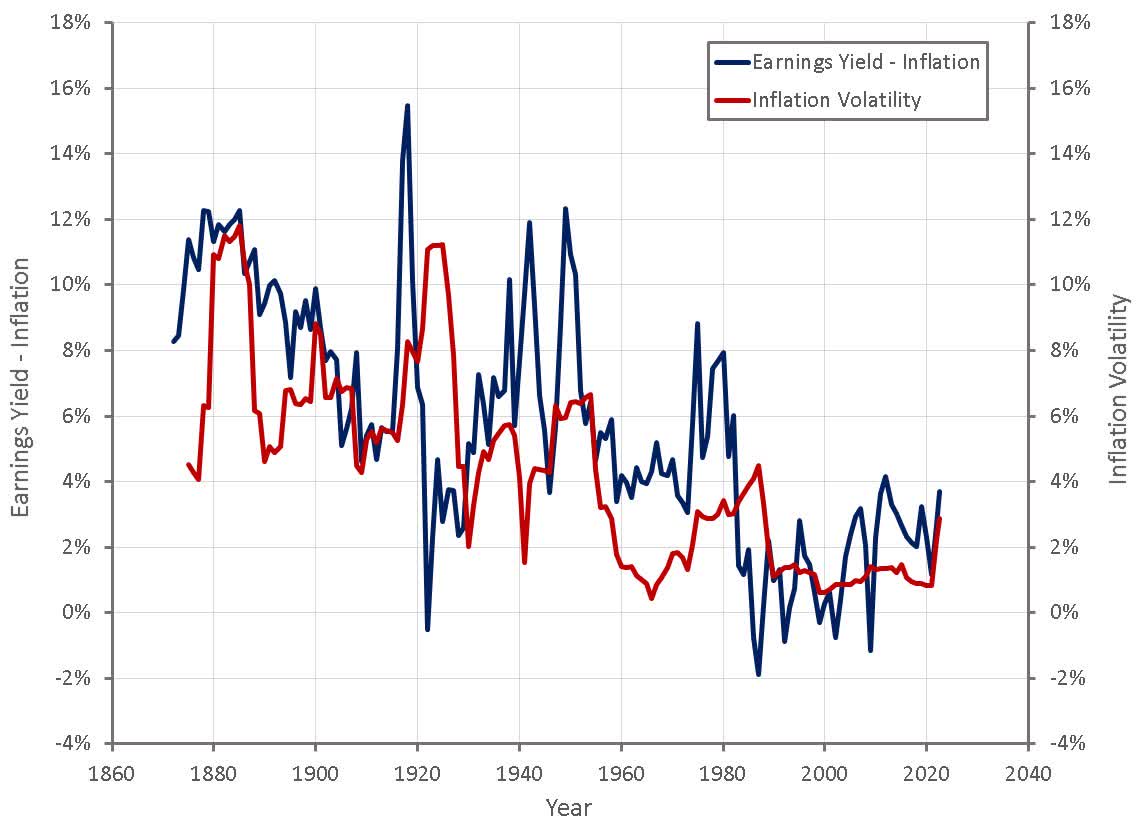
Figure 4: Earnings Yield and Inflation Volatility (source: Created by author using data from multpl.com)
Modeling the S&P 500 PE ratio based on the inflation rate and the volatility of inflation shows that these 2 factors explain much of the variation in valuations. Depending on the course of future earnings, valuations appear reasonably fair now assuming that inflation returns to the low levels of the past decade and inflation volatility moderates. If there is truly a shift in economic regime and inflation becomes structurally higher and more volatile, then significant downside would still be expected.
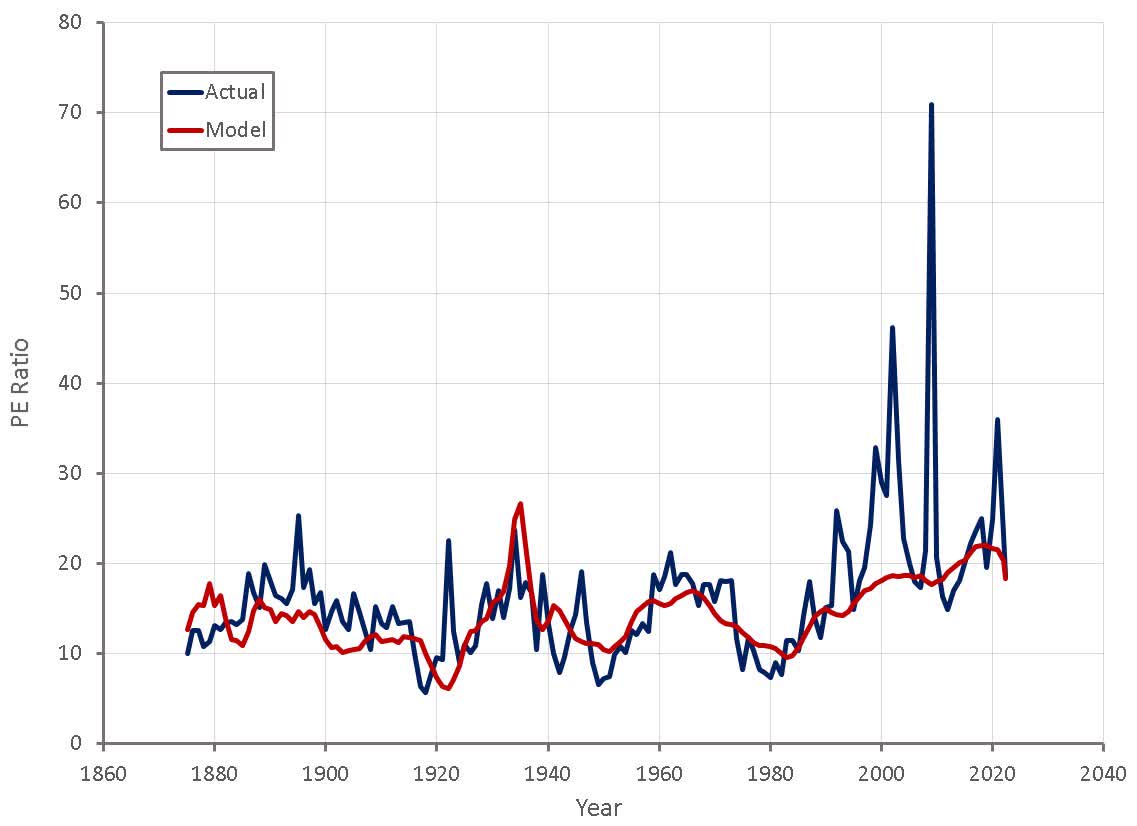
Figure 5: Modeled S&P 500 PE Ratio (source: Created by author using data from multpl.com)
The ratio of the Wilshire 5000 Market Capitalization to the GDP of the US is another indicator of value, albeit a poor one. Potential problems with this indicator include:
- Difference between earnings and GDP
- Percentage of GDP that is attributable to listed companies
- Percentage of listed company earnings that comes from international markets
- Interest rates
- Expected earnings growth
As a result of some of these issues, this indicator doesn’t exhibit mean reversion and must be detrended. This indicator does not rely on volatile corporate profits though, which can be useful in highlighting extremes during a recession or overheated economy.
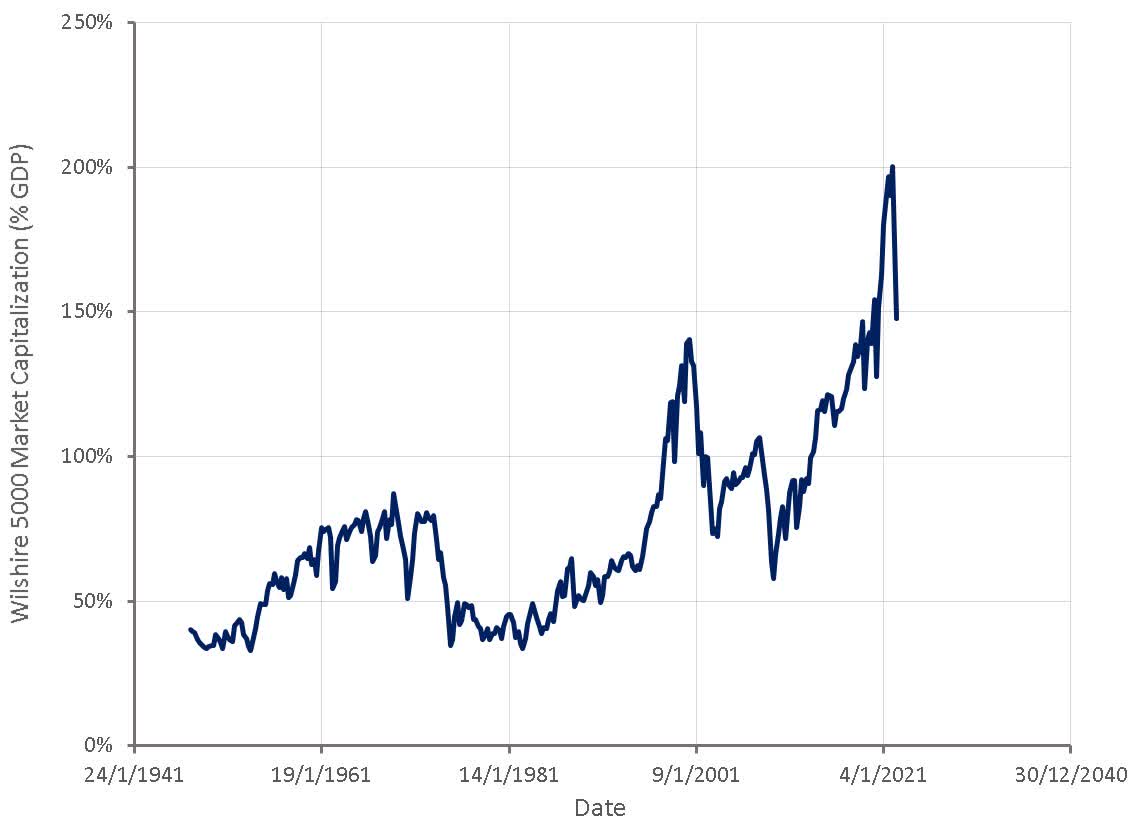
Figure 6: Wilshire 5000 Market Capitalization Relative to GDP (source: Created by author using data from The Federal Reserve)
Adjusting for interest rates and detrending this indicator potentially makes it more useful. Significant buying opportunities during recessions and overvaluation towards the end of bull markets can both be readily seen. Absent a return to low and stable inflation rates, stock market returns may still be fairly weak going forward.
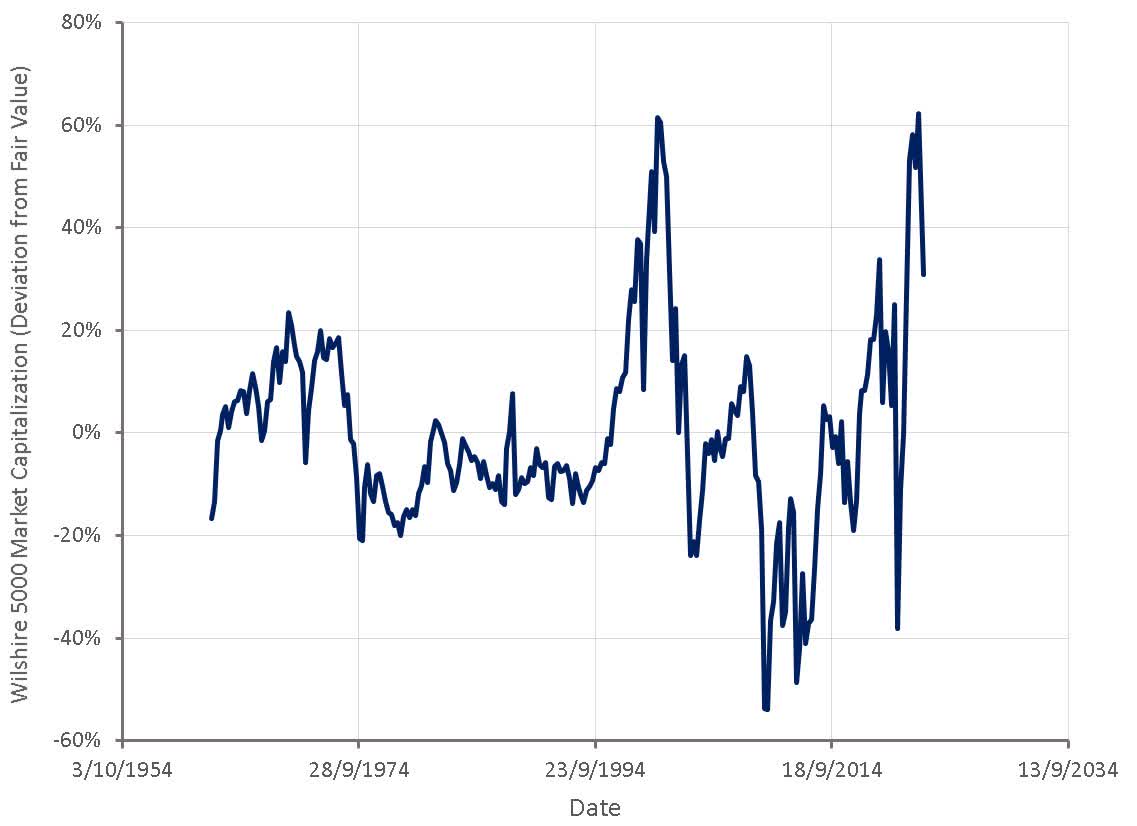
Figure 7: Wilshire 5000 Market Capitalization Relative to Calculated Fair Value (source: Created by author using data from The Federal Reserve)

Figure 8: Wilshire 5000 Deviation from Fair Value and 10 Year Forward Returns (source: Created by author using data from The Federal Reserve)
Investors should keep in mind that globally there is a large amount of capital chasing a limited set of investment opportunities. An investment is ultimately worth whatever price the marginal buyer and seller will conduct a transaction at. Mean reversion in corporate profits, permanently higher inflation, or greater instability in inflation rates present further downside risk. At a more granular level there already appears to be pockets of undervaluation in areas like tech, biotech, and small-cap stocks. There are other areas that appear inexpensive (like homebuilders and energy), but investors should be wary that earnings may evaporate during a recession.
Be the first to comment