


Marcus Lindstrom
Generally speaking, when I analyze a REIT, I tend to give a little extra leeway from a fundamental perspective and from a pricing perspective because of the fact that the majority of the REITs out there tend to generate consistent and growing cash flows in a way that reduces their risk to shareholders. But given these uncertain times we are dealing with, I’ve started to become a bit more conservative in my assessments. So when I see a REIT report some signs of weakness that persist over multiple quarters and that is trading at levels that more or less match similar firms in the market, it only makes sense that I would lower my expectations on that company compared to what I might have thought previously. One wonderful example of this can be seen by looking at LXP Industrial Trust (NYSE:LXP), a REIT whose focus is largely on owning and leasing out industrial assets like warehouses and distribution facilities to customers across the Sunbelt and the Midwest. Although I believe that the company’s prospects are appealing in the long run, shares don’t look as attractive as they did previously. Because of this, I’ve decided to decrease my rating on the company from a ‘buy’ to a ‘hold’ to reflect my view that shares should generate returns that more or less match the broader market moving forward.
Some weak performance
Back in June of this year, I wrote an article discussing the investment worthiness of LXP Industrial Trust. I talked about how the company had been hit hard by the general market decline, with fundamental performance also weakening any optimism investors might have had in the firm. All things considered, I felt as though cash flows reported by the company were encouraging and I believed that shares were beginning to look more appealing than they did previously. This ultimately led me to increase my rating on the company from the ‘hold’ I had it at before to a ‘buy’. But since then, things have not gone as I would have hoped. While the S&P 500 is up by 5.4%, shares of LXP Industrial Trust have generated a loss for investors of 2.4%.
Considering how volatile this market has been, this return disparity is not all that significant. Having said that, my decision to decrease my rating on the company back to a ‘hold’ has nothing to do with how shares have moved. Instead, it relates to how the company has performed from a fundamental perspective. To see what I mean, we need only look at financial results covering through the first three quarters of the company’s 2022 fiscal year. Previously, I only had data covering through the first quarter of the year.
Author – SEC EDGAR Data
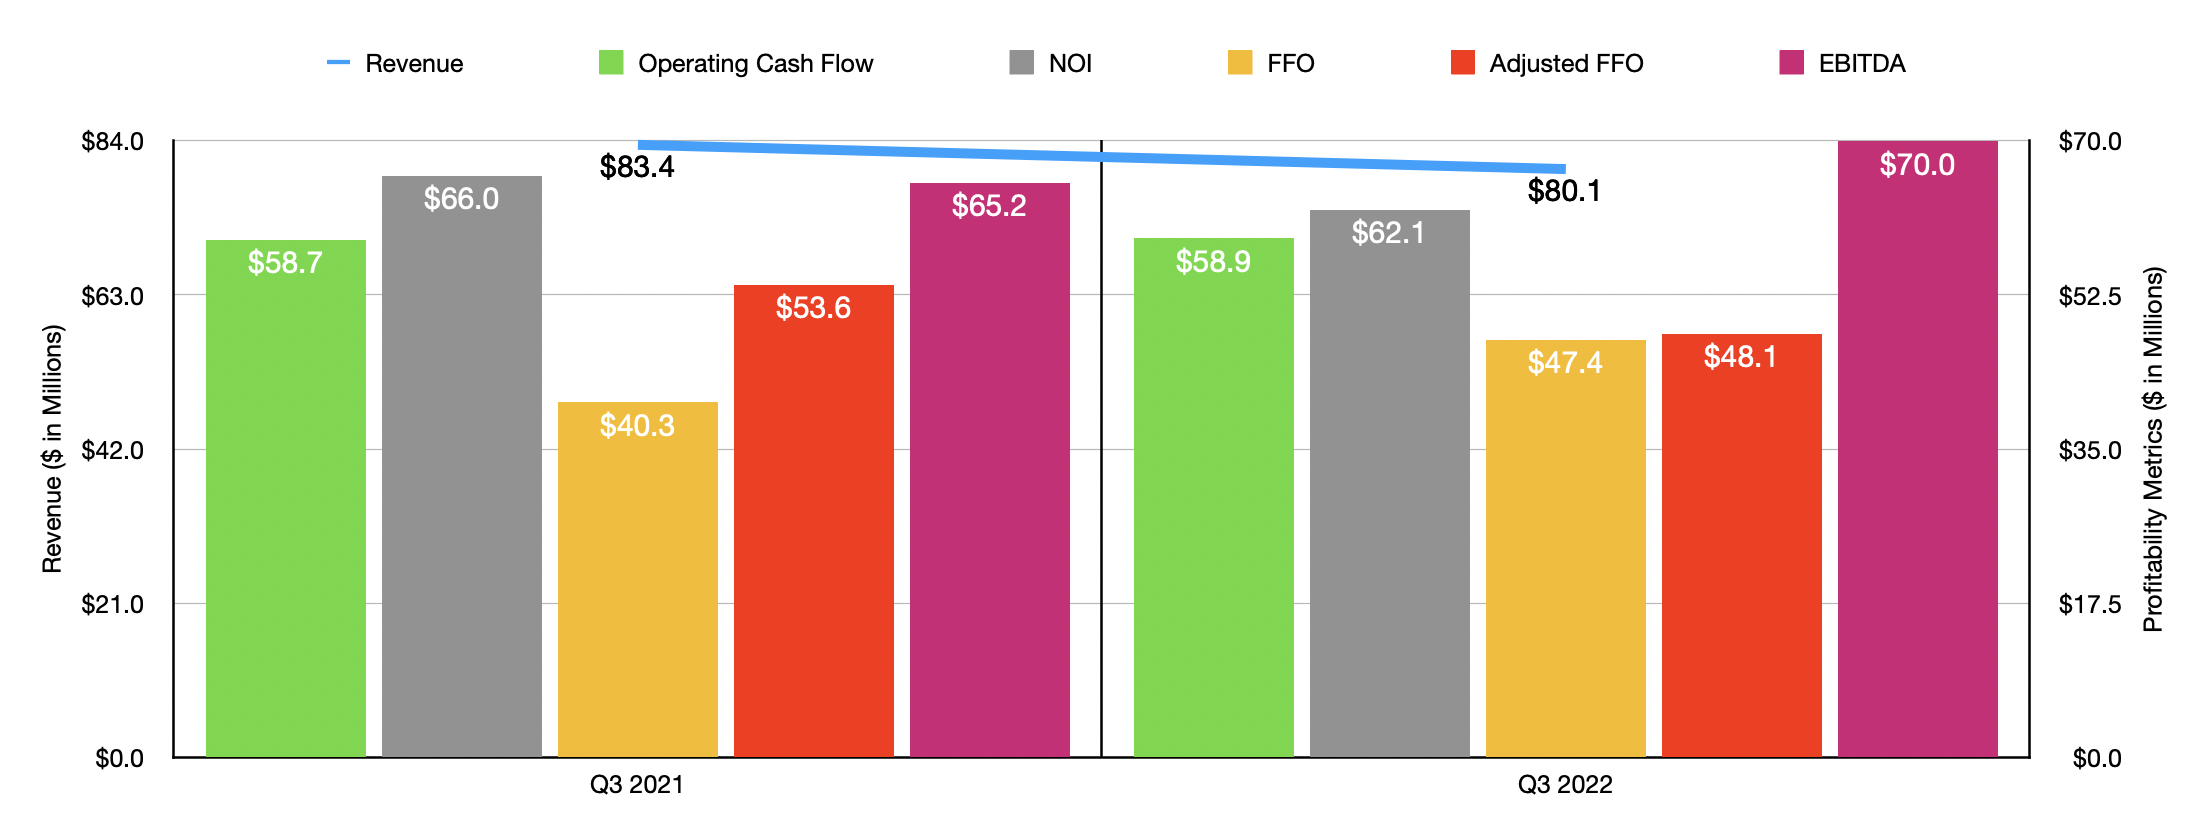
For the third quarter alone, revenue for the company came in at $80.1 million. This represents a decline of 4% compared to the $83.4 million reported the same time last year. What’s really interesting is that this occurred even as management continues to invest in growth initiatives in the nine months ending September 30th of this year, the company acquired three different properties for a combined $131.2 million. They also invested $70.6 million in six ongoing development projects, excluding any amounts invested from joint venture partners. The company also has $169.7 million that it still has to pay out for $515.8 million worth of development projects. The decline in revenue, then, was driven largely by property sales, including the recapitalization of its special purpose industrial portfolio that is now owned by MFG Cold JV.
If all we saw was a drop in revenue, I wouldn’t have such an issue. But we have also seen mixed profit figures. For instance, operating cash flow for the company has continued to increase, climbing from $58.7 million in the third quarter of 2021 to $58.9 million the same time this year. Over that same window of time though NOI, or net operating income, declined from $66 million to $62.1 million. FFO, or funds from operations, rose from $40.3 million to $47.4 million. But if we adjust for changes in working capital, it would have fallen from $53.6 million to $48.1 million. And finally, we also have EBITDA, which increased from $65.2 million to $70 million.
Author – SEC EDGAR Data
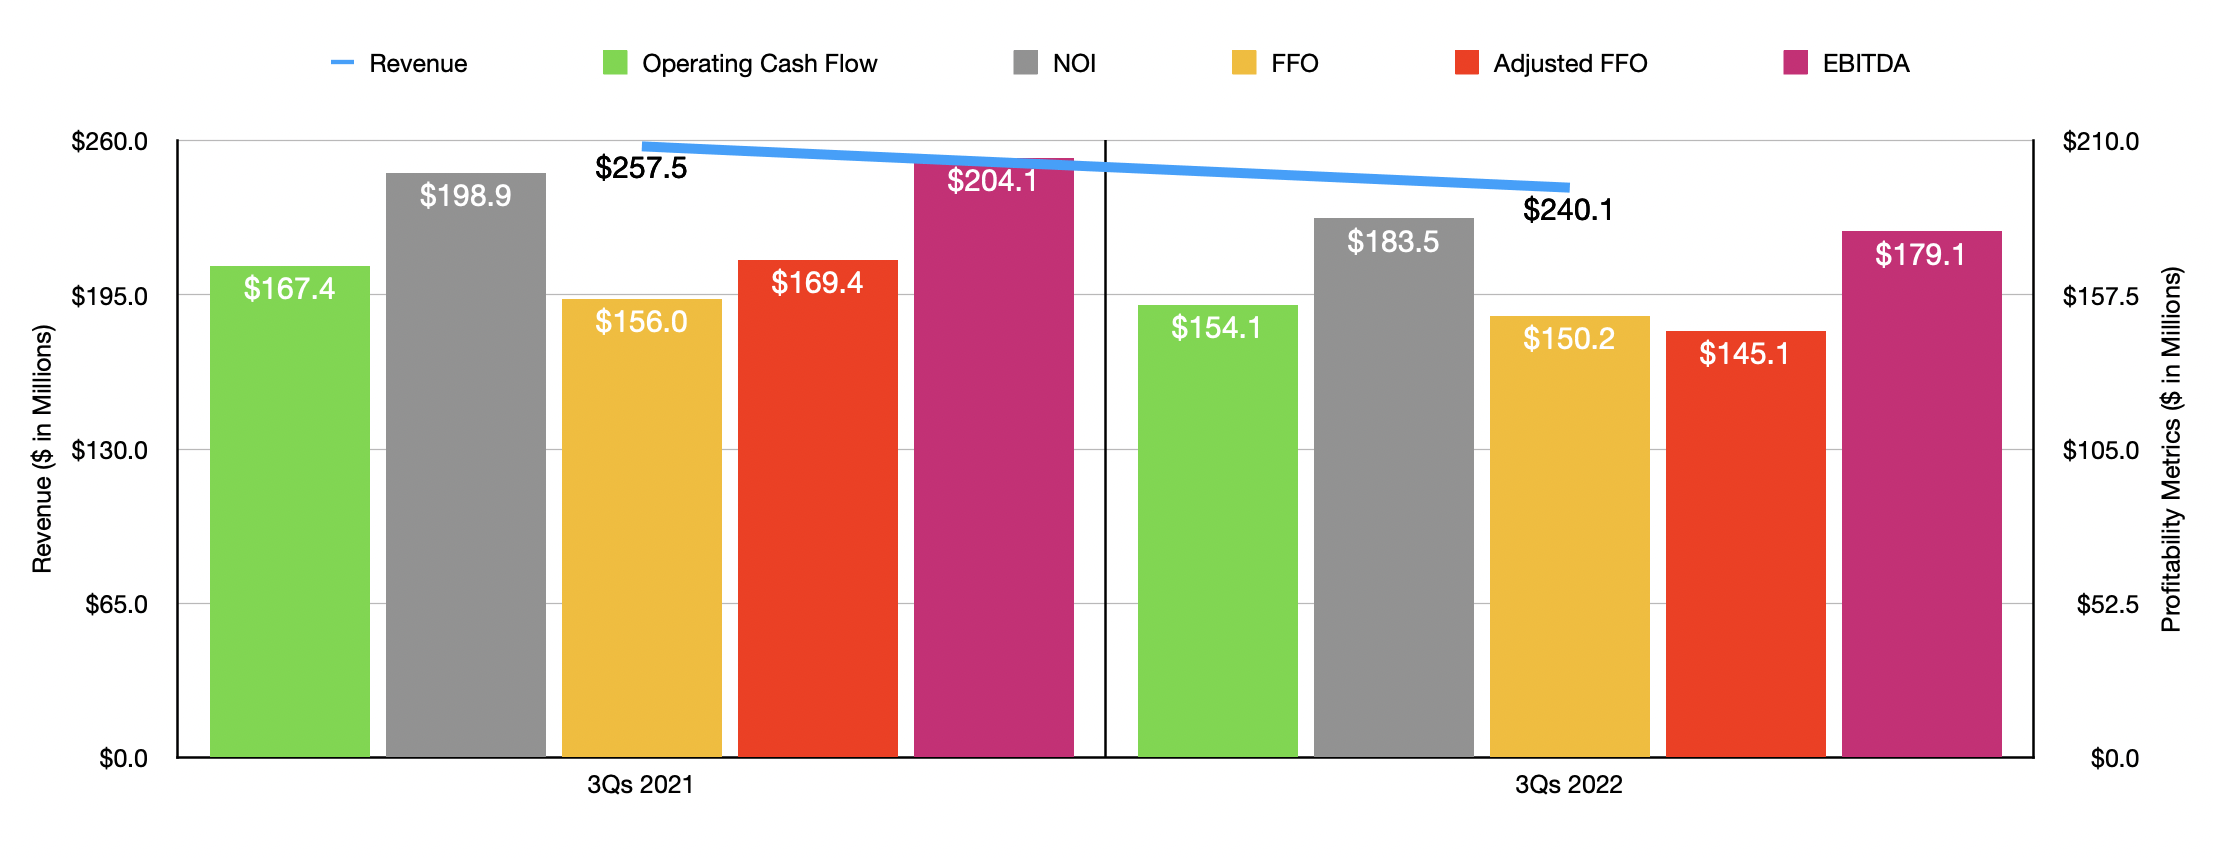
The third quarter was not the only quarter where we saw some uncertain and mixed results. For the first nine months of the 2022 fiscal year as a whole, that has been the name of the game. Revenue fell from $257.5 million in the first nine months of last year to $240.1 million the same time this year. We saw operating cash flow drop from $167.4 million to $154.1 million. As you can see in the chart above, other profitability metrics have followed suit. In fact, when looking at data for the first nine months of the 2022 fiscal year in its entirety, none of the profitability metrics showed an improvement year over year.
When it comes to the 2022 fiscal year in its entirety, management believes that the company would generate adjusted FFO of between $0.65 and $0.68 per share. Using the midpoint figures for this, it would translate to a reading of $185.2 million. That would represent a decline compared to the $223.2 million the company generated in 2021. If this is any indicator of what 2022 as a whole looks like, we should anticipate FFO of $200 million, operating cash flow of $202.8 million, NOI of $245 million, and EBITDA of $228.9 million.
Author – SEC EDGAR Data
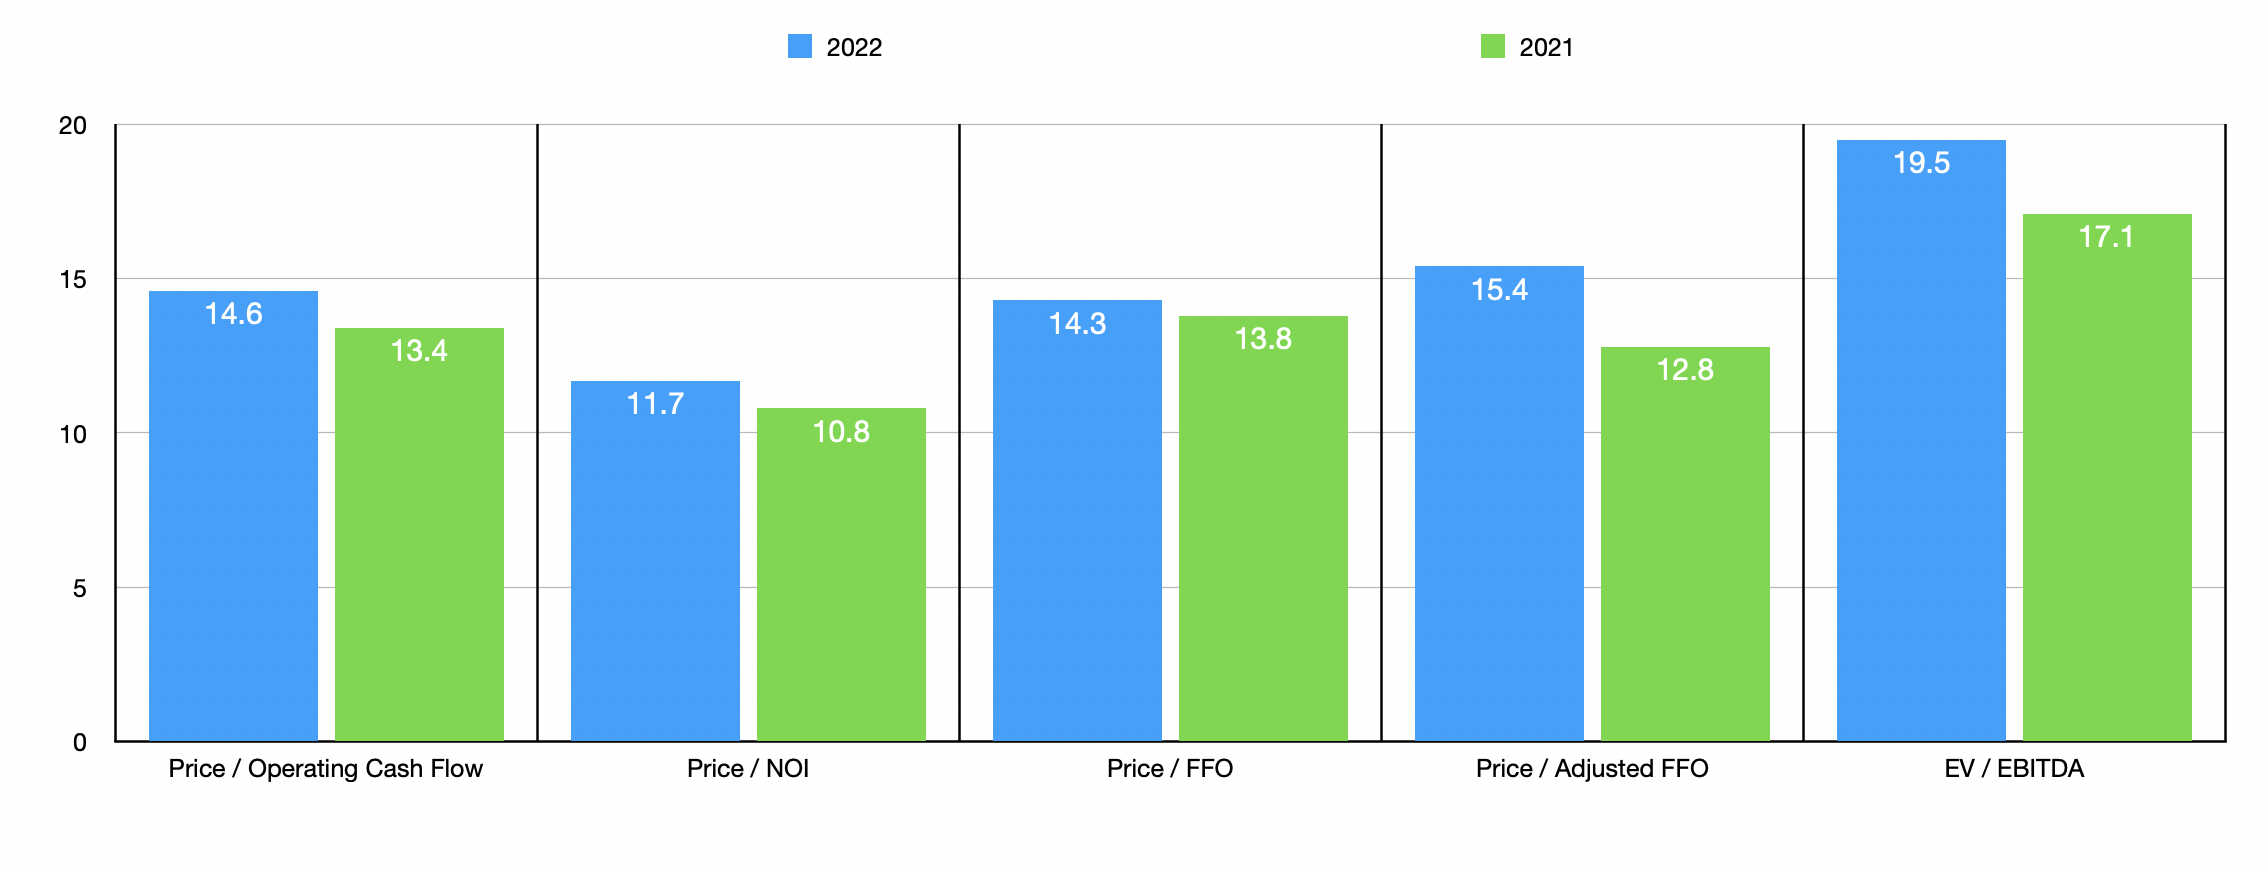
If we use these estimates, we can calculate that the company is trading at a forward price to operating cash flow multiple of 14.6. The price to NOI multiple should be lower at 11.7, while the price to FFO multiple should come in at 14.3. On an adjusted basis, the latter of these should be a bit higher at 15.4, while the EV to EBITDA multiple should be roughly 19.5. As you can see in the chart above, each of these represents a worsening compared to what the company would be priced at if we used data from 2021. Also as part of my analysis, I compared the enterprise to five similar businesses. On a price to operating cash flow basis, these companies ranged from a low of 2.5 to a high of 31.1. And using the EV to EBITDA approach, the range would be from 15.1 to 41.5. In both of these cases, three of the five companies are cheaper than our prospect.
| Company | Price / Operating Cash Flow | EV / EBITDA |
| LXP Industrial Trust | 14.6 | 19.5 |
| Innovative Industrial Properties (IIPR) | 14.2 | 16.2 |
| Terreno Realty Corporation (TRNO) | 30.8 | 20.7 |
| Industrial Logistics Properties Trust (ILPT) | 2.5 | 41.5 |
| Plymouth Industrial REIT (PLYM) | 9.3 | 18.0 |
| INDUS Realty Trust (INDT) | 31.1 | 15.1 |
Takeaway
When it comes to REITs, LXP Industrial Trust is anything but a bad prospect. The company has successfully generated solid results in prior years and the long-term outlook for the firm should be positive. Having said that, I think the stock looks more or less fairly valued compared to similar firms and I don’t like to see the weakness that we have seen recently. Because of these reasons, I’ve decided to lower the company once again to a ‘hold’.
Be the first to comment