

Sezeryadigar/iStock via Getty Images
Dear Friends & Partners,
Our investment returns are summarized in the table below:
|
Strategy |
Month |
YTD |
12 Months |
24 Months |
Inception |
|
LRT Economic Moat |
+7.38% |
-34.16% |
-32.02% |
+2.51% |
+19.55% |
| Results as of 10/31/2022. Periods longer than one year are annualized. All results are net of all fees and expenses. Past returns are no guarantee of future results. Please contact us if you would like to receive a full performance tear sheet. Please see the end of this letter for additional disclosures. |
|
Investment Terms and Service Providers |
|
|
Investment Structures: |
Delaware LP BVI Professional Company |
| Management Fee |
1% |
|
Performance Fee: |
20% |
|
High Water Mark: |
Yes |
|
Lockup: |
None |
|
Minimum Investment: |
$1,000,000 |
|
Redemption: |
Monthly, 30-day notice |
|
Auditor: |
EisnerAmper LLP |
|
Prime Brokers: |
IBKR |
|
Custodian: |
IBKR |
|
Fund Administrator: |
NAV Consulting |
|
Legal Counsel: |
Winston & Strawn LLP O’Neal Webster (BVI) |
|
Compliance: |
IQ-EQ (Blue River Partners) |
October’s results were strong, and I expect continued good results in the months ahead. Most importantly during the month we saw strength in our portfolio, while highly speculative companies (such as Twilio (TWLO), Atlassian (TEAM), Datadog (DDOG) and Snowflake (SNOW)) continue to decline. This is a marked difference from the months earlier in the year when all stocks declined together irrespective of their business quality.
As of November 1st, 2022, our net exposure was approximately 88.52%, and our beta-adjusted exposure was 55.01%. We currently have 56 long positions with the top 10 accounting for approximately 38.97% of our total long exposure.
I continue to focus on our portfolio companies and the execution of our investment process despite the short-term volatility. I expect strong returns ahead and my confidence is based on the strong operating performance of our portfolio companies which continue to perform well. It is only a matter of time until our monthly results catch up to the underlying fundamentals of our investments.
Year-to-date results have been below my expectations, but I remain confident in the long-term strategy. This is not to say that I have never made mistakes in selecting investments. It is important to admit publicly to one’s mistakes in the spirit of maintain intellectual honesty. For example, during 2021, I had made investments in Roku, Inc. (ROKU), Sea Limited (SE), Coupa Software Incorporated (COUP) and Cardlytics, Inc. (CDLX). There were specific reasons for each investment and all these holdings were disposed of between December of last year and January of this year. Altogether these positions were small (under 5% of our capital), but I for one do not want to pretend (as so many investors seem to do), that I never make mistakes. I believe the most important thing when making a mistake is to analyze it, correct it and learn from it. During this year, I have made several improvements to our investment process, and it because of these improvements that I can say with confidence: the future is bright. I will be discussing both the mistakes made over the last two years and the improvements made to our investment process in next month’s letter.
Murphy USA, Inc. (MUSA)
We currently hold an approximately 3.5% position in Murphy USA, Inc., and wanted to tell you more about this portfolio holding. This section was written by our intern Tin Nguyen, who is a junior at the University of Texas at Austin, with light edits by me.
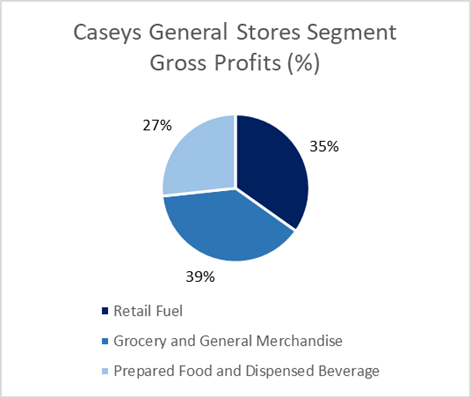
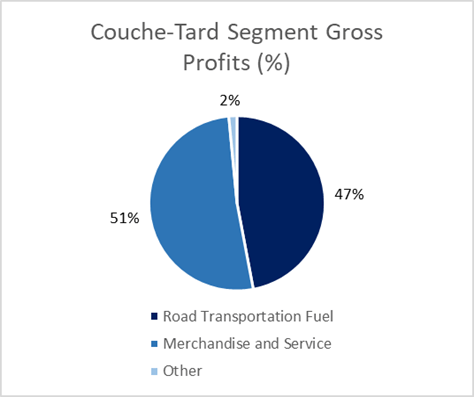
Murphy USA is a fuel marketer, operating both gas stations and wholesale fuel distribution. The company also has a merchandise business segment where they sell typical convenience store items such as tobacco, energy drinks, and snacks. However, unlike many convenience stores, or C-Stores, the bulk of their gross profit comes from their retail fuel segment. In FY 2021, Murphy USA’s fuel contribution made up 62% of their gross profit while only 38% came from their merchandise contribution1. By comparison, competitors such as CASY and Couche-Tard (OTCPK:ANCUF, Circle K) (pictured on the right) derive roughly 65% and 51% of their gross profit from convenience store sales and only 35 % and 47% from fuel, respectively.2,3
Murphy USA became public in 2013 after Murphy Oil spun off its downstream energy business. The company primarily operates a kiosk model, or a C-store with low square footage dedicated to the store, many times only having 400 square feet of store area. By comparison, a typical Casey Store is 2,450 sq ft. for their larger store designs and 1,350 sq ft. for the rest of their smaller store designs4. Historically, Murphy USA has had a partnership with Walmart (WMT) where the majority of their Murphy USA branded stores are located in Walmart parking lots, with Murphy USA owning the underlying real estate.
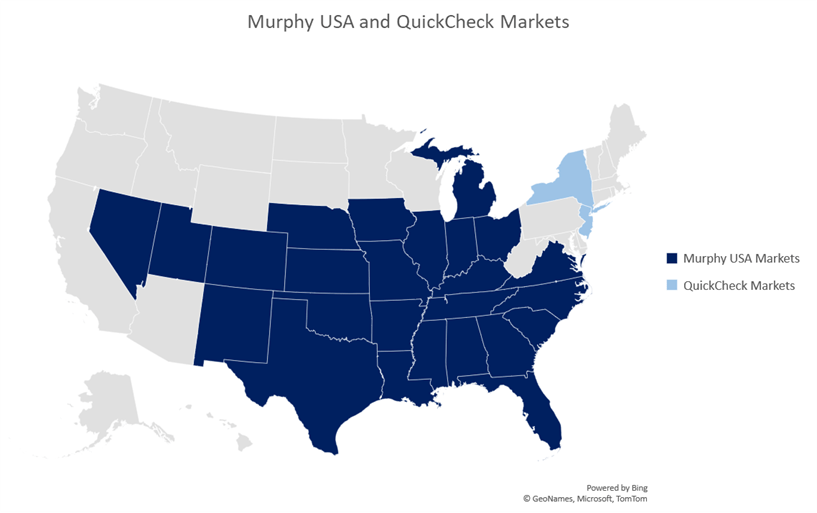
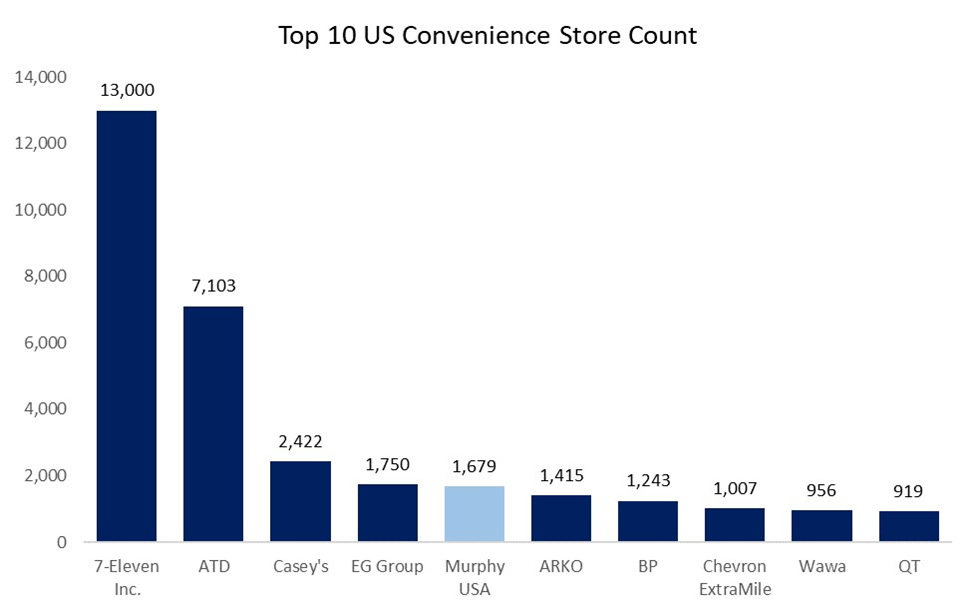
The company operates primarily in the Southeast, Southwest, and Midwest of the United States, and is one of the largest C-store chains by store count in the US.
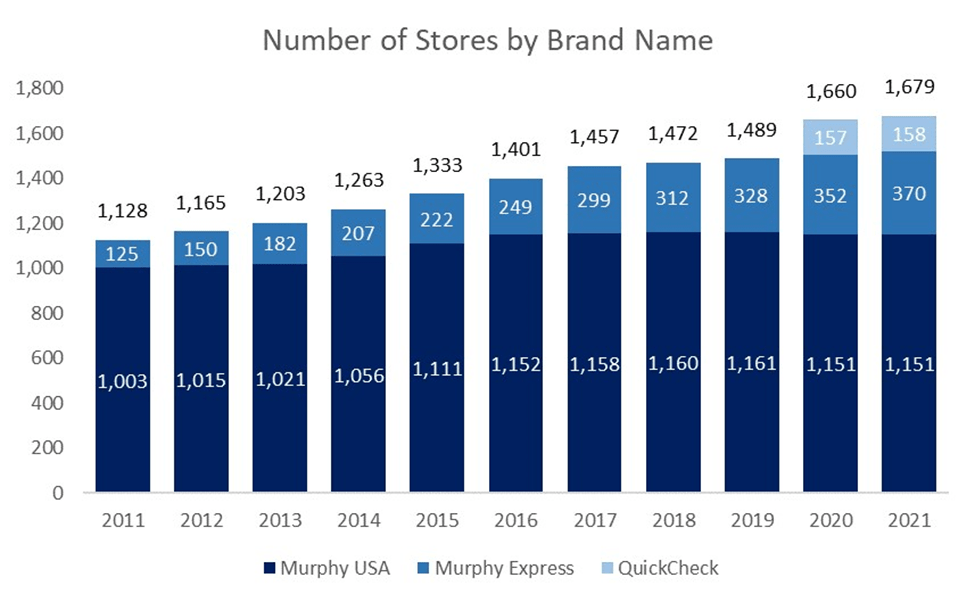
As of December 31, 2021, Murphy USA had 1,679 stores, which were split into three different brand names: Murphy USA with 1,151 stores, Murphy Express with 370 stores, and QuickChek with 158 stores. The Murphy USA brand has the most store locations and is nearly all located near Walmart stores as mentioned. Murphy Express refers to its independent standalone stores. They also operate more traditional, larger C- stores with a fuel retail segment under the brand name QuickChek, which they acquired in early 2021, and which are located in New Jersey and New York.
Murphy USA operates a low-margin, high-volume retail model rather than focusing on the merchandise segment like many C-Stores. Their unique business strategy has led them to great success in many different economic environments.
MUSA Retail Fuel Margin
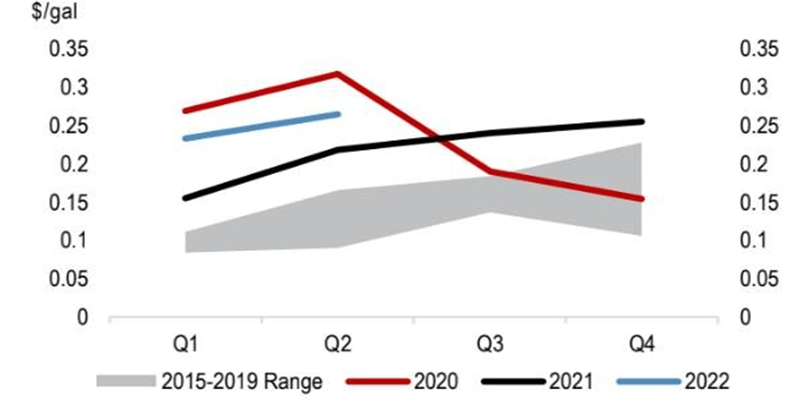
For example, during the COVID pandemic, fuel volumes across the industry dropped sharply. MUSA was able to offset this drop in volumes through gains in its fuel margins, which increased to ~23c/gal up from ~14c/gal from 2017-2019. This heightened level of fuel margins has remained higher than in previous years even as fuel volumes recovered. We expect retail fuel margins to remain high in the United States due to tight refining capacity, some of which gets captured by the retailers. Given the hostility of the current US administration to the oil & gas industry, we do not expect large amounts of new investment in the oil & gas sector in the near term. This in turn should keep margins high for incumbents.
From before the pandemic, during the pandemic, and even in today’s environment of high inflation and uncertainty, Murphy USA has been able to grow free cash flows despite rising fixed costs in the industry and volatile crude oil prices. We see Murphy USA as a strong long-term investment, with a management team dedicated to returning capital to shareholders, diversified growth opportunities, and proven resilience in the face of uncertain economic conditions.
The C-Store and Retail Fuel Industry
The convenience store, or C-store, and retail fuel industry in the United States is fragmented, consisting of a large number of companies that each control a small portion of the total market. According to the National Association of Convenience Stores, or NACS, in the United States in 2022, there were 148,026 C-stores, of which, 116,641 sell fuel. And of this number, about 95% of them are owned by independent companies rather than large, major oil companies. However, in more recent years, the industry has been consolidating as the number of single-store operators continues to drop. In 2021, about 55% of the C-stores that sell fuel are single-store operators, which has declined from about 63% of single-store operators in 2017.7
While the major oil companies only own a small portion of the number of US C-stores, about half of the fueling sites in the US carry a major oil company’s brand, such as Chevron (CVX), Exxon (XOM), or Shell (SHEL). Usually, single-store operators have fuel supply agreements and licenses with refiners or distributors that market fuel from major oil companies. The rest of the outlets solely carry unbranded fuel. The main difference between unbranded fuel and branded fuel is that branded fuel contains additives such as antioxidants and detergents. All fuels sold to consumers, however, must meet federal and state regulations, so it already has a set number of additives added, but just not an additional number of additives like branded products. For this reason, branded fuel products usually sell at a small premium to stores of about 5 to 15 cents per gallon compared to unbranded products. Murphy USA gets both branded fuel and unbranded supply from numerous sources, including almost all major oil companies that operate in the US, independent refiners, and other marketers.
There is an overlap between fuel distributor companies and C-store chains, though not always. Many companies that do business within the C-store industry also have operations in fuel distribution too, and Murphy USA is no different. The company sells fuel to retail customers at their C-stores and sells fuel to other dealers. These companies act as marketers for fuel products from upstream sources including major branded fuel from large companies like Chevron and Shell or from independent refiners. They transport fuel from terminal locations, where the fuel is temporarily stored, to the final location where it is then dealt to retail customers. And as C-store operators, they operate within the physical store.
There are multiple types and combinations of C-store ownership and operation structures within the industry, but the details of these structures are more important for companies that deal more with wholesale fuel distribution. Murphy USA operates all their locations, so the only factor left to analyze is the company’s real estate ownership, where they can choose to either rent the property or purchase the real estate. Rent expense is usually a large part of a company’s operating expenses, and built-in lease modifiers can vary the amount of rent a company pays on the lease as interest rates change. However, Murphy USA is able to avoid most of the complications that come with this since a large proportion of the company’s total stores are Company-owned. As of December 31, 2021, 77% of Murphy USA’s stores are Company-owned, meaning they do not incur any rent expense on these properties.8
Competitive Landscape and Consolidation
By nature of the business, most of the costs are variable, like gasoline and the physical merchandise within the store. As mentioned before, the C-store industry is highly fragmented. Of the roughly 150k C-stores in the US, the top 10 largest C-store companies by count make up only about 31,000 stores or about 20% of the total market share. The C-store business does not have high barriers to entry, but we believe it has a high barrier to success and consistent profitability. If an individual wanted to, they could rent a C-store site and set up a fuel supply agreement with a distributor, and simply operate the inside for not much upfront cost if they rent. This is why 55% of C-stores in the United States are single-store owners.
Despite high variable costs and low upfront costs, however, the industry has been consolidating for years now, as large companies are better able to handle what has generally been a trend of rising fixed costs. Companies with large operations can do much better than independent store owners due to economies of scale. We believe that the larger the business, the more negotiating power they have over fuel prices from suppliers, and they have an option to offer a loyalty program to increase customer loyalty. Single-store operators could never have that option. Furthermore, we believe that as the fixed costs of operating in the industry continue to rise (primarily rent and labor expenses), industry consolidation will continue.
Revenue Sources – Marketing and Merchandise
There are two main sources of revenue for C-stores in general: fuel sales and in-store sales, also known as “inside sales”. Or using Murphy USA’s terminology: marketing and merchandise. Starting off with Murphy USA’s marketing segment, they split their petroleum sales into retail petroleum sales and wholesale petroleum sales, the former making the majority of their total marketing segment sales. The retail segment refers to the direct selling of fuel to retail customers at the pump. They also market to other fuel dealers through their wholesale segment, where they distribute them through a combination of Company-owned and third-party terminals.
General C-store inside products includes items such as ice, beverages, tobacco products, prepared foods, and snacks that all yield much higher margins than fuel. For this reason, the majority of C-stores use their fuel retail segment as a means to attract customers into the store, where they can reap much higher margins when the customers go inside. Contrary to the typical convenience stores that look to have small fuel profit margins but strong inside profit margins, Murphy USA does not make as much profit from this segment as their marketing segment. In FY 2021, their merchandise sales made up only 21% of their total sales, however, like other C-stores, merchandise still had a much higher margin at 19% compared to petroleum’s margin of only 6.5%.11
The largest driver of C-store inside sales are cigarettes and other tobacco products. These products are sold overwhelmingly at C-stores. Around 88% of all cigarettes and 95% of all other tobacco products sold in the United States are sold through the C-store channel.12 Unsurprisingly, Murphy USA’s largest merchandise segment sales were tobacco and other tobacco product sales.
Proximity to Walmart and Murphy Drive Rewards
One of Murphy USA’s greatest strengths is its proximity to Walmart stores which allows them to bring consistent, high-volume traffic indirectly to Murphy USA locations. They are also on Walmart+’s discounted fuel program, which includes a fuel discount on gas stations including Murphy USA and Murphy Express locations. The Company also offers Murphy Drive Rewards, a loyalty program that offers a discounted price on fuel and occasional deals on snacks and drinks based on how many gallons of gas the customer buys. They have about 100,000 customers who are a part of their Murphy Drive Rewards program.
Inflation and Volatility Pressures
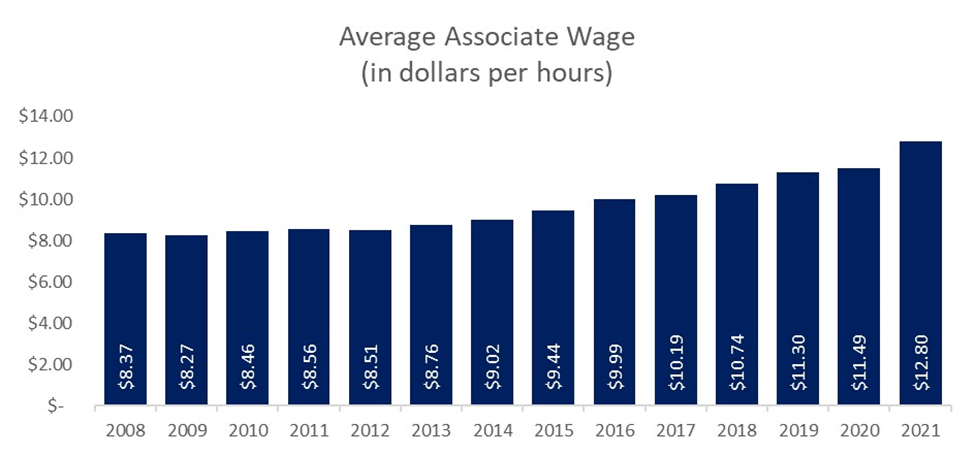
In the current economic environment, there has been broad inflation across all parts of the economy. Wages have increased, oil prices are volatile, and in an attempt to control inflation, the Federal Reserve has conducted several interest rates hikes that are expected to last until the end of the current year. With higher interest rates, leases can become more costly. All of these rising cost pressures put heavy costs on C-stores that have a high number of employees, and those that lease their property. Murphy USA mitigates the rising cost pressures well compared to other C-stores because the company owns the majority of its stores and operates primarily smaller store formats which require less staff.
Consumers are very sensitive to price changes on the upside and less so when prices are comparatively lower. As noted by Andrew Clyde, Murphy USA’s CEO during their 2022 2nd quarter earnings call: “consumers just aren’t as price-sensitive on the margin when prices get lower. As long as we’re in a higher price environment and their paychecks are impacted by inflation across everything that they buy, it’s a great environment to gain those customers and create stickiness.”13 Because of Murphy USA’s unique business model, during high price environments and volatility, Murphy USA is able to sell their fuel at lower prices than their competitors, which has a greater effect when customers get more price conscious.
The current economic environment is uncertain, with many feeling like a recession is imminent, but there is historical evidence of Murphy USA’s success during such uncertain conditions. Throughout fiscal years 2019, 2020, and 2021, Murphy USA has increased gross profit and net income in all three years despite taking a significant hit on top-line volumes due to the pandemic when people drove much less.
The company’s kiosk model, a high proportion of store ownership, and reliable customer traffic all allow Murphy USA to reduce operating costs and mitigate the threat of macroeconomic conditions like higher interest rates or recessions, and ultimately offer lower gas prices compared to competitors. During times of uncertainty, high gas prices, and higher consumer price elasticity, Murphy USA is able to offer comparatively cheap fuel without needing to widen margins as much as single-store operators on fuel since they have such high volume. This being said, the Company was still able to increase fuel margins to much higher levels than before COVID and bring in record profits on their fuel segment.
Murphy USA’s performance during the pandemic is a strong indicator of the robustness of the company’s business model.
QuickChek
On January 29, 2021, the Company acquired QuickChek, a New Jersey gas station chain with 156 stores, as a means to expand its operations into the Northeast. QuickChek operates with a more traditional C-store model with larger stores than the rest of Murphy USA. QuickChek offers traditional C-store inside products with higher margins like food and beverages. QuickChek’s stores are much larger than Murphy USA and Murphy Express branded stores, where the “New-to-Industry” (NTI) locations average between 5,000 to 7,000 square feet in size. This has been Murphy USA’s only acquisition since it was spun-off from Murphy Oil in 2013.
Debt Levels and Sale Leasebacks
Murphy USA has kept a stable level of debt. Their Total Debt / LTM EBITDA ratio was around 2.2, which is a healthy level. For comparison, competitors had a slightly lower ratio: Couche Tard has a ratio around 1.8 and Casy’s ratio is about 2.0.15 But what isn’t reflected on MUSA’s balance sheets is the current valuation of the land they own. As mentioned before, as of December 31, 2021, The Company owns about 77% of their stores, a significant amount. A lot of these properties were purchased long ago for prices much cheaper than what they are worth today. There is significant value in their land and potential possibility for Murphy USA to conduct several sale-leasebacks to unlock significant amounts of cash to buy back shares.
Capital Allocation16
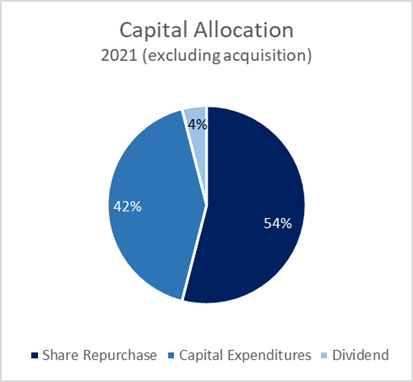
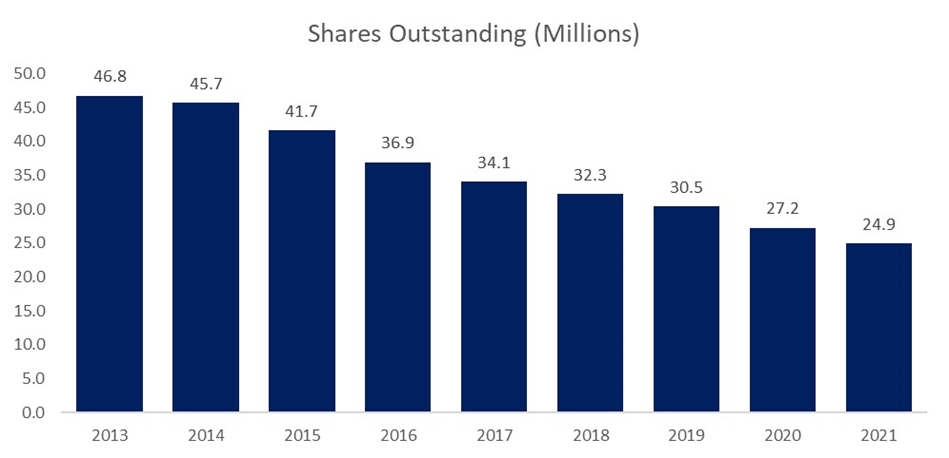
Capital investments within their marketing segment are largely devoted to acquiring land and the construction of new stores. A small amount of their total capital expenditures is put toward sustaining their current stores. Outside of capex, Murphy USA spends a significant amount of capital on share buybacks. Excluding the acquisition of QuickChek, in FY 2021, they spent more than half of their capital on share buybacks. And this pattern extends to past years too. Since going public in 2013, they have repurchased 23.4 million shares out of its 46.7 million issued. In their latest earning call, Andrew Clyde stated that “share repurchase continues to be [their] preferred use of free cash flow”, and management is clear that they want to continue buying back shares rather than most M&A opportunities that they view as inferior to their existing network given the premium, they would have to pay to acquire them.17
Tobacco Legislation Risk
There is a potential risk of future legislation against the tobacco industry. There has already been legislation in the past in 2019 when the government raised the federal minimum age for the sale of tobacco products for people aged 18 to 21 years. And more recently too in June, the FDA stopped Juul from selling and distributing its products. Tobacco makes a significant portion of C-stores’ inside sales, and Murphy USA is no exception even if they have a smaller merchandise segment.
Future Industry Outlook & EV Adoption
A threat to the C-store industry is the gradual adoption of mainly electric vehicles rather than gas vehicles. In general, cars are becoming more efficient, and electric vehicles have become more and more popular. However, we believe that the transition to electric vehicles on a substantial scale is much further away than many believe. For widespread adoption, the prices and insurance costs for EVs need to decline substantially, something that appears very far on the horizon especially given the recent dramatic increases in the price of lithium.
Today, the leading country for electric vehicle adoption is Norway. In 2020, there were 81 EVs per 1,000 people in Norway, more than twice as much as the following country, Iceland, with only 37 EVs per 1,000 people.19 But this widespread adoption within the country has not been a result of pure free market forces. The country has reached this level largely due to numerous government initiatives put in place to reduce the cost and increase the convenience of owning an electric vehicle. The Norwegian government placed a goal that all new cars sold by 2025 will be zero emission vehicles (either battery electric or hydrogen). Initiatives for EVs such as higher taxes for high emission cars and lower taxes for EVs, no charges on toll roads, access to bus lanes, and free municipal parking have given drivers high incentives to switch to EVs. Norway has also invested in building a charging infrastructure across the country. For quicker widespread adoption, more countries would need to implement legislation as aggressive as Norway’s incentives, something we do not see as likely.
Sales and EBITDA Growth
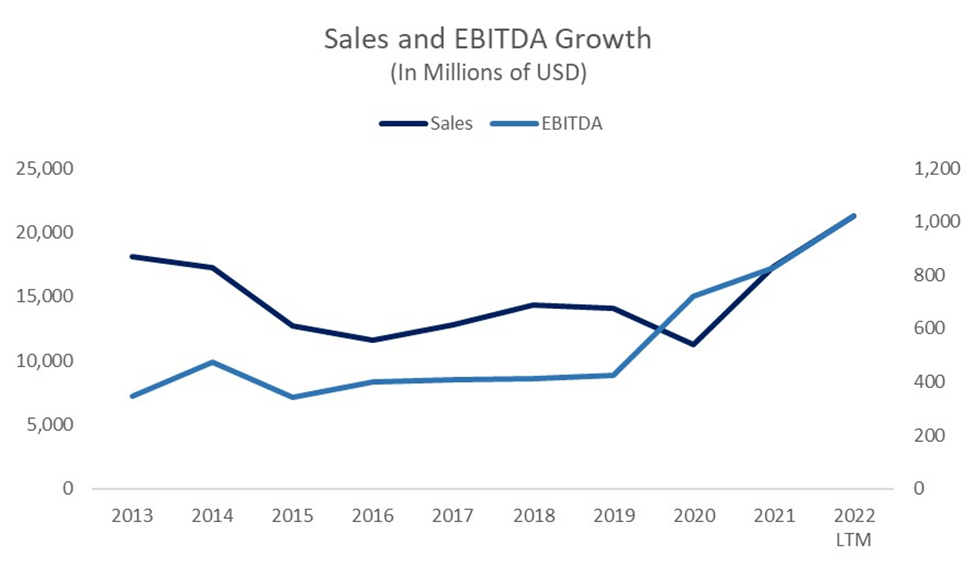
Murphy USA’s revenue has fluctuated since the Company went public, growing only at a 1.8% CAGR over the last 9 years. In comparison, the Company’s EBITDA has substantially increased, growing at a 12.8% CAGR from $347 million to $1.02 billion in the last twelve months ending in June 2022. Long term fuel margins remain the key driver to the company’s profitability, and we expect them to stay elevated in the years ahead.
Conclusion
In a landscape where new businesses in emerging industries are constantly pushed to innovate, invent, and change themselves in order to survive, the gas station business has innovated in its own ways too, but the fundamental operations have remained simple. Likewise, value in investing doesn’t necessarily come from the companies with the most growth potential in the most exciting industries. Even within a “declining” or flat industry, value can still be found. Retail fuel has played and will continue to play a critical role in maintaining the integrity of the transportation ecosystem. We see Murphy USA as a particularly strong long-term investment within the retail fuel industry. With a management team dedicated to returning capital to shareholders, diversified growth opportunities through its acquisitions, and tested resilience in the face of uncertain economic conditions, Murphy USA remains one of our favorite investments.
Our Portfolio
The top ten investments in our portfolio as of 11/1/2022, in order of position size, are presented on the following pages. All valuation metrics and returns are as of 11/1/2022 unless otherwise stated.
The table below gives additional insight into our portfolio exposure. We continue to be dramatically underexposed in technology, communication, financials, and utilities, while being overexposed in industrials, consumer cyclicals and real estate. These sector weightings are an outcome of where we currently see opportunities, and not a top-down decision based on macro predictions. We will happily own many technology companies if their valuations become more attractive.
|
Portfolio Statistics as of 11/1/202221 |
|||
|
Sector Allocations (Long Exposure, %) |
|||
|
S&P 500 Sector |
Portfolio |
S&P 500 |
Delta |
|
Consumer Cyclical |
26.01 |
10.59 |
15.42 |
|
Industrials |
22.42 |
8.69 |
13.73 |
|
Technology |
11.65 |
23.60 |
(11.95) |
|
Healthcare |
9.54 |
15.42 |
(5.88) |
|
Financial Services |
7.25 |
13.61 |
(6.36) |
|
Real Estate |
5.98 |
2.74 |
3.24 |
|
Basic Materials |
4.83 |
2.27 |
2.56 |
|
Communication Services |
4.46 |
7.36 |
(2.90) |
|
Consumer Defensive |
3.95 |
7.38 |
(3.43) |
|
Energy |
3.91 |
5.37 |
(1.46) |
|
Utilities |
– |
2.97 |
(2.97) |
|
Market Cap Allocations (%) |
|||
|
Large |
37.44 |
||
|
Mid |
49.89 |
||
|
Small |
12.68 |
||
|
Country Allocations (%) |
|||
|
United States |
93.83 |
||
|
Canada |
3.71 |
||
|
Denmark |
2.45 |
||
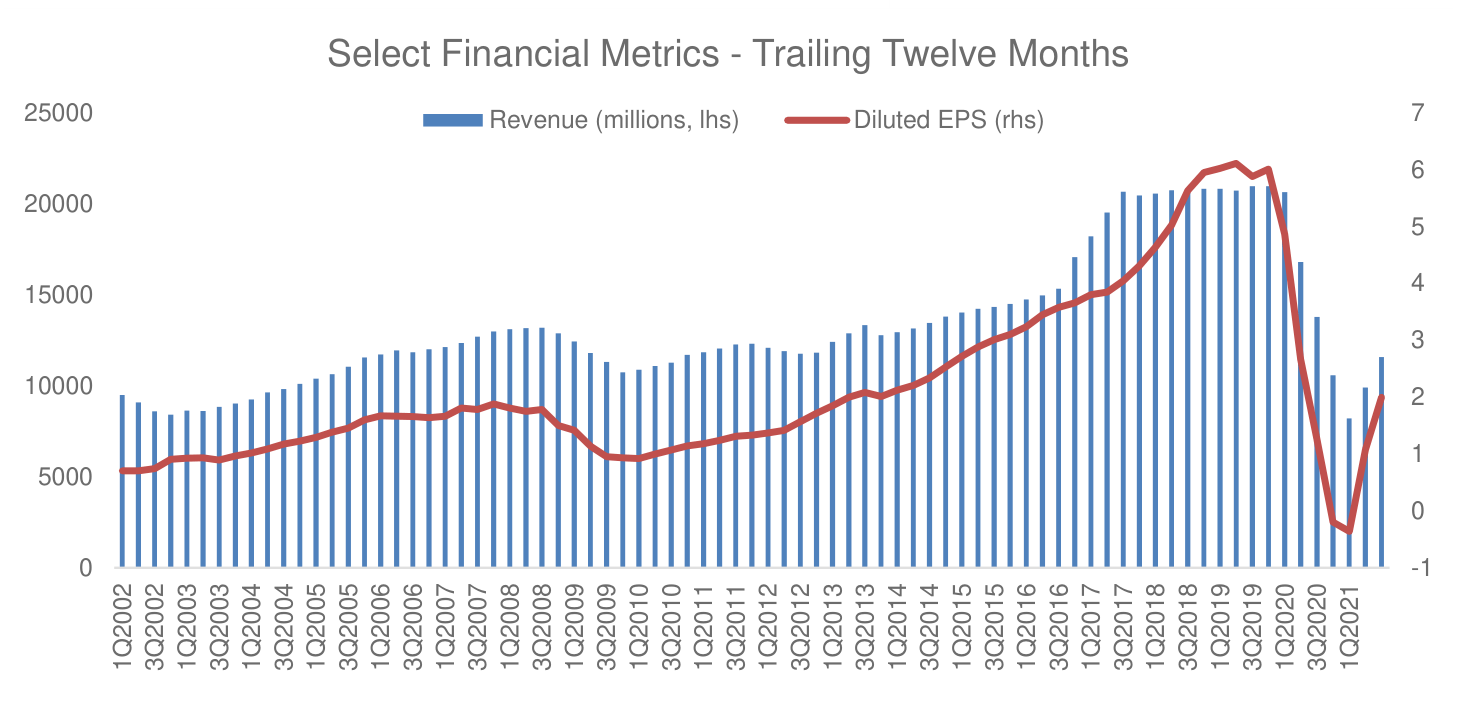
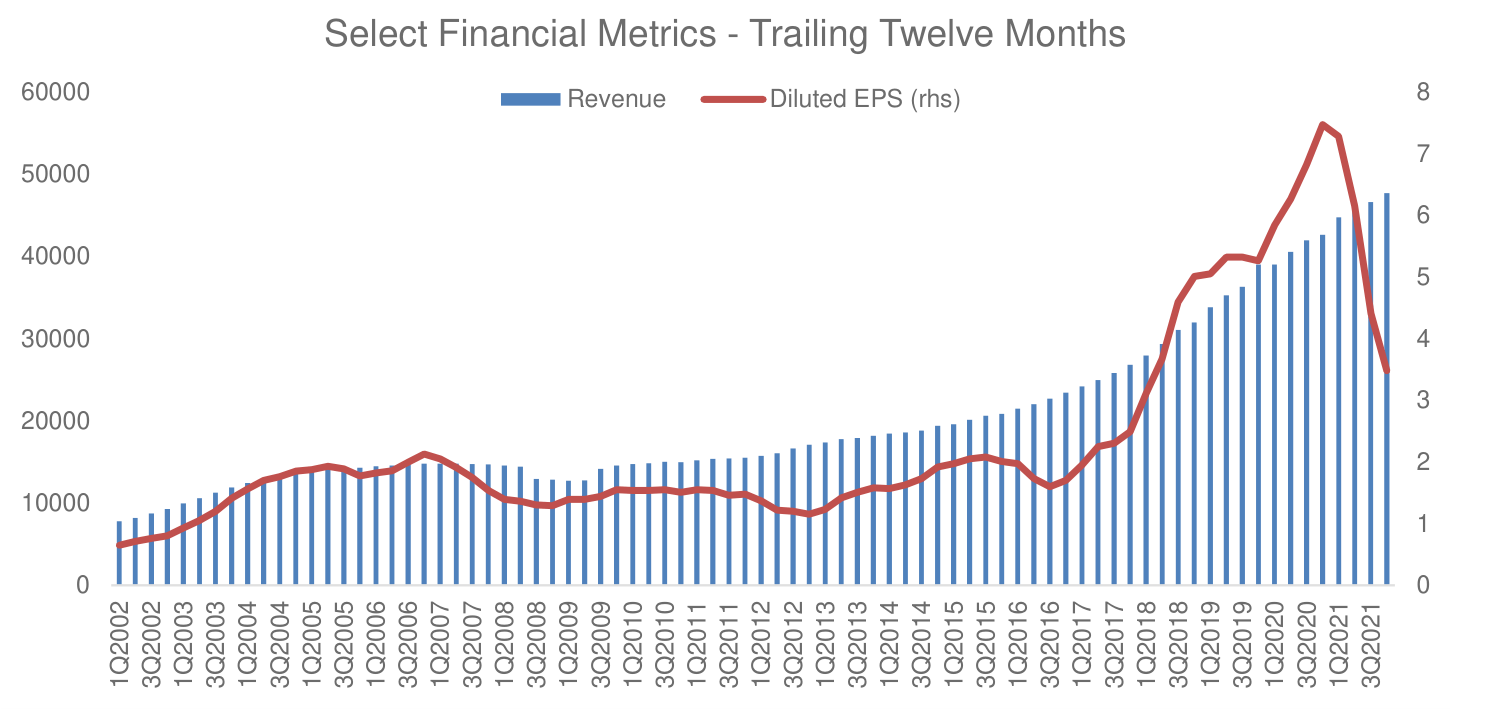
#1 – Northrop Grumman Corporation (NOC)
Based in Virginia, Northrop Grumman is one of the world’s largest defense contractors with annual revenue more than $30 billion. The company operates in a cozy oligopoly, that after decades of consolidation the US defense market is now controlled by five large companies: The Boeing Company (BA), General Dynamics Corporation (GD), Lockheed Martin Corporation (LMT), Northrop Grumman Corporation (NOC), and Raytheon Technologies Corporation (RTX).
Industry barriers to entry are immense, government procurement cycles are extremely long, and the consolidated industry structure reflects this. This industry structure has allowed Northrop to earn stable mid-teens returns on invested capital (ROIC) and grow earnings per share at a rate of over 13% per year in the past decade, despite a topline that has grown only in-line with inflation. Even after the recent run-up in the stock price, it trades at approximate 15x, next year’s earnings estimates, far below the S&P 500 index, despite being an above average company. While nominally, there are five major defense contractors, the true industry concentration is even higher because not all companies compete in all possible business segments. General Dynamics’ division submarine division, Electric Boat, is the sole supplier of nuclear power submarines in the United States. Lockheed Martin is the sole supplier of the F-35 and F-22. Northrop was the sole bidder on the contract to develop the next generation of intercontinental ballistic missiles; and so on.
The company’s revenue growth over the past decade has been mediocre but even that has led to impressive shareholder returns that have far outpaced the S&P500. What’s more, we believe that revenue growth may accelerate in the next few years. A lot of ink spilled every year about the “massive” U.S. defense budget22 that critics claim is “out of control”23. Given this, you might be surprised to hear that U.S. defense spending as a share of GDP is at the lowest level in recorded history,24 at a mere 3.8%. In other words, U.S. military spending could double and not be out of line with historical norms. While we are not calling for a new Cold War, given the global instability we are witnessing, it is not unreasonable to expect defense spending to grow faster than GDP over the next decade.
Select Financial Metrics – Trailing Twelve Months
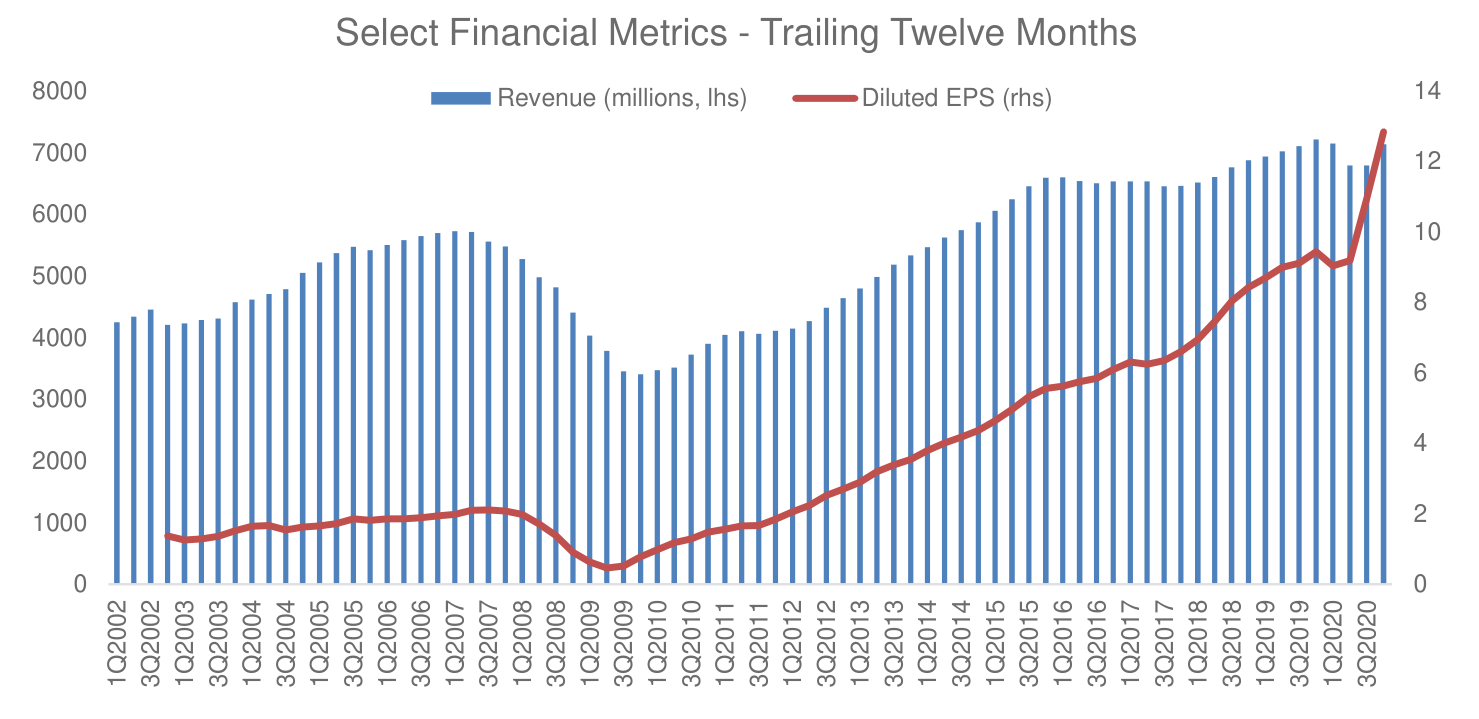
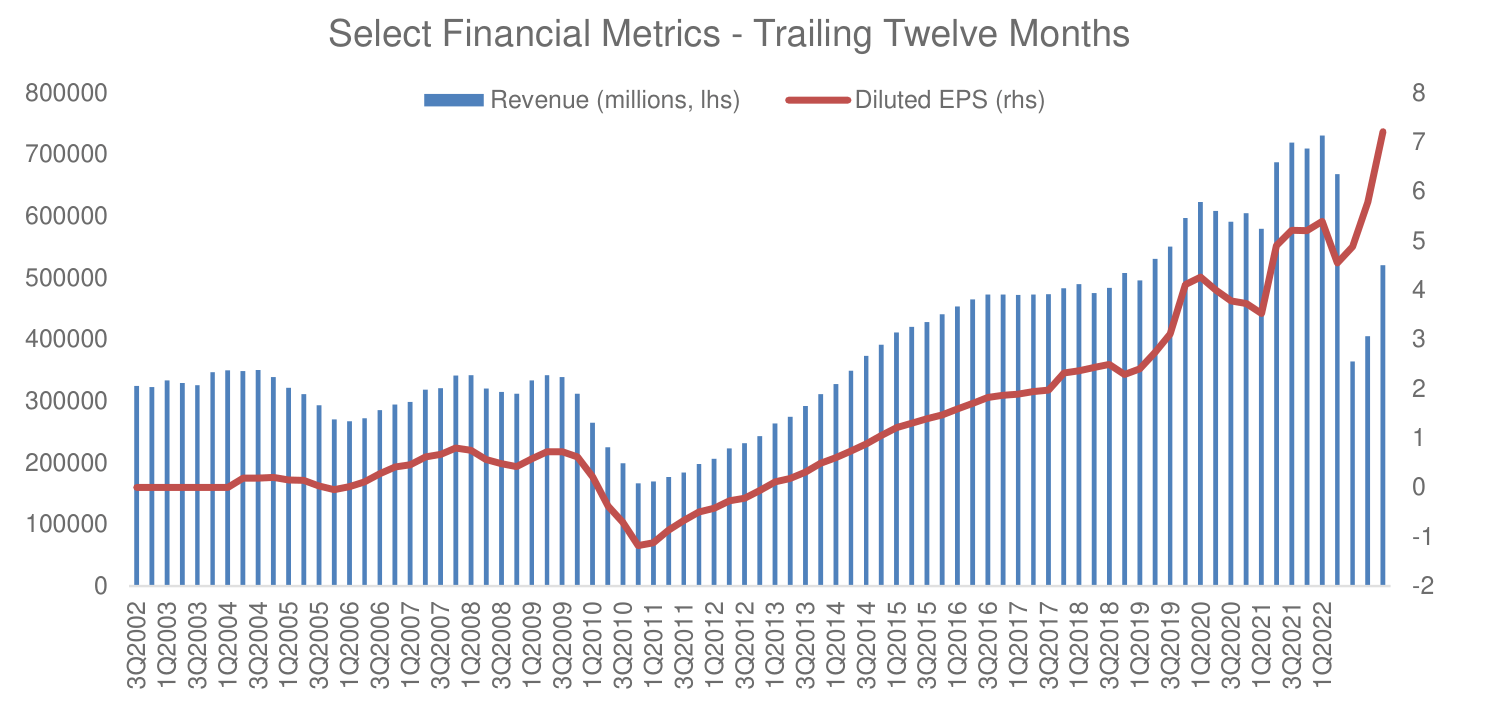
#2 – Domino’s Pizza, Inc. (DPZ)
Domino’s Pizza is the world’s largest franchisor of pizza restaurants with over 13,800 locations in 85 countries. As for any restaurant operator, the key metric to consider for Domino’s Pizza is same-store-sales (SSS) growth. Growing same-store-sales are ultimately how a restaurant business increases earnings from its existing assets. The company continues to impress in this criterion with SSS having grown in the U.S. for 40 consecutive quarters, and an astounding 109 straight quarters internationally.
Two-thirds of the company’s stores are currently abroad, and the international segment remains the company’s largest growth opportunity, as the penetration of convenient fast food remains lower abroad than in the United States. Pizza is a product with exceptionally high gross margins, one that “translates” well across different cultures, and one that literally “travels well”, not losing much of its appeal when delivered in a cardboard box. The rise of 3rd party delivery platforms such as Uber (UBER) Eats, Doordash (DASH) and Grubhub is challenging the pizza category as it has expanded the number of choices consumers have for convenient takeout. However, the economics of food delivery remain challenging for most restaurants and platforms alike25, while pizza delivery continues to be highly profitable. Regardless of how the “delivery wars” currently playing out end, Domino’s financial results show little impact of this increased competition, and the company continues to deliver exceptional financial performance.
Domino’s Pizza stock is not optically cheap based on forward earnings, however, the company has routinely reported earnings growth of over 20% in almost all quarters since 2009. Given the company’s high growth rate, international growth opportunities, and capital light business model, which allows for returns on invested capital of over 40%, we are happy to continue to hold the shares.
#3 – Marriott International, Inc. (MAR)
Marriott is the world’s largest hotel company followed closely by Hilton (HLT) and Intercontinental Hotels Group plc (IHG). The company owns a portfolio of brands from the low end (Courtyard, SpringHill Suites, Aloft), through the mid-tier (Marriott, Sheraton, Westin, Renaissance Hotels), to the luxury high end (JW Marriot, Ritz-Carlton, St. Regis). In total the company had 7,642 properties with over 1.4 million rooms as of the end of Q1 2021.26
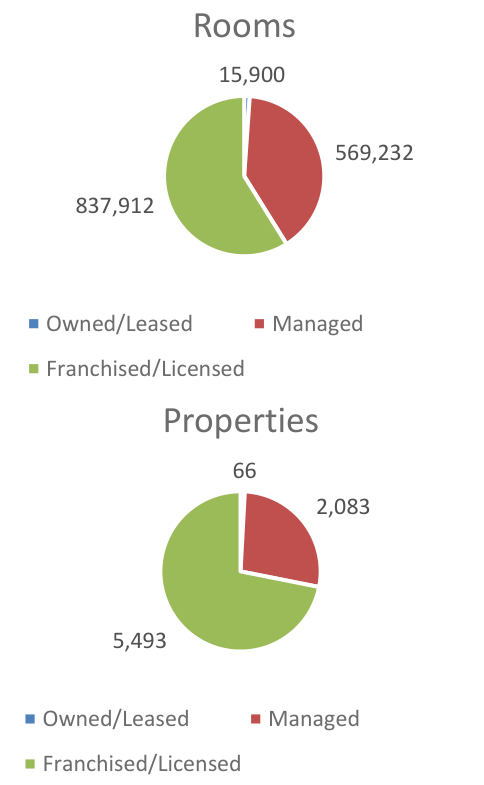
The majority (85%) of Marriott’s revenue comes from hotels in the United States, with the rest almost evenly split between Asia Pacific and Europe. Like its smaller peer, Hilton, the company today is almost exclusively a manager and franchisor of hotels, not a hotel owner. The company owns 66 hotels, manages 2,083 and franchises 5,493. Like all franchise-based businesses Marriott requires very little capital to grow as it utilizes the investment capital of its hotel-owners/partners to expand. Marriott currently faces a difficult operating environment due to the Covid-19 pandemic and uncertainty about the future of business travel. However, the company is an excellent operator with a somewhat leveraged capital structure (the company acquired Starwood Properties in late 2016) – if pent-up demand for travel materializes post-Covid, as we expect it will, the company will quickly go from losing money to raking in profits.
#4 – Asbury Automotive Group, Inc. (ABG)
Asbury Automotive Group is one of the largest automotive retailers in the United States. It operates 90 dealerships consisting of 112 franchises and 25 collision repair centers. The company’s stores offer new and used vehicles, parts, and service, as well as finance and insurance (F&I) products. Franchise agreements controlled by automotive manufactures and state laws create an environment of tightly controlled market entry and restricted competition.
The dealership industry is highly fragmented with 93.5% of dealers having only between 1-5 locations according to data from 202027. In fact, dealers with over 50 locations account for only 0.1% of the industry – a testament to the huge opportunity for consolidation that lies ahead. Industry dynamics, including the rising complexity of automobiles and the need for omnichannel distribution are favoring better capitalized and larger dealer groups. We believe Asbury Automotive Group has several distinct advantages, particularly its highly profitable parts and service business, its overexposure to the luxury vehicle business, which carriers the best margins, and its Clicklane omnichannel strategy. Asbury’s management has also been acting in the best interests of its shareholders by allocating capital towards acquiring dealerships to aggressively expand its business, and occasionally repurchasing stock when attractive acquisitions targets could not be found.
ABG is not a fast-growing SaaS business, but when paying a valuation of ¼ of the overall stock market, one does not need to make heroic assumptions about the future to enjoy strong returns as shareholders. We believe that over the next several years, Asbury will continue to acquire dealerships, occasionally buy back stock and invest to improve its digital shopping experience. We wrote about Asbury in detail in our August 2021 Investor Letter.28
#5 – Texas Pacific Land Trust (TPL)
Long time readers will know that we rarely invest in commodity businesses. However, there are periods in the market where commodity-based businesses outperform the broad indexes by a wide margin. Therefore, to have balance in the portfolio, we have long searched for a competitively advantaged company in the commodity space. We believe that Texas Pacific Land Trust (TPL), meets that criterion. Formed out of assets of formerly bankrupt railroads, TPL controls the largest acreage of land in the Permian basin – the center of the US shale oil industry.
The company has two main sources of income:
- royalties from oil & gas extracted on its properties – essentially a free call option on future oil prices and production; and,
- a water business which develops water resources and sells services to the fracking industry.
We see TPL as an effective way to diversify the portfolio into a commodity exposed business that has a history of smart capital allocation and low risk of financial distress during periods of low oil prices. The company has no debt, and $281 million in cash.29
The company uses most of its cash flows to pay dividends and repurchase shares.
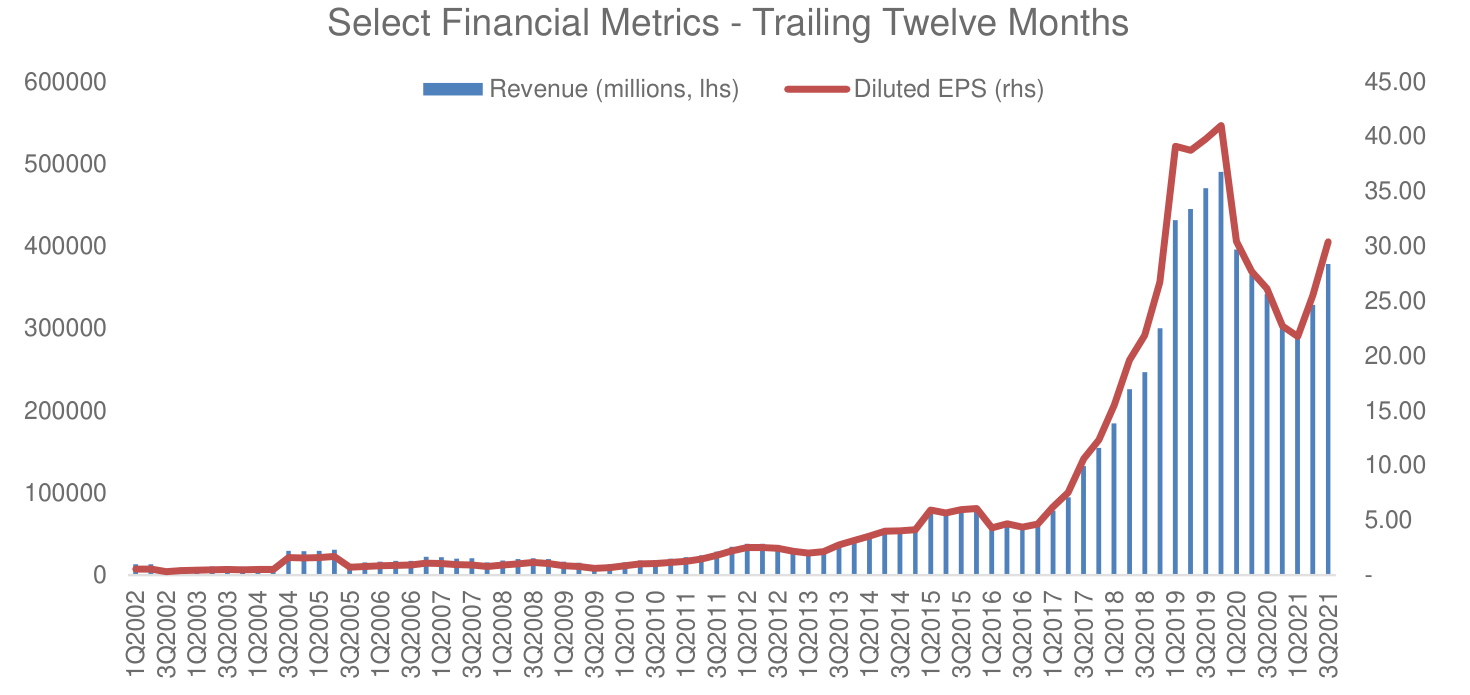
#6 – Murphy USA Inc. (MUSA)
We have held a position in Murphy USA for several months and have recently increased it, making it a top ten name in the portfolio. The company is a gas station operator and was spun-off from Murphy Oil in 2013. Murphy USA operates 1,700 stores primarily in Walmart parking lot locations and owns the underlying real-estate.
What makes Murphy USA unique from other convenience store operators such as Casey’s General Stores, Inc. (CASY) and Alimentation Couche-Tard Inc. (ATD.TO)30, is the company’s focus on high volumes of gasoline sales31 and a minimal amount of convenience store sales. Fuel sales account for close to 60% of gross profit, a big difference from a typical convenience store, where fuel is close to 25% of profits. Most locations have a very small store of approximately 500sqft only.
In December 2020, Murphy USA purchased QuickChek, a chain of 157 stations in the New Jersey and New York with an average store size of 5,500 sqft. which will strengthen the company’s food offering and expand the company’s focus into larger store formats.
The industry Murphy USA operates is attractive because of rising fixed costs of operations which are squeezing smaller and less well capitalized players leading to industry consolidation. While the advent of electric cars may mean less gasoline sales in the future, we continue to believe that the transition to electric vehicles will take a lot longer than most analysts believe.
The company has been using all available cashflow to repurchase shares, a value creating activity, as we view the shares as undervalued.
#7 – Progressive Corp. (PGR)
Progressive is a leading U.S. auto insurer that has pioneered telemetrics as a source of differentiation in its underwriting and it operates through a direct (non-agency) sales model. We believe that the company’s sales model, which is still the minority model in the industry confers on the company a durable process-based cost advantage that has allowed the company to deliver industry leading combined ratios (a standard measure of profitability in the insurance industry).
The company has plenty of room to grow and take market share from players such as State Farm, Farmers and Nationwide. The cost advantages conferred by the direct sales model are unstoppable, and the scale advantages the company has in advertising and other customer acquisition costs furthers its strong competitive position. We believe the industry structure is going to evolve towards a duopoly with Progressive and GEICO as the two main players.
While we do not believe telemetrics itself confers any competitive advantage as it is a technology that has been copied by other players, Progressive is a very innovative company, and it has evolved from being an insurer for the highest risk drivers to one that now targets the general population. GEICO on the other hand began its life as an insurer for the best drivers and has now evolved in the direction of insuring everyone. On the surface the companies are similar, but their different pasts continue to shape their corporate cultures and are evident in subtle ways in their decision-making processes arounds expense management and claims processing.
The company has a very conservative investment portfolio with over $44 billion in fixed income securities.32 75% of their portfolio is held in securities with a duration of under five years, which means that an increase in interest rates will benefit the company as the portfolio will relatively rapidly reprice into higher yielding securities.
#8 – Aspen Technology, Inc. (AZPN)
Aspen Technology is a software company specializing in industrial automation technologies. The company’s software helps customers optimize assets, operations and maintenance in complex environments, primarily in the oil & gas industry. The energy industry represents 41% of the company’s top line, followed by the chemical industry at 28% and engineering and construction at 25%. In particular, Aspen software is used to operate refineries; with nineteen of the twenty largest refineries in the world as their customers. The company has a broadly diversified customer base with over 2,000 clients and 60% of its revenue coming from outside the United States.
Aspen Technology has recently completed a complex acquisition of assets from Emerson Electric (EMR) acquiring Emerson’s software assets, and thus broadening its portfolio of products and services. Normally we are very skeptical of “transformative” acquisitions, but in this case, we like the transaction because we believe it was done at a very attractive valuation. We expect cost synergies from this acquisition to accrue to the company over the next few quarters.
Aspen Technologies’ software has an extremely high switching cost, as it helps optimize the operations of complex industrial firms that usually operate with very thin margins. Reducing capital intensity and working-capital needs that ultimately leads to higher margins is of great value for industrial firms. For example, an oil refinery may cost in excess of $10 billion USD and five years to construct. Once constructed, a refinery operates 24 hours a day nearly every single day of the year. Thus, efficient operations and the reliability of the software used is of paramount importance. The evidence of this high switching cost is the company’s very high customer retention (over 95%) and returns on invested capital with routinely exceed 40%.
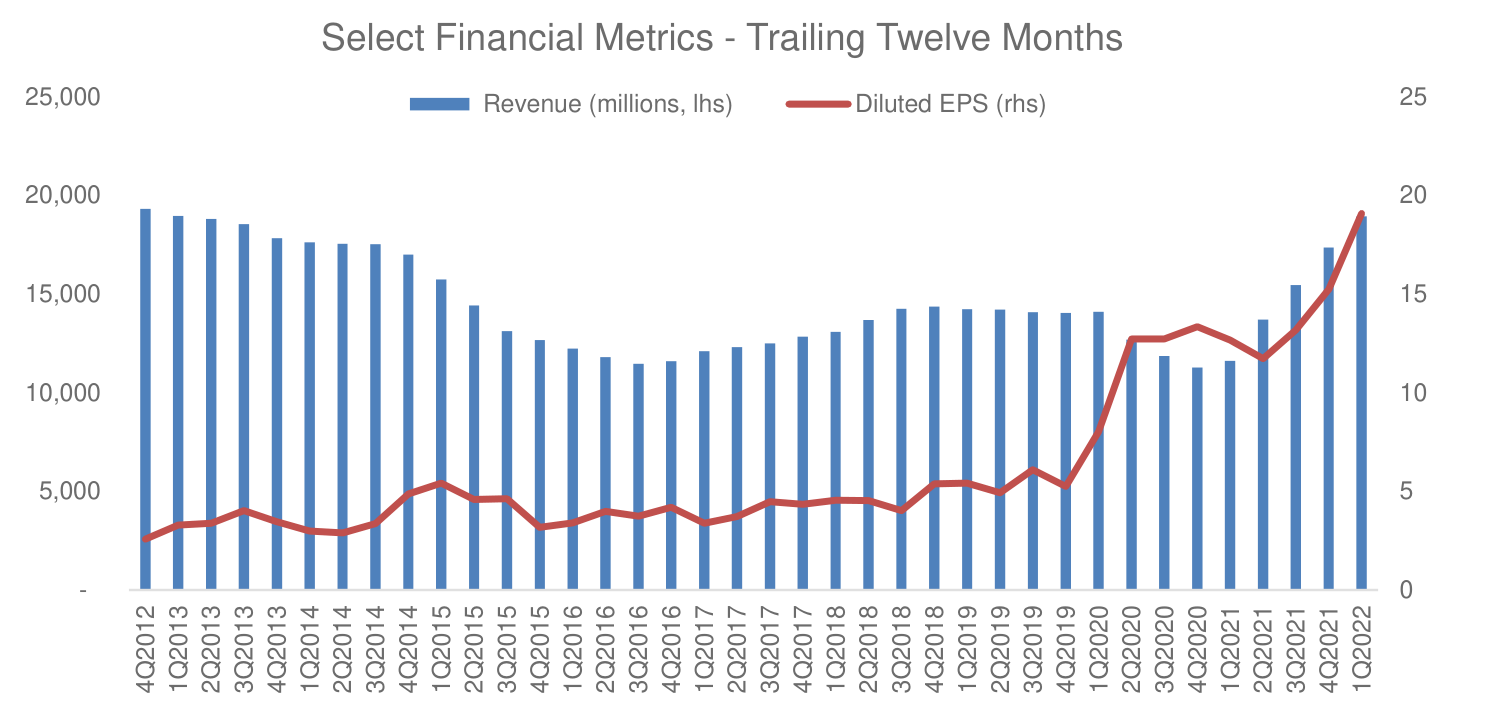
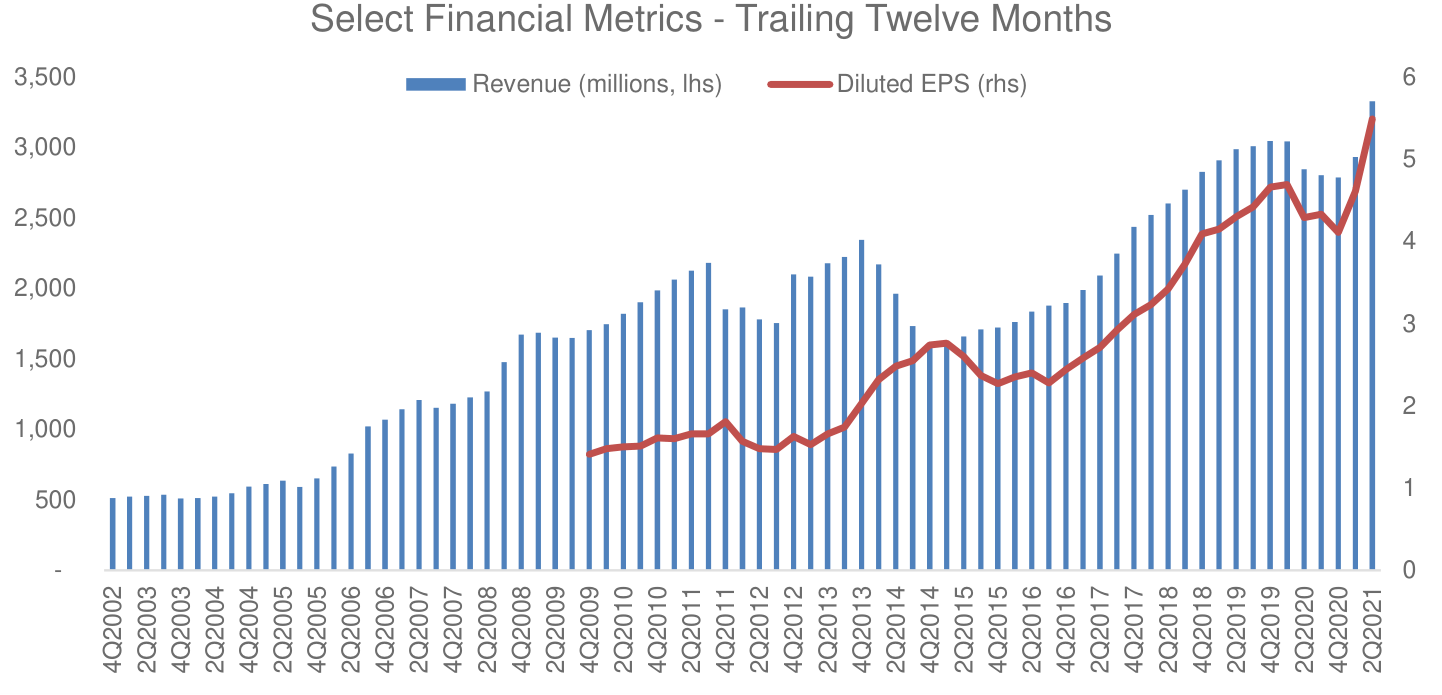
#9 – Colliers International Group Inc. (CIGI)
Colliers International Group is a commercial real estate brokerage and investment management company founded by Jay S. Hennick in 1976 in Toronto, Canada. From humble beginnings the company has grown, primarily through acquisitions, to become one of the five largest commercial real estate brokerages in the world (the others being CBRE, Jones Lang LaSalle (JLL), Cushman & Wakefield (CWK), and Savills (OTCPK:SVLPF)). The company today offers a full range of services and reports in the following segments:
Outsourcing & Advisory (45% of revenue; this includes Engineering & Design services, Valuation services and Property Management), Capital Markets (25% of revenue), Commercial Real Estate Leasing (24% of revenue), and Investment Management (6% of revenue). The company believes that about half of its revenue is recurring in nature. The Investment Management segment deserves special attention, as it is the result of an acquisition of the real estate investment management company Harrison Street in 2018. While the segment contributes the smallest part of revenues, it has a very high margin, contributing over 17% of the company’s EBITDA.
Colliers has historically grown by acquisition, and we expect it to continue to do so. The real estate services market is highly fragmented outside of North America presenting ample opportunities for Colliers to continue its growth strategy. The company has been a good steward of shareholder capital and spun out FirstService Residential (FSV) in 2014 to maximize the value of that business. This spinout accounts for the drop in revenue in 2014 seen in the chart below.
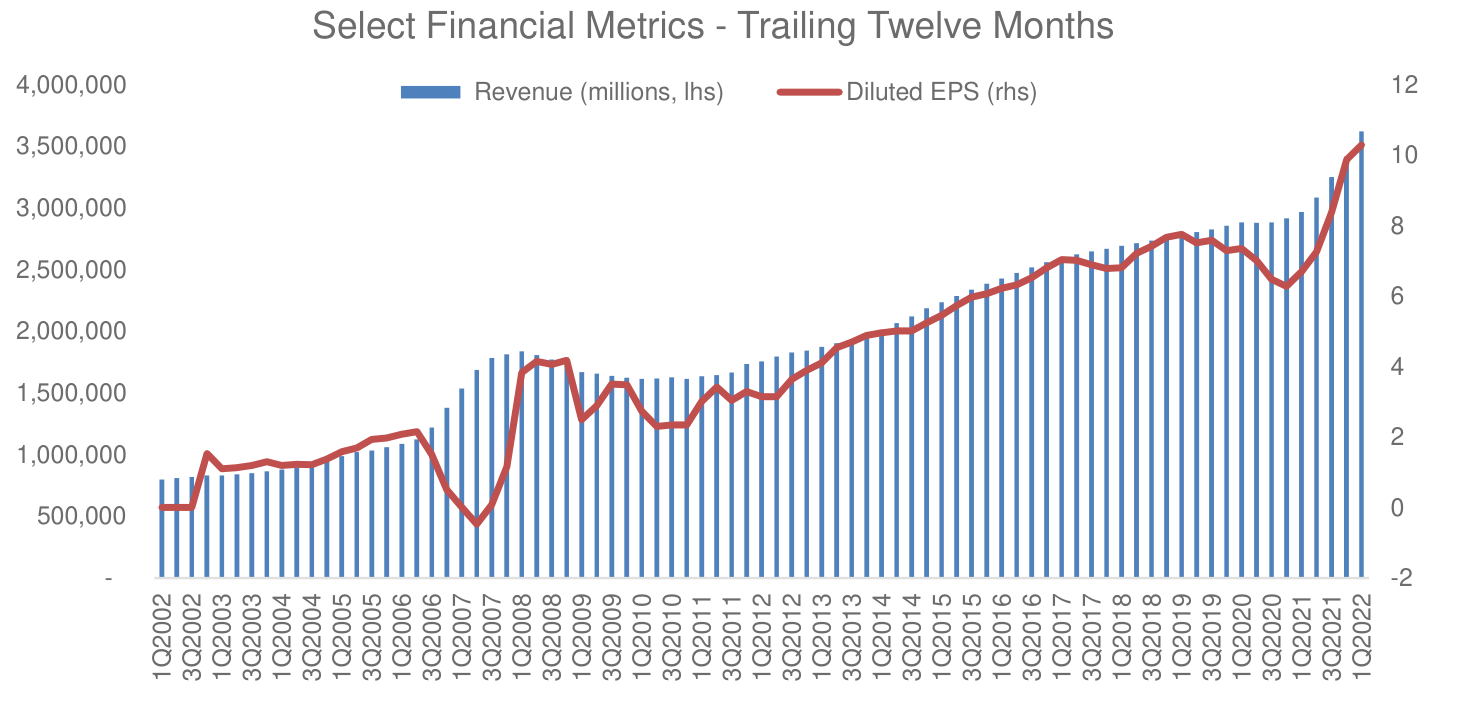
#10 – Public Storage (PSA)
Public Storage is the largest self-storage REITs. The company acquires and develops self-storage facilities and currently owns or manages over 2,7000 properties and is extremely well diversified across the United States. The company was founded in 1972 and IPOed in 1980. We have long admired the company’s ability to grow and maintain high occupancy. We purchased our position after a recent pullback in the company’s share price. We also hold a small position in Extra Space Storage Inc. (EXR), for the same reasons.
The business is largely recession proof with predictable revenues that grow every year due to rent increases, operating efficiencies and new sites. Typical reasons for using a self-storage facility include deaths, divorces, downsizing as well as birth and marriages – things that happen all the time, regardless of the economy. The company can continue to grow through consolidation as the self-storage market is still dominated by mom-n-pop operators. By acquiring underperforming assets and improving operations the company creates incremental shareholder value.
In densely populated areas land is scare and land values are high. High value locations are limited in major metropolitan areas and cannot easily be acquired by an incumbent. This is a simple and seemingly boring business that takes decades to build and that cannot be disrupted by tech companies.
We wrote about Public Storage in detail in our March 2022 letter.33
As always, I look forward to hearing from you and answering any questions you might have. Thank you for your continued interest and support.
Lukasz Tomicki, Portfolio Manager, LRT Capital
Appendix I: Attributions and Holdings as of 10/3/2022
|
LRT Economic Moat |
Portfolio Statistics |
||||
|
Top Holdings (%) |
Sector Allocations (Long Exposure) |
||||
|
Northrop Grumman Corporation (NOC) |
5.07 |
Sector |
Portfolio |
S&P 500 |
Delta |
|
Domino’s Pizza, Inc. (DPZ) |
4.91 |
Consumer Cyclical |
26.70 |
10.59 |
16.11 |
|
Marriott International, Inc. (MAR) |
4.74 |
Industrials |
22.12 |
8.69 |
13.43 |
|
Murphy USA Inc. (MUSA) |
4.14 |
Technology |
10.75 |
23.60 |
(12.85) |
|
Asbury Automotive Group, Inc. (ABG) |
4.10 |
Healthcare |
10.28 |
15.42 |
(5.14) |
|
Texas Pacific Land Trust (TPL) |
3.99 |
Financial Services |
7.35 |
13.61 |
(6.26) |
|
Progressive Corp. (PGR) |
3.72 |
Real Estate |
6.19 |
2.74 |
3.45 |
|
Public Storage (PSA) |
3.29 |
Communication Services |
4.58 |
7.36 |
(2.78) |
|
Aspen Technology, Inc. (AZPN) |
3.21 |
Basic Materials |
4.55 |
2.27 |
2.28 |
|
Colliers International Group Inc. (CIGI) |
2.90 |
Consumer Defensive |
3.56 |
7.38 |
(3.82) |
|
Top Holdings Total |
40.07 |
Energy |
3.92 |
5.37 |
(1.45) |
|
Utilities |
– |
2.97 |
(2.97) |
||
|
Hedges (%) |
Market Cap Allocations (%) |
||||
|
Vanguard Mid-Cap ETF (VO) |
-12.82 |
Large |
37.34 |
||
|
Vanguard Small-Cap ETF (VB) |
-11.77 |
Mid |
49.94 |
||
|
iShares Core S&P Mid-Cap (IJH) |
-11.55 |
Small |
12.72 |
||
|
SPDR S&P MidCap 400 ETF (MDY) |
-11.55 |
||||
|
iShares Russell 2000 (IWM) |
-11.11 |
||||
|
iShares Core S&P Small-Cap (IJR) |
-10.99 |
||||
|
Return Attribution (%) |
Country Allocations (%) |
||||
|
Long Equity |
9.51 |
United States |
94.11 |
||
|
Hedges |
-6.52 |
Canada |
3.62 |
||
|
Unlevered Gross Return |
2.98 |
Denmark |
2.27 |
||
|
Leveraged Gross Return |
7.46 |
||||
|
Net Return |
7.38 |
||||
|
Source: Morningstar, Sentieo. Numbers may not add up due to rounding. Net returns are net of a hypothetical 1% annual management fee (charged quarterly) and 20% annual performance fee. Individual account results may vary due to the timing of investments and fee structure. Please consult your statements for exact results. Please see the end of this letter for additional disclosures. |
Appendix II: Investment Philosophy
Over the past 36 months, we saw a large increase in the number of LRT Capital partners (the term we use to describe our clients). With so many newcomers, it is important that we write about our investment philosophy again.
Here are the key points:
-
- Exceptional stock returns come from exceptional business returns on a per-share basis.
- We seek to invest in high-quality companies, i.e., those possessing sustainable competitive advantages (moats), the ability to grow and reinvest capital over time, and management that excels at capital allocation.
- We only purchase companies whose shares trade at a discount to our assessment of their intrinsic value.
- It is futile to predict short-term market movements. We seek to hold our investments for as long as possible.
- The financial markets are dominated by short-term traders who see stocks as casino chips. This occasionally allows us to purchase shares in great companies at large discounts to their true worth.
- If we are right about the trajectory of the businesses we invest in, over time, we will be right on the trajectory of their stock prices.
We view stock market volatility as a source of opportunity. Volatility allows us to profit by acquiring shares in superb businesses at attractive prices. The more that markets (the “other” participants) are irrational, the more likely we are to reach our ambitious performance objectives.
In the long run, stocks are the best investment asset class, but our experience has taught us that our investment process will not generate linear returns. In some years, our portfolio will outperform, and in others, it will generate a below average return. This is a certainty that we must accept. We are long-term investors and we do not try to dance in and out of the market.
In summary, our investment strategy can be summed up in three steps:
-
- Only seek out high-quality companies.
- Do not overpay.
- Do nothing – patience and discipline are the keystones to success.
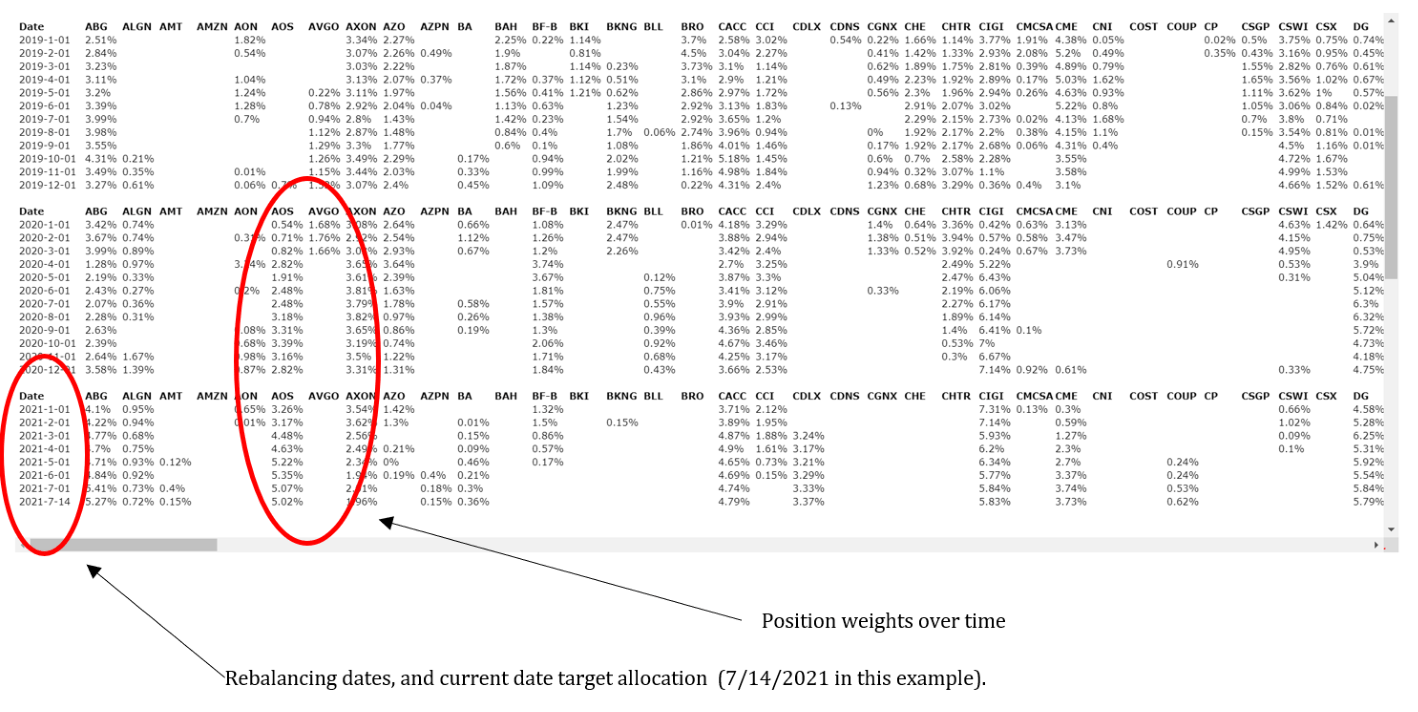
Appendix III: Portfolio Construction Software Overview
LRT separates the discretionary and qualitative process of selecting the equity holdings from the portfolio construction process which is systematic and quantitative.

Our quantitative process considers each position’s contribution to portfolio volatility, contribution of idiosyncratic vs. systematic risk and portfolio factor (size, value, quality, momentum, vol, etc.) exposures.
The system outputs target portfolio weighs for each position. We trade mechanically to rebalance the portfolio each month to the targeted exposures. This eliminates emotions, human biases, and overconfidence risk.
Example system output:
Disclaimer and Contact InformationLRT Capital Management, LLC is an Exempt Reporting Adviser with the Texas State Securities Board, CRD #290260. Past returns are no guarantee of future results. Results are net of a hypothetical 1% annual management fee (charged quarterly) and 20% annual performance fee. Individual account returns may vary based on the timing of investments and individual fee structure. This memorandum and the information included herein is confidential and is intended solely for the information and exclusive use of the person to whom it has been provided. It is not to be reproduced or transmitted, in whole or in part, to any other person. Each recipient of this memorandum agrees to treat the memorandum and the information included herein as confidential and further agrees not to transmit, reproduce, or make available to anyone, in whole or in part, any of the information included herein. Each person who receives a copy of this memorandum is deemed to have agreed to return this memorandum to the General Partner upon request. Investment in the Fund involves significant risks, including but not limited to the risks that the indices within the Fund perform unfavorably, there are disruption of the orderly markets of the securities traded in the Fund, trading errors occur, and the computer software and hardware on which the General Partner relies experiences technical issues. All investing involves risk of loss, including the possible loss of all amounts invested. Past performance may not be indicative of any future results. No current or prospective client should assume that the future performance of any investment or investment strategy referenced directly or indirectly herein will perform in the same manner in the future. Different types of investments and investment strategies involve varying degrees of risk—all investing involves risk—and may experience positive or negative growth. Nothing herein should be construed as guaranteeing any investment performance. We do not provide tax, accounting, or legal advice to our clients, and all investors are advised to consult with their tax, accounting, or legal advisers regarding any potential investment. For a more detailed explanation of risks relating to an investment, please review the Fund’s Private Placement Memorandum, Limited Partnership Agreement, and Subscription Documents (Offering Documents). This report is for informational purposes only and does not constitute an offer to sell, solicitation to buy, or a recommendation for any security, or as an offer to provide advisory or other services in any jurisdiction in which such offer, solicitation, purchase, or sale would be unlawful under the securities laws of such jurisdiction. Any offer to sell is done exclusively through the Fund’s Private Placement Memorandum. All persons interested in subscribing to the Fund should first review the Fund’s Offering Documents, copies of which are available upon request. The information contained herein has been prepared by the General Partner and is current as of the date of transmission. Such information is subject to change. Any statements or facts contained herein derived from third-party sources are believed to be reliable but are not guaranteed as to their accuracy or completeness. Investment in the Fund is permitted only by “accredited investors” as defined in the Securities Act of 1933, as amended. These requirements are set forth in detail in the Offering Documents. |
Footnotes1 MUSA FY 2021 10-K 2 CASY FY 2021 10-K 3 ATD 2022 Annual Report 4 CASY SEC Filings, 2015-2022 5 MUSA SEC Filings, 2015-2022 6 J.P. Morgan Convenience Stores/Fuel Retail & Distribution Equity Research 7 NACS, 2022 8 MUSA FY 2021 10-K 9 CSP Top 202 Convenience Stores 2021 10 NACS State of the Industry Report 2021 11 MUSA FY 2021 10-K 12 Alimentation Couche-Tard 2022 Investor Presentation 13 MUSA FQ2 2022 Earnings Call 14 MUSA SEC Filings, 2015-2022 15 SEC Filings, 2015-2022 16 March 2022 Raymond James Institutional Investor Conference 17 MUSA FQ2 2022 Earnings Call 18 MUSA SEC Filings, 2015-2022 19 Statista, Oct 20th 2022 20 MUSA SEC Filings, 2015-2022 21 Source: Morningstar, Sentieo. 22 It’s Time to Rein in Inflated Military Budgets, It’s Time to Rein in Inflated Military Budgets 23 U.S. Military Spending is Out of Control, https://www.bloomberg.com/opinion/articles/2021-12-27/pentagon-budget-military- spending-is-getting-out-of-hand 25 DoorDash lost $312 million in Q4, 2020. Source: DoorDash, 8-K Earnings, Update, 25-Feb-21 26 Source: Marriott, 10-K/A, 02-Apr-21 27 NADA Data 28 https://www.lrtcapital.com/wp-content/uploads/2021/09/2021-08-August-Investor-Update.pdf 29 Source: TPL, Investor Presentation March 2021, 02-Mar-21 30 The owners of the Circle K brand. 31 The average Murphy USA store sells close to 3 million gallons of fuel per year, 75% more than the industry average. 32 As of September 30th, 2021. Source: PGR 10-Q FY21 Q3. 33 https://www.lrtcapital.com/wp-content/uploads/2022/04/2022-03-March-Investor-Update.pdf |
Editor’s Note: The summary bullets for this article were chosen by Seeking Alpha editors.
Be the first to comment