

supersizer/E+ via Getty Images
Introduction
We review our investment case on L’Oréal SA (OTCPK:LRLCY), which we believe to be one of the highest-quality franchises in public markets and to still offer a 10%+ annualised return to investors.
Our current Buy rating on L’Oréal followed an upgrade in March. Since then, L’Oréal shares trading in Paris have gained 5.0% (including a dividend) in euros, though the share price remains down 13% in the past year:
|
L’Oréal Share Price (Last 1 Year) 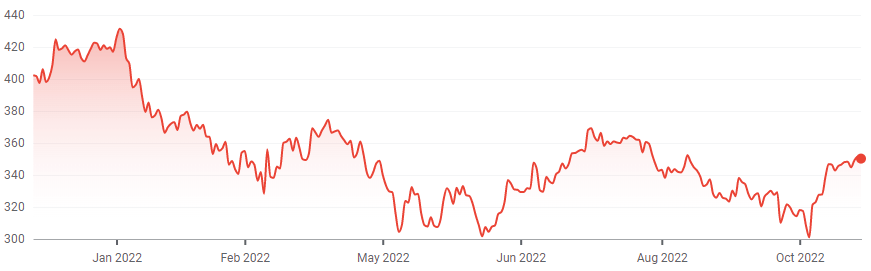 Source: Google Finance (25-Nov-22). |
(A previous Buy rating between March 2020 and May 2021 generated a gain of 43% in 15 months.)
L’Oréal’s strong sales growth has continued into Q3, despite renewed COVID restrictions in China. Growth was broad-based across both regions and divisions, showing the strength of L’Oréal’s diversified model. It has clearly outperformed Estée Lauder (EL) operationally, especially in China. Management is still bullish on China long-term, important because of the country’s outsized contribution to market growth in recent years. Currency will be a significant tailwind this year, likely to help generate a 25% EPS growth in our view, which implies an around 32x P/E, a reasonable level. Our forecasts show a total return of 36% (10.6% annualize) by 2025 year-end. Buy.
L’Oréal Buy Case Recap
L’Oréal is the #1 global Beauty company by sales, involved in every product segment and region.
Our investment case on L’Oréal had been based on the following:
- The Beauty market will continue its strong structural growth, as an aspirational category for consumers, helped by growing demand from Asia (especially China) and premiumization (especially in Skincare)
- L’Oréal has strong global franchises built on leading brands, high-quality products, scale, innovation and marketing capabilities, and will continue to grow sales faster than the market thanks to these advantages
|
L’Oréal LfL Sales Growth vs. Global Beauty Market (Since 2010) 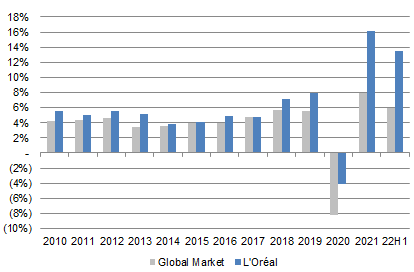 Source: L’Oréal company filings. NB. Market growth rates at constant currency, and exclude razors, soaps & oral care. |
- L’Oréal will also grow its earnings faster than sales with natural operational leverage. We believe L’Oréal’s EPS CAGR will be close to 10% over time
|
L’Oréal EBIT Growth (Since 2010) 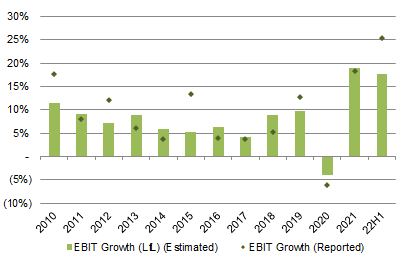 Source: L’Oréal company filings. NB. LfL EBIT growth estimated using LfL Net Sales growth & margin changes. |
- Compared to its main rival Estée Lauder, L’Oréal has a more broad-based portfolio and a lower concentration in Prestige and Skin Care products, which means L’Oréal has lower growth but is lower-risk
COVID-19 was negative for L’Oréal, disrupting Travel Retail and reducing demand in areas such as Make-up and Haircare. However, since 2021, L’Oréal sales have rebounded strongly to surpass pre-pandemic levels. As of H1 2022, relative to 2019, L’Oréal has achieved CAGRs of 7.4% in Net Sales, 9.0% in EBIT and 11.4% in Adjusted EPS.
L’Oréal’s Q3 2022 Sales Growth
L’Oréal’s strong growth has continued into Q3. On a like-for-like (“LfL”) basis, Net Sales grew 9.1% year-on-year. While year-on-year growth was less than the approximately 13.5% achieved in both Q1 and Q2, this was largely due to stronger comparables in prior years. Relative to 2019, Q3 2022 Net Sales were 25.3% higher on a like-for-like basis, an acceleration from the 23.0% achieved in Q2 and 19.1% in Q1:
|
L’Oréal LfL Sales Growth By Quarter (Since 2020) 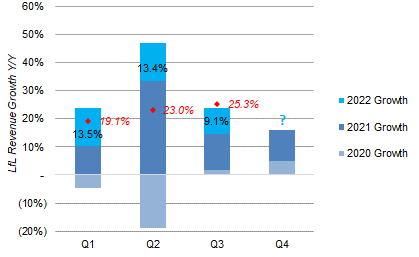 Source: L’Oréal company filings. |
Growth was broad-based across both regions and divisions, an example of the strength of L’Oréal’s diversified model:
|
L’Oréal Net Sales By Region (Q3 2022 vs. Prior Year) 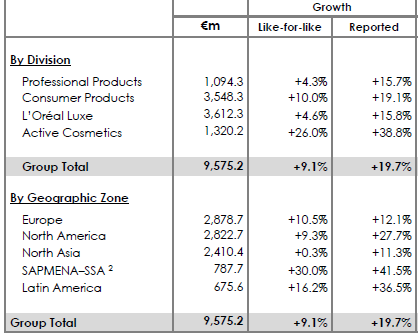 Source: L’Oréal results release (Q3 2022). NB. SAPMENA–SSA: South Asia Pacific, Middle East, North Africa, Sub-Saharan Africa. |
(Q3 Net Sales included a €90m headwind from the shift of some Asia Travel Retail sales from Q3 to June, offset by a €94.7m benefit from an insurance payout related to the loss of production at a Vichy plant after a hailstorm.)
Currency movements represented a tailwind of more than 10% in Q3, taking actual Net Sales growth to 19.7%.
Among regions, LfL sales growth has decelerated to just +0.3% in North Asia, largely due to renewed COVID restrictions in China that pushed the Chinese market into decline in Q3, but this was offset by LfL growth of around 10% in both Europe and North America; SAPMENA-SSA and Latin America grew even faster, but on lower bases.
Among divisions, LfL sales fell to just 4.6% in L’Oréal Luxe (from 16.4% in H1) and 4.3% in Professional Products (from 14.3% in H1), largely due to China. Consumer Products and Active Cosmetics each achieve a double-digit growth rate in Q3 that represents an acceleration from H1.
Price/mix has continued to be a positive driver for sales growth. The average price increase accelerated from 3.7% in Q1 to 5.7% by Q3. Mix was also positive as “all” new products are launched at “a higher price than the current catalogue”.
L’Oréal’s Q3 Year-to-Date Sales Growth
As of Q3, L’Oréal has achieved year-to-date sales growth of 12.0% on a LfL basis and 20.5% on a reported basis:
|
L’Oréal Net Sales By Region (Q3YTD 2022 vs. Prior Year) 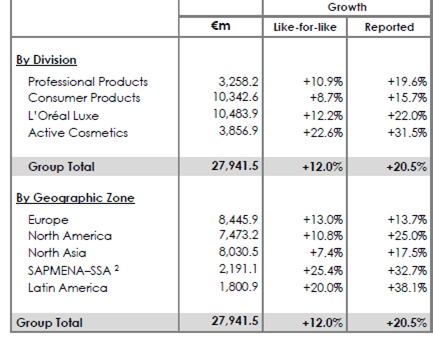 Source: L’Oréal results release (Q3 2022). NB. SAPMENA–SSA: South Asia Pacific, Middle East, North Africa, Sub-Saharan Africa. |
While the Q3 update did not disclose profits, L’Oréal’s EBIT is likely to have grown by a few points more than Net Sales year-to-date, given management’s longstanding goal (and track record) of achieving margin expansion.
Back in H1 2022, L’Oréal achieved EBIT growth of 25.3% on Net Sales growth of 20.9%, with a slightly lower Gross Margin and a 31.5% growth in Advertising & Promotion expenses being offset by SG&A expenses growing less than sales and R&D expenses remaining relatively flat (up 2.9%).
Outperforming Estée Lauder Operationally
L’Oréal’s LfL sales growth in Q3 represented a 9 ppt outperformance over Estée Lauder, whose sales fell 5% organically:
|
EL Net Sales by Region (Q1 FY23 vs. Prior Year) 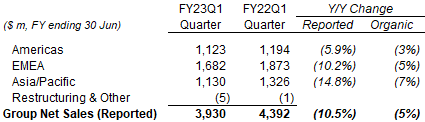 Source: EL results release (Q1 FY23). |
We cannot compare regional sales across the two companies due to different reporting structures, notably EL reporting all of its Travel Retail sales (except those at Dr. Jart+ in South Korea) in its EMEA region. In addition to COVID restrictions in China, EL also stated it experienced headwinds from some U.S. retailers tightening inventory levels.
We take a closer look at the two companies’ Q3 performance in China.
Closer Look at Slowdown in China
The Chinese beauty market shrunk in Q3 but L’Oréal grew faster than both the market and Estée Lauder.
On a sell-out basis (which excludes inventory changes), management stated that, in China:
- Overall market fell 3% year-on-year but L’Oréal sales grew 7.8%
- Mainland market fell 4.7% but L’Oréal sales grew 2%
- Hainan Travel Retail market grew 9% and L’Oréal sales grew 14%
By comparison, EL stated that its overall Chinese sales (including both mainland and Travel Retail) grew by a mid-single-digit percentage in Q3, while its mainland sales were down low-single-digits organically.
It is possible that EL’s more premium-focused portfolio made it more vulnerable to brick-and-mortar problems, especially in skincare. However, L’Oréal management stated that luxury products did comparably better in their experience:
“To answer your question around China, our sales were very positive in luxury and slightly negative in mass (market) for one very simple reason is that, in luxury, even when offline is shut down, e-commerce is both a higher weight and the platforms are also pushing higher-value products. And more importantly, we can activate our consumers through CRM.”
Nicolas Hieronimus, L’Oréal CEO (Q3 2022 sales update call)
So far this year L’Oréal management has shown itself to be more capable than the EL team, though for the moment we still believe that EL will grow sales faster than L’Oréal over time, simply because EL’s portfolio is more focused on premium and skincare products that have structurally higher growth rates than make-up and haircare products that are more represented in L’Oréal’s portfolio.
Still Bullish About the Chinese Consumer
A strong Chinese market is key to our investment case. L’Oréal likely has approximately 20% of its sales in China, based on currency disclosures in its 2021 annual report (compared to EL having 34% of its FY21 sales in China).
China is even more important as a percentage of sales growth. Before 2017, the global Beauty market had largely grown at around 4% annually, with L’Oréal sales growing at around 5%. Both accelerated markedly from 2017 with an increasing contribution from China driving L’Oréal’s APAC region (later reorganised into the North Asia region):
|
L’Oréal LfL Sales Growth – Contribution by Region (Since 2020) 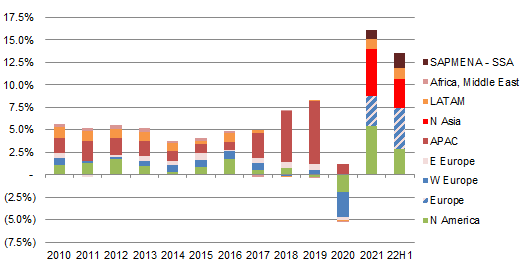 Source: L’Oréal company filings. |
L’Oréal management is still bullish on China long-term, as CEO Nicolas Hieronimus explained on the call:
“We remain in the long term and medium term very bullish about China for the very same reasons we’ve shared with you several times, the demographics, the rise of the middle class, the shared prosperity that is wished by the government … We believe that the Chinese market will remain a source of growth… We continue to invest behind China and to believe in China.”
We agree with this assessment, but will continue to monitor the COVID situation in China closely.
Currency Is a Significant Tailwind
For L’Oréal, which reports in euros, currency has been a significant tailwind this year, with the euro having depreciated by a mid-teens percentage against the U.S. dollar, the company’s biggest currency, as well as by double-digits against currencies such as the Brazilian Real and the Mexican Peso:
|
L’Oréal’s Key Currency Weights & Rates 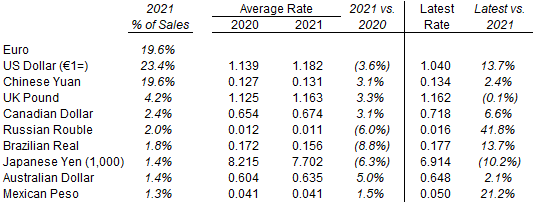 Source: L’Oréal results presentation (2022) and Refinitiv (25-Nov-22). |
Management stated that extrapolating the September 30 EUR/USD spot rate until year-end would lead to a positive impact of 8.1% in full-year sales. The euro has regained about 6% against the dollar since, but remains significantly below its 2021 range:
|
Euro vs. U.S. Dollar (Last 5 Years) 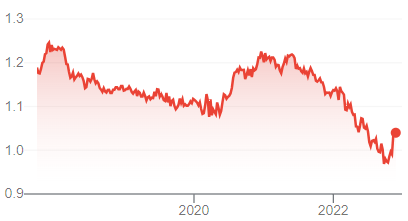 Source: Google Finance (25-Nov-22). |
The weaker euro means that reported 2021 earnings (in euros) understate the actual earnings of the company.
Is L’Oréal Stock Overvalued?
At €350.25, relative to 2021 financials, L’Oréal shares are at a 38.2x P/E and a 2.9% Free Cash Flow (“FCF”) Yield:
|
L’Oréal Earnings, Cash Flows and Valuation (2019 to H1 2022) 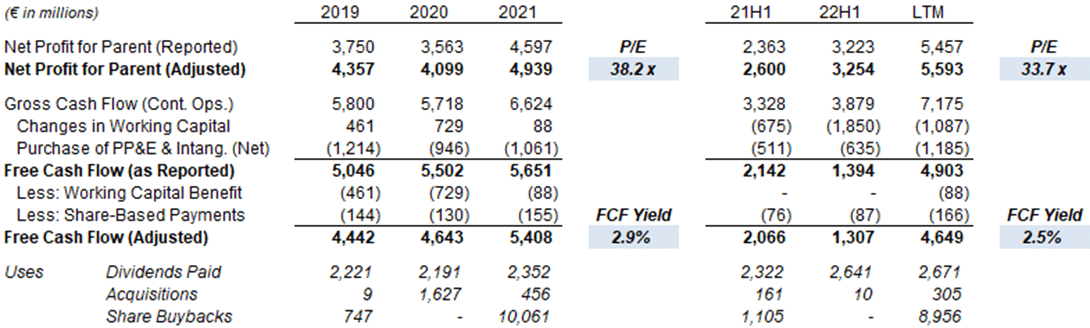 Source: L’Oréal company filings. |
Relative to last-twelve-month (“LTM”) financials, which include a H1 2022 where Adjusted EPS was up 30.8% year-on-year, shares are at a 33.7x P/E, though FCF Yield is lower at 2.5% due to a higher working capital outflow.
Currency tailwinds mentioned above mean both set of figures likely overstate L’Oréal’s valuation.
Our forecasts are for EPS to grow 25% (including currency) to €11.05 in 2022, which implies a 31.7x P/E. Both this and the LTM P/E are below the 32.5x we now believe to be a fair long-term multiple.
L’Oréal’s annual dividend is €4.80, representing a Dividend Yield of 1.4%. The dividend was raised 20% this year and represented 54% of 2021 Adjusted EPS.
L’Oréal had €5.00bn of net debt at H1 2022, due to both new debt to repurchase shares from Nestlé and H1 seasonal working capital outflows. We expect it to return to Net Cash relatively quickly.
L’Oréal continues to hold a 9.44% stake in Sanofi, worth €10.5bn (5.6% of L’Oréal’s market capitalization) at current prices. L’Oréal’s share of Sanofi earnings is partially captured in the P&L through Sanofi dividends received.
L’Oréal Stock Return Forecasts
We increase our 2022 EPS forecast but reduce our exit multiple assumption. We now assume:
- 2022 Net Income of €5.94bn (was €5.71bn)
- 2023 Net Income growth of 6.5% (unchanged)
- From 2024, Net Income to grow at 9.5% each year (unchanged)
- 2022 share count of 538m (unchanged)
- From 2023, the share count to be flat (unchanged)
- Dividend to grow at 10.5% each year (unchanged)
- P/E of 32.5x at 2024 year-end (was 33.5x)
Our new 2025 EPS forecast of €14.11 is 4.1% higher than before (€13.55), and implies a 2021-25 EPS CAGR of 12.5%:
|
Illustrative L’Oréal Return Forecasts 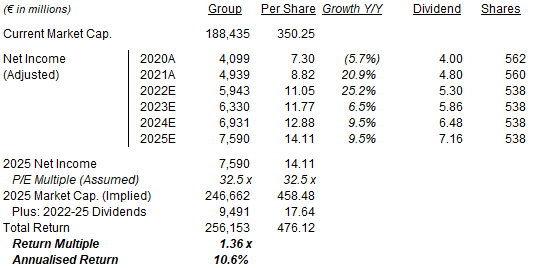 Source: Librarian Capital estimates. |
Our dividend forecasts implies that the Payout Ratio will reach 51% in 2025.
With shares at €350.25, we expect an exit price of €458 and a total return of 36% (10.6% annualized) by 2025 year-end. We consider this forecasted return attractive for such a unique asset.
Conclusion: Is L’Oréal Stock A Buy?
We reiterate our Buy rating on L’Oréal stock.
Be the first to comment