

designer491
Co-produced with Beyond Saving
This is part four of our educational series. So far, we have covered:
- How to read a balance sheet.
- How to read an income statement.
- How to read a statement of cash flows.
In all three, we’ve been analyzing Medical Properties Trust, Inc. (NYSE:MPW). It is a real estate investment trust (“REIT”) that has had significant negative sentiment and has been the target of a very vocal short position. It is times like these when it is crucial to be able to dissect the financials yourself to see if it is a fantastic buying opportunity or if the risk is too high.
Today, we are going to talk about “non-GAAP” metrics. These metrics are the cornerstone of due diligence, and you will often rely on them when making your decisions.
What Are Non-GAAP Metrics?
GAAP (Generally Accepted Accounting Principles) is the base accounting standard that the SEC has adopted and requires all companies to use when reporting their financials. The benefit of having all companies use identical accounting standards is clear: It allows for apples-to-apples comparisons.
However, “all companies in existence” covers a lot of different businesses where different things are important. When you are doing due diligence to choose one investment over another, nuances matter. GAAP has numerous accounting rules which sometimes muddy the waters, resulting in metrics that don’t really tell you how a company is doing.
As a result, most companies also report “non-GAAP” metrics. They make adjustments to GAAP Net Income, and you will see metrics like “core earnings,” “adjusted earnings,” “FFO” (funds from operations), cash available for distribution, and more. The list of names for these metrics is endless, but they all start with Net Income and then make various adjustments. Some companies will actually provide multiple non-GAAP metrics with varying adjustments.
How Adjustments Are Determined
Companies are generally free to provide whatever non-GAAP metrics that management believes are appropriate. While the SEC might crack down if it determines that a non-GAAP metric is outright misleading, it isn’t something the SEC is particularly aggressive with. As a result, investors need to be cautious with non-GAAP metrics and make sure that they understand what is being included or excluded. You need to be particularly careful comparing non-GAAP metrics of one company with non-GAAP metrics from another. There could be material differences in what each company decides to include or exclude. When comparing companies, it is often necessary to reconcile one adjusted metric with the other to get an apples-to-apples comparison.
Fortunately, companies are required to provide a step-by-step reconciliation to the nearest GAAP metric. This allows investors to follow along and see what adjustments the company is making and decide for each one whether it “makes sense.”
Non-GAAP metrics often provide much more information and clarity into a business, allowing investors to make better decisions. However, there is also room for companies to use non-GAAP metrics in a way that hides warts. Looking at the adjustments that are made is essential to determining whether a particular non-GAAP metric is helpful.
Calculating Non-GAAP Metrics
There are a variety of non-GAAP metrics. Some, like EBITDA and FFO, have fixed definitions that companies must follow. If you see “FFO” for one REIT, it will be calculated exactly the same as FFO for another REIT. However, if you see a qualifier like “adjusted” or “normalized” EBITDA or FFO, that tells you that there are additional adjustments. These additional adjustments are not necessarily the same across different companies.
Let’s look at the metrics that MPW reports, which include
- EBITDA
- Adjusted EBITDA
- FFO
- NFFO (Normalized FFO)
- AFFO (Adjusted FFO).
Our examples in this article are from MPW’s 2nd Quarter 2022 Supplemental Information. MPW will be releasing Q3 earnings early in November.
Perhaps the most common non-GAAP metric is “EBITDA” which stands for Earnings Before Interest, Taxes, Depreciation, and Amortization. EBITDA is calculated the same for every company. The adjustments made are in the name: you take earnings (net income) and add back interest paid, taxes paid, depreciation, and amortization.
The concept behind EBITDA is to strip out major non-cash items (depreciation/amortization), along with taxes and debt costs which are dependent upon the capital structure. The goal is to get a picture of the underlying profitability.
A potential acquirer would have different taxes and debt costs. For example, a company with an A-rated balance sheet can usually buy a company with a B-rated balance sheet and quickly realize larger profits just from refinancing the debt.
EBITDA is a metric that credit rating agencies frequently use as a measure of leverage. Net Debt/EBITDA, which takes total debt minus cash assets and divides it by annual EBITDA, is commonly used to express how leveraged a company is.
You will also see EBITDA used to measure a company’s ability to cover fixed charges, rent, and/or interest. For example, if we look at Moody’s latest assessment of MPW, we can see that EBITDA plays a prominent role in their key indicators. (Source)
Moody’s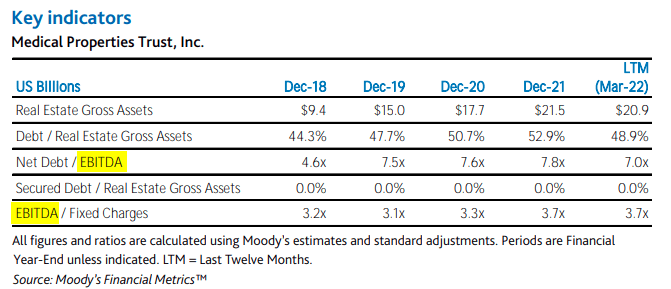
Right now, debt/EBITDA is Moody’s main reason for holding back MPW’s credit rating. Moody’s wants to see debt/EBITDA below 6.0x.
Moody’s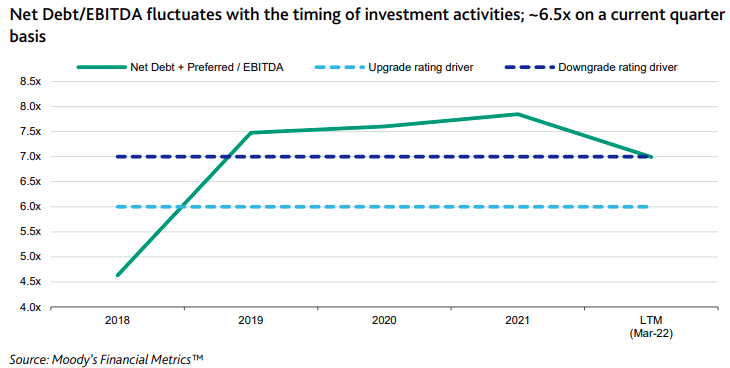
For MPW, a credit rating upgrade would be a material event as it would give them an “investment grade” rating, that means access to cheaper debt and lower interest expense. If you remember from our prior analysis, we learned from the balance sheet that MPW has been making progress in reducing debt, and we learned from the income statement that interest is MPW’s largest cash expense.
In addition to EBITDA, you will often see “adjusted” EBITDA. Whenever you see the word “adjusted,” you know it differs from the standard. There are a lot of good reasons to adjust EBITDA. One common reason is one-time gains or losses.
MPW presents an adjusted form of EBITDA, starting with NAREIT’s “EBITDA re,” EBITDA for real estate. This makes all the changes that EBITDA does but goes a step further by removing gains/losses due to selling real estate, adding back non-cash impairments and EBITDA from unconsolidated joint ventures.
NAREIT has spearheaded attempts to make reporting among REITs more uniform and the implementation of consistent non-GAAP metrics allowing for easier apples-to-apples comparison among different REITs. While reporting EBITDA is optional, many REITs are adopting the practice.
Here is MPW’s EBITDAre, adjusted EBITDAre, and “pro forma” adjusted EBITDAre. You can follow along on page 8 of MPW’s Supplement:
MPW Q2 Supplement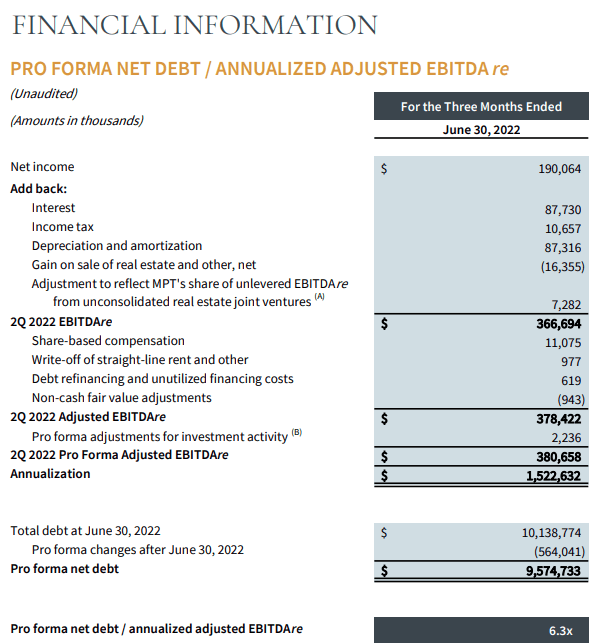
Note that the calculation starts at GAAP Net Income. Adding back interest, income tax and depreciation, and amortization gets you to EBITDA of $375.7 million (rounded). Then you see the impact of the “re,” subtracting $16.3 million, which was a gain on sale, and adding $7.3 million. So, in this case, EBITDAre comes slightly lower than EBITDA at $366.7 million.
MPW’s “adjusted EBITDAre” then goes on to add back non-cash expenses. These are all things we discussed in our article on the Statement of Cash Flows.
Finally, MPW makes a few “pro forma” adjustments. These are adjustments for acquisitions that closed midway through the quarter to reflect what they would have looked like if the property was owned the entire quarter. Pro forma adjustments are used to illustrate what changes during or after the quarter would have on the numbers.
Funds from operations or FFO is another metric that REIT investors should be familiar with. NAREIT FFO is the standard that is reported by all REITs, and then many REITs will also report an adjusted form of the metric. MPW reports FFO and two metrics that are adjusted from FFO: NFFO (Normalized FFO) and AFFO (Adjusted FFO).
For MPW, the FFO adjustments can be found on page 6 of its supplement. Note that MPW has extensive notes at the bottom of the page explaining the different calculations.
MPW Q2 Supplement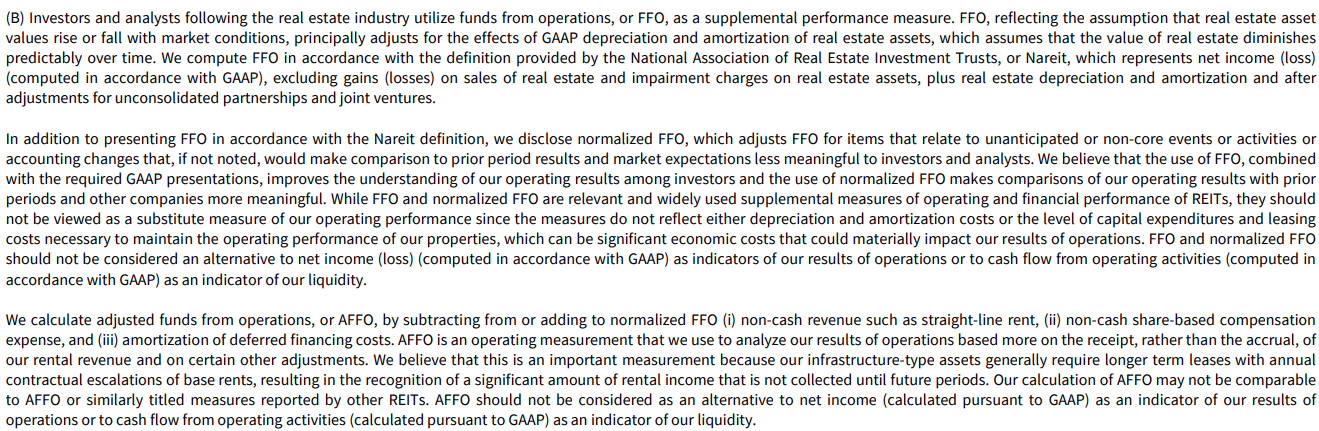
NAREIT FFO excludes gains (losses) on sales of real estate, impairment charges, depreciation, and amortization, including adjustments for joint ventures.
We can see that MPW’s FFO calculation is straight-forward with just two adjustments:
MPW Q2 Supplement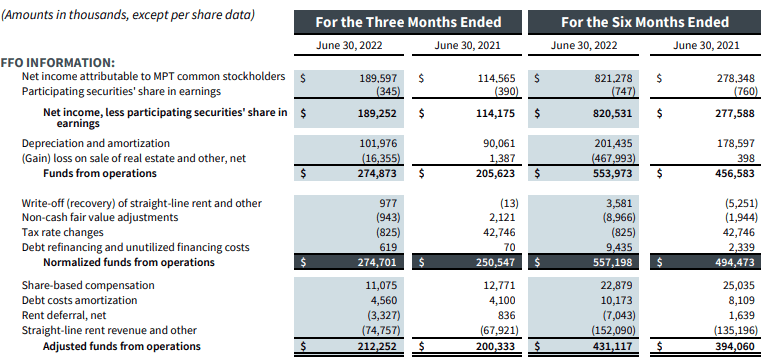
Note that depreciation is higher than you’ll find on the income statement, because it includes MPW’s pro rata share of depreciation of properties carried in joint ventures.
“NFFO” is a metric that is unique to MPW. While other REITs also have versions of normalized FFO, how that is calculated can vary from REIT to REIT. In its note, MPW suggests that NFFO is meant to remove “non-core” events and accounting changes.
When we see the word “normalized” we want to see a metric that is going to tend to be very close to the unadjusted metric most of the time. We can see that it is very close in 2022 but look at 2021. $42 million is a huge swing! When we see something like that, we might want to investigate further.
We can pull up MPW’s Q2 2021 10-Q to learn more about this large charge. Search for “tax rate”, and there it is:
MPW Q2 2021 10-Q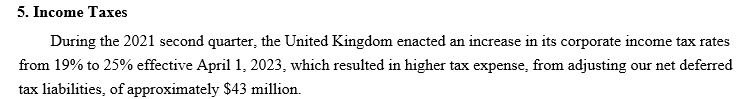
So the UK raised taxes, causing MPW to realize a one-time adjustment to its tax liabilities as taxes were much higher than previously accounted for. That isn’t something that happens every quarter, so the adjustment makes sense. This is the kind of adjustment we expect to see in a figure marketed as “normalized.” A normalized metric should seek to remove those occasional, unexpected expenses or revenues that are one-time and unpredictable, and it would be misleading for investors to price them in moving forward.
“AFFO” or adjusted FFO is a metric where the name doesn’t tell you much. It is FFO, and it is “adjusted” somehow. Many REITs calculate AFFO, but all of them will calculate it differently. It is the wild-west of REIT metrics. In our opinion, you can learn a lot about the quality of the management based on what adjustments they decide to include or exclude.
MPW has three adjustment criteria for AFFO:
- Non-cash revenue, such as straight-line rent
- Non-cash share-based compensation expense
- Amortization of deferred financing costs.
All three strip out non-cash revenues and expenses. It provides a more clear picture of what cash MPW is actually receiving, as opposed to GAAP metrics which use accrual accounting. As income investors, we are much more interested in the cash MPW is actually receiving than the cash that it will theoretically be owed later.
Here is a look at AFFO:
MPW Q2 Supplement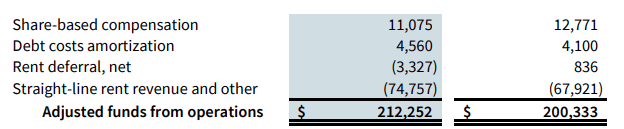
Note that AFFO ends up being substantially lower (23%) than FFO and NFFO for MPW. This is thanks to the relatively large straight-line rent that is removed in the AFFO calculation but not the FFO calculation. Straight-line rent is rent that has been recorded as revenue but has not yet been paid. GAAP requires that rent is recorded as if it were equal for the entire lease period. Well, when you have a 20-30 year lease with escalators that increase rent every year, the rent 20 years from now will be a lot higher than rent is today. As a result, straight-lining artificially increases current revenue above the actual rent being billed to the tenant.
MPW has been attacked for this as if they are trying to “hide” something. Yet, they publish it plain as day in their AFFO metric. They are required to report straight-line rent on their income statement, they have to follow GAAP guidelines. But in their non-GAAP measures, MPW is free to remove that impact, and they do. This gives investors a much better number to judge things like current dividend coverage.
This is why non-GAAP metrics can be helpful, and we believe that AFFO is the best metric to estimate dividend safety for MPW. We have been a bit baffled by those who have attacked MPW for failing to disclose it when it is right there, on the same page with FFO and NFFO.
Comparing REITs
As discussed above, AFFO can vary a lot from REIT to REIT. The adjustments are voluntary, and different managements can have different rules.
For example, here is OHI’s calculations for the non-GAAP metrics AFFO and FAD (funds available for distribution) (Source):
Omega Healthcare Q2 2022 Supplement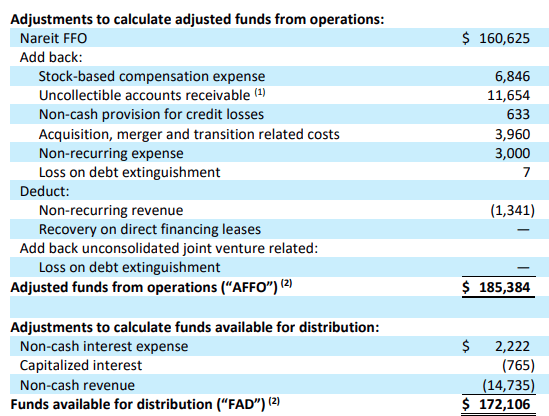
Both start at NAREIT FFO, but then they make choices. Note that several of the items that OHI adds to AFFO are included in MPW’s “NFFO.” Uncollectible accounts receivable (straight-line rent that is written off), merger/transition-related costs, non-recurring expenses, and debt extinguishment would all be included in MPW’s NFFO.
Meanwhile, MPW’s AFFO definition picks up from NFFO and includes everything in OHI’s AFFO, plus everything included in FAD.
| MPW | OHI | |
| Non-core and one-time events | NFFO & AFFO | AFFO & FAD |
| Non-cash write-offs/value changes | NFFO & AFFO | AFFO & FAD |
| Stock-based compensation | AFFO | AFFO & FAD |
| Non-cash interest (amortization) | AFFO | FAD |
| Non-cash revenues (including straight-line) | AFFO | FAD |
Note that both companies provide the same information, but they have different line items in each of these categories and adjust them in different metrics. So when we are comparing side-by-side, we cannot compare OHI’s AFFO to MPW’s AFFO. With only a single adjustment, we can compare OHI’s AFFO to MPW’s NFFO (which we’ll do in #2 below). The only adjustment required would be to remove the stock-based compensation adjustment from OHI’s AFFO or add a stock-based compensation adjustment to MPW’s NFFO.
Why would we do this? Three main reasons:
1. To Check For Disclosure
If you are doing due diligence on a new sector, it is often wise to take a look and compare the non-GAAP metrics of several companies. This will help you determine if the company you are looking at is skipping out on a key number. Remember, non-GAAP reporting is not mandatory. However, companies in the same sector will tend to provide the same information.
As we see above, MPW and OHI have different names, but when you get to AFFO and FAD, they have exactly the same disclosure. If you are comparing two companies in the same sector and start seeing a bunch of adjustments in one but not the other, then one company might have some disclosure issues. With similar companies, you want to see similar adjustments.
With most large reputable companies, non-GAAP metrics do improve the quality of the information investors receive. However, some companies have abused it. Comparing two companies in similar businesses is a great way to see if the adjustments being made are reasonable and standard in the sector.
Ultimately, MPW and OHI are reporting the same adjustments, and both are disclosing the information that investors should expect to have.
2. For Valuation
We often want to compare the values of different REITs as a multiple of an adjusted FFO. This lets us see which company is “cheaper” on an apples-to-apples basis. So let’s remove the impact of share-based compensation from OHI’s AFFO.
$185,384 – $6,846 = $178,538 or $0.73/share. If we annualize that, it is $2.92/share, and OHI is trading at about 10x the equivalent of MPW’s NFFO. MPW’s NFFO annualized is $1.84/share, so MPW is trading at 6x NFFO. We now have an apples-to-apples metric to compare relative valuations.
3. For Dividend Safety
We can compare OHI’s FAD with MPW’s AFFO, as both have all of the same adjustments, even though they have different names. We like to rely on FAD and AFFO as indicators of dividend safety since they are metrics that strip out all the noise of GAAP accounting and show us the recurring cash flow.
OHI’s FAD was $0.71 in Q2, covering its $0.67 dividend by 106%. MPW’s AFFO was $0.35/share covering its $0.29 dividend by 120%. Remember, these are comparable metrics.
It was this much more secure dividend at MPW that was the primary driver of our choosing MPW over OHI.
What Does the Future Bring? A Look at a Potential “Worst Case Scenario”
When we are looking at financials, we have to remember that we are always looking at the past. Even the most recent earnings report is telling us what happened last quarter. The market is often forward-looking.
We have been told that Steward is a bankruptcy risk. Some in the market are very concerned about this. Many have warned that a Steward bankruptcy would be a disaster and that MPW’s dividend would have to be cut. Is this a risk? Let’s attempt to use non-GAAP metrics to quantify it.
What happens if Steward files for bankruptcy? In the bear world, rent vanishes into thin air, patients are thrown into the streets, and doctors and nurses join the ranks of the unemployed.
In the real world, hospitals keep operating more often than not. If a company continues to occupy a property, rent must be paid even through bankruptcy proceedings. The bankrupt company has the option to accept or reject the lease, if accepted, it pays as agreed. If rejected, the landlord and the tenant can negotiate, or the landlord takes possession of the property and can lease it out to another tenant or sell it.
MPW has actually experienced several tenant bankruptcies over its history. Most of them resulted in no lost rent as the leases were assumed. (Source)
MPW August 2022 Presentation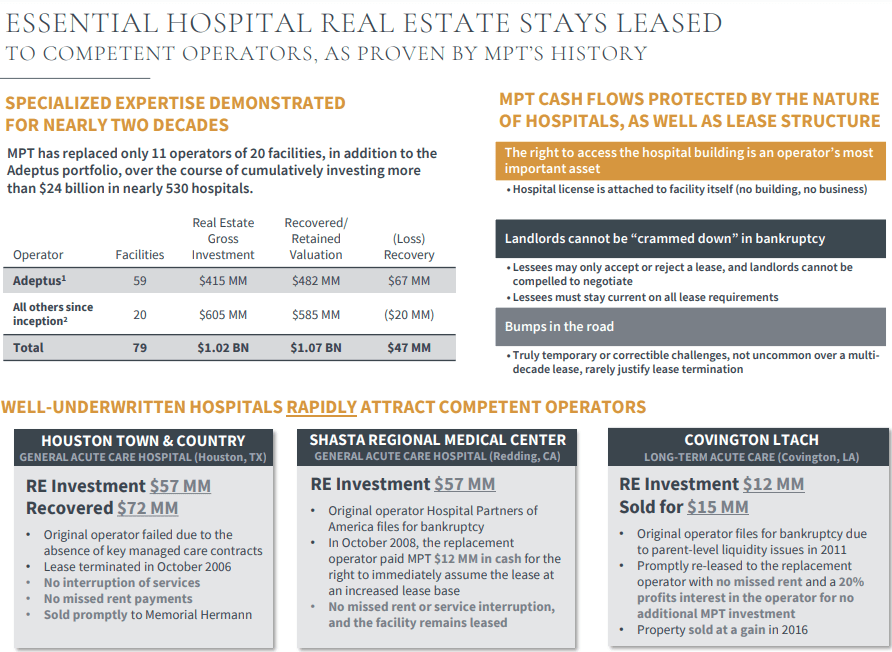
Of course, there is always a first time. We’ve seen other REITs like OHI negotiate a lower rent to ensure properties remain leased and avoid a tenant bankruptcy. Since MPW has significant exposure to Steward at various levels of the capital stack, it would arguably be in MPW’s interest to negotiate if Steward called them up and was in dire straits.
Let’s say MPW reduces Steward’s rent by 25%, a number similar to what we saw in several SNF restructurings (skilled nursing facilities). What impact does that have on MPW’s dividend coverage?
Steward’s rent is: $125 million/quarter, $500 million/year (page 11 in the Supplement). We also know that straight-line (non-cash) rent accounts for over 17% of MPW’s revenues. Let’s assume that Steward’s portion of straight-lining is lower than “average” since its leases are older. MPW doesn’t itemize straight-line rent by the operator, so let’s conservatively assume 10% of Steward’s rent is straight-lined. So Steward is actually paying approximately $450 million in cash rent. A 25% reduction would be $112.5 million off for a new cash rent of $337.5 million.
If that $112.5 million reduction went straight to the bottom line, it would reduce FFO, NFFO, and AFFO by $0.19/share per year or $0.0475/quarter.
Annual NFFO would be $1.65/share. Annual AFFO would be approximately $1.21/share. So if we assume a scenario where Steward files bankruptcy and negotiates a 25% reduction in rent, MPW would be valued at approximately 6.6x NFFO at current prices. MPW’s $1.16 dividend would still be covered by AFFO, albeit by a much tighter 104% – very similar to the dividend coverage that OHI currently has.
We consider this scenario extreme and unlikely. Yet it illustrates the margin of safety built into the current price for MPW. Even if such an event were to occur, MPW is attractively valued. While management always has the discretion to reduce the dividend, the dividend would likely still be covered by AFFO, MPW’s most conservative non-GAAP metric.
iStock
Conclusion
It never hurts to run some scenarios through the numbers. If a tenant needs a rent reduction of X%, how does that impact FFO/AFFO? You can input your own assumptions.
Don’t be afraid to dive in and adjust the numbers. You will want to adjust to do an apples-to-apples comparison between different companies. You will want to adjust to estimate the impact of future events that you believe are possible or probable.
Many investors will come up with an event that is obviously positive or negative, but they fail to quantify the impact. As a result, they end up overpaying or selling too low even when they correctly anticipate an event.
By doing your due diligence and being aware of non-GAAP metrics and how they are calculated, you can do a better job determining what risks and benefits are “priced in,” and which the market is overreacting to.
That will help you decide if the current price is worth a buy or a sell.
Be the first to comment