

syahrir maulana/iStock via Getty Images
Many issues weigh on the US stock market in early April 2022. In Q1, the leading indices all posted declines. The S&P 500 fell 4.95%, and the DJIA dropped 4.57%. The NASDAQ moved 9.10% to the downside, and the Russell 2000 lost 7.79%.
Rising inflation will accelerate the Fed’s interest rate hikes over the coming months. Higher interest rates make fixed-income instruments more attractive than equities causing capital to flow from the stock to the bond market. US corporate taxes will likely rise, weighing on dividend yields, share buybacks, and investment.
The war in Ukraine and the bifurcation of nuclear powers along ideological lines threaten world peace. Uncertainty can be the stock market’s worst enemy.
Markets reflect the economic and geopolitical landscapes. Meanwhile, the leading stock market indices have been trending higher over the past weeks. As of Friday, April 8, the APS was long the iShares Russell 2000 ETF product (NYSEARCA:IWM). An algorithmic approach ignores news, fundamentals, and other factors while embracing the market’s sentiment that creates price trends.
Small-cap stocks have been going nowhere fast- Trading in a range
The Russell 2000 index is the barometer for small-cap stocks with median market caps of $1.15 billion as of the end of 2021.
Chart of the E-Mini Russell 2000 Futures Contract (Barchart)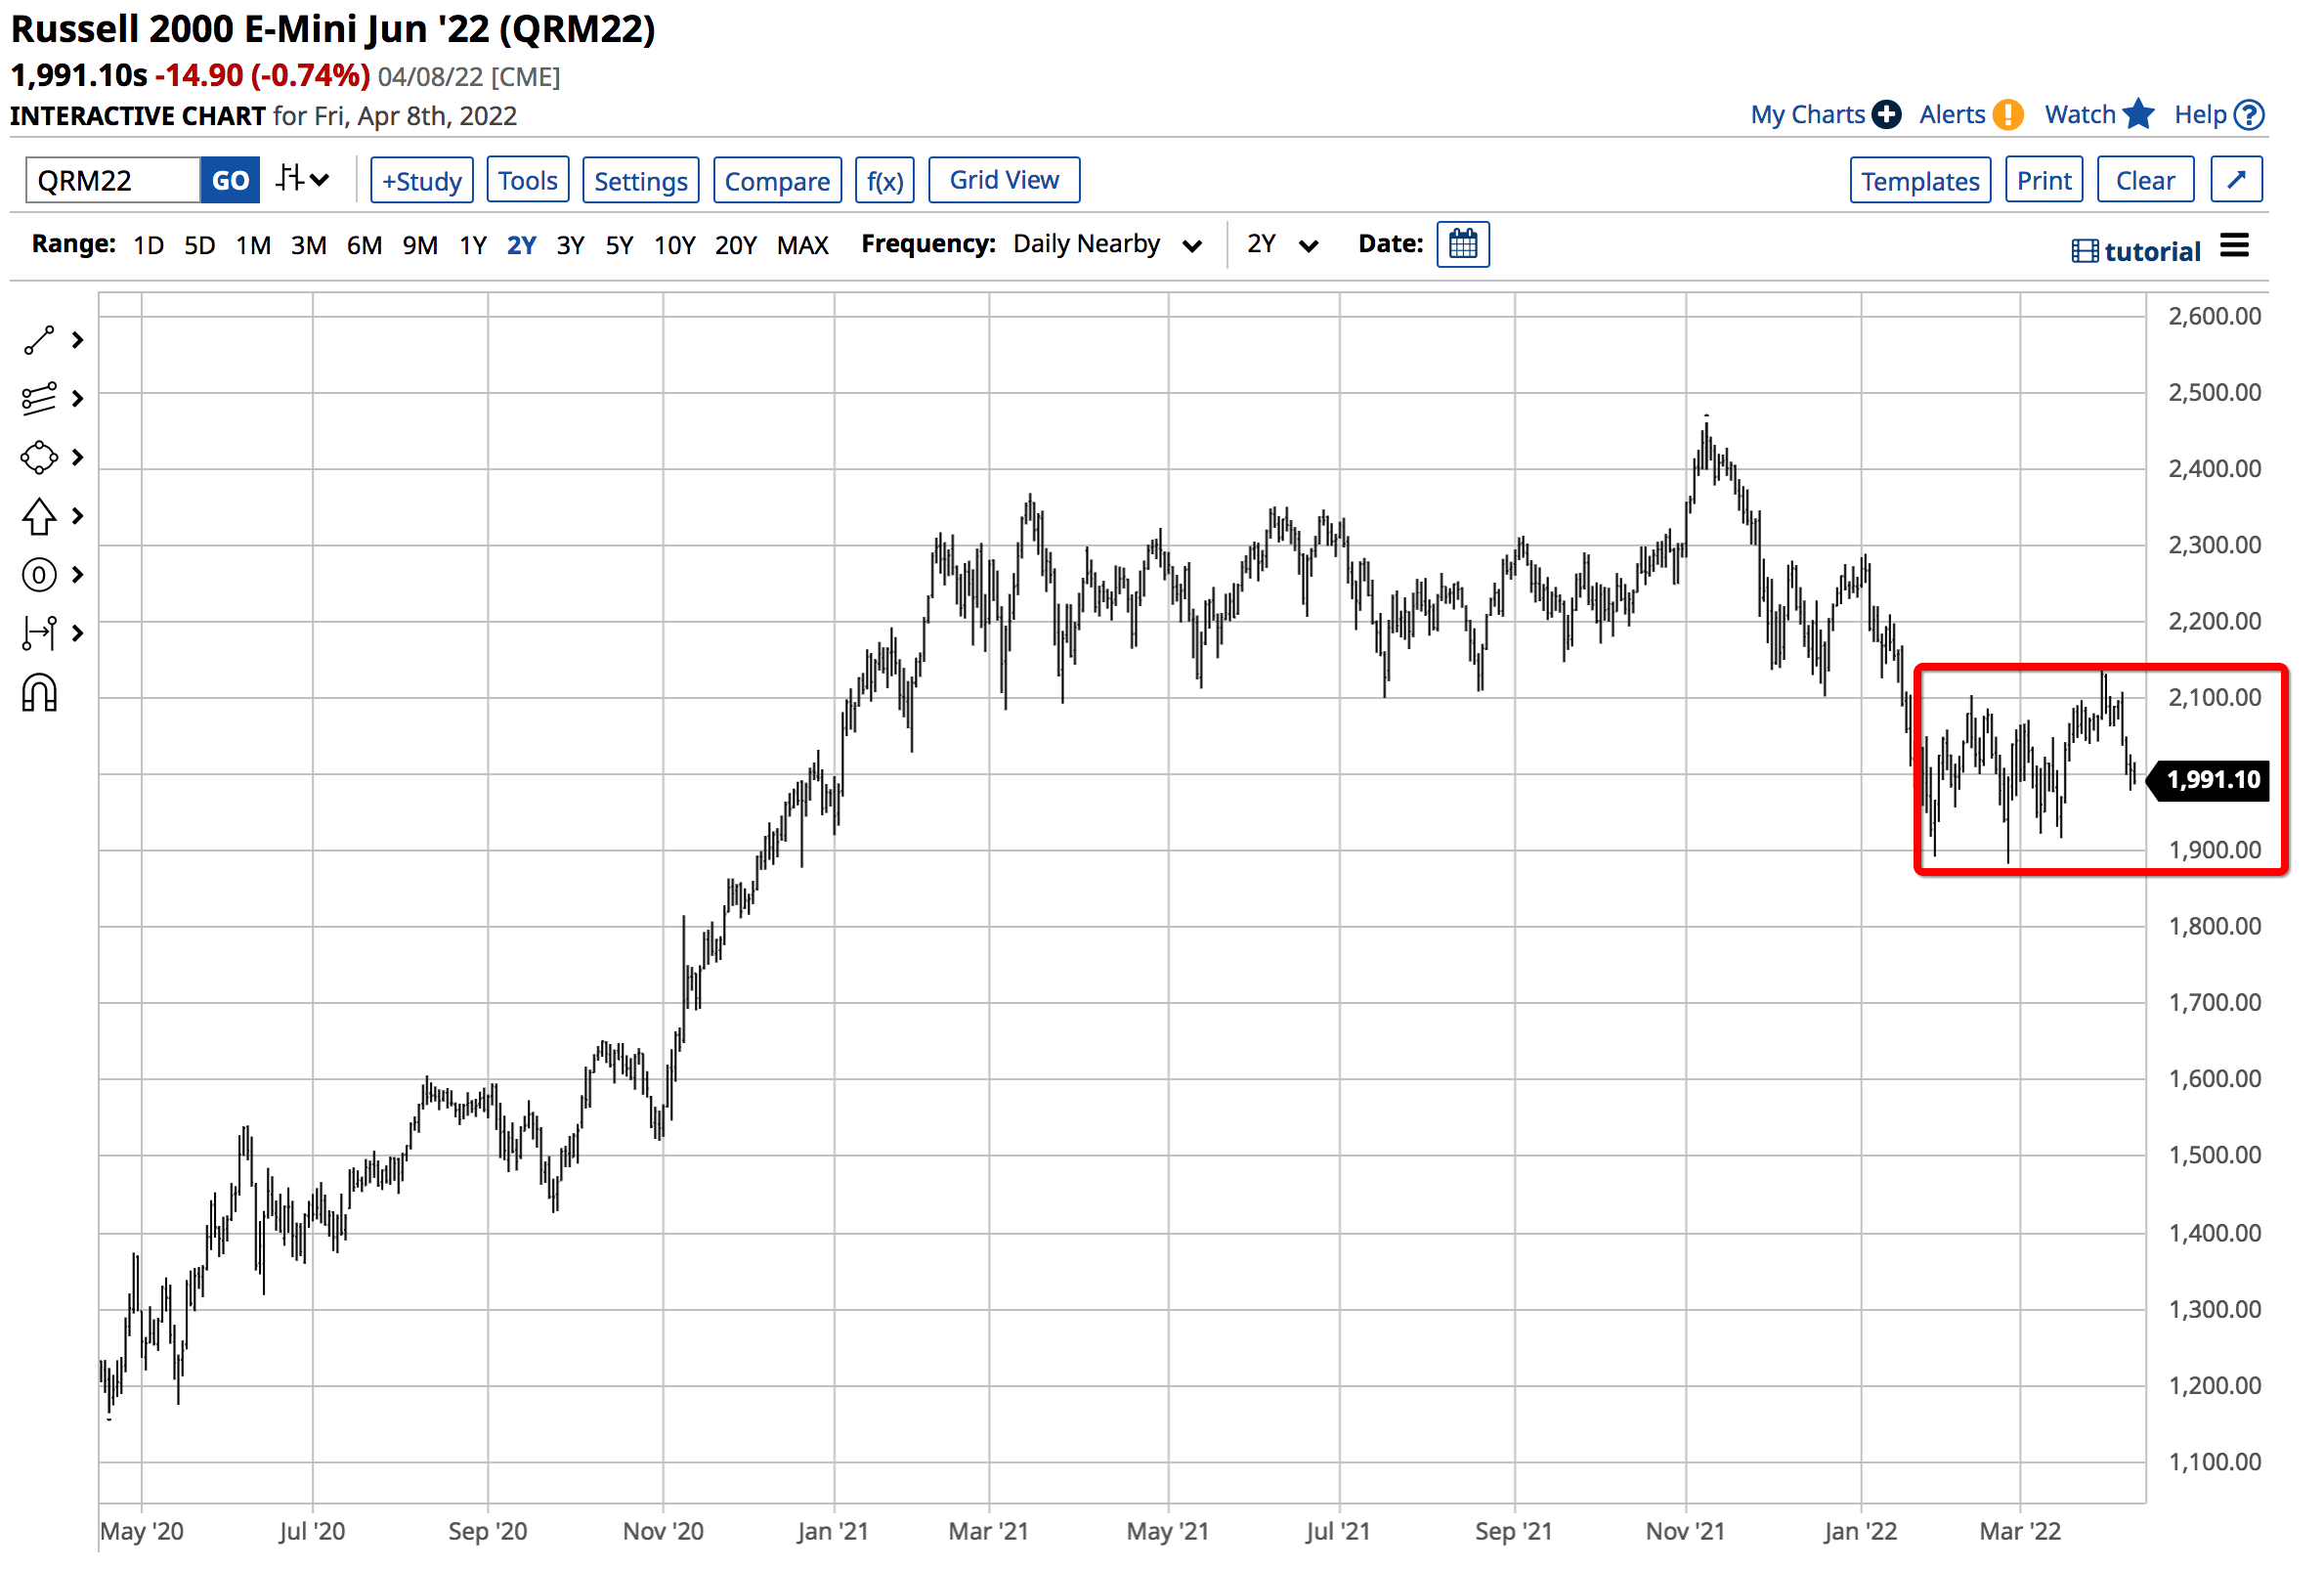
The chart of the nearby June Russell 2000 E-Mini Futures contract highlights the small-cap index is trading in a range from 1900 to 2100. After reaching a record high of 2,460.80 on November 8, 2021, the index was at the 1,991.10 level at the end of last week. The Russell 2000 was 19.1% below the early November 2021 high but was trading at the midpoint of the range since mid-January 2022.
An inverted yield curve poses risks for the small caps
A normal yield curve is where longer-term debt securities have higher yields than short-term notes. Yield curve inversion occurs when shorter-term rates move higher than longer-term interest rates.
A hawkish Fed threatens to cause yield curve inversions. Meanwhile, many economists use the yield curve as a long-lead recession forecasting tool. However, market volatility can lead to false signals. On April 4, Bank of America warned an inversion of the 2-year versus 10-year yield curve poses “a new risk” for small-cap stocks.
Performance of Small versus Large-Cap Stocks when the yield curve inverts (Source: BofA Global Research/MarketWatch)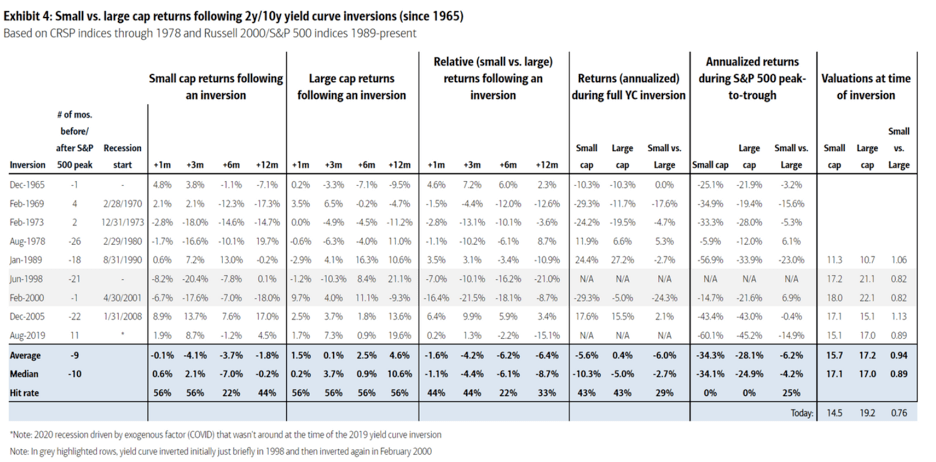
The chart shows that historically, small-cap stocks underperform large-cap equities 70% of the time when the yield curve inverts. On April 8, the US 2-Year Treasury Note yielded 2.507%, and the US 10-Year Treasury Note yielded 2.717%. Meanwhile, volatility in the bond market could lead to inversions over the coming weeks and months.
US 30-Year Treasury Bond Futures (CQG)
The monthly chart of the US 30-Year Treasury bond futures shows the long bond fell to a low of 142-26 on April 8, the lowest level since December 2018. From a trend following perspective, the long bond has been on an express train to challenge the October 2018 low and critical support level at 136-16.
The IWM is the highly liquid ETF that tracks the Russell 2000 index
The iShares Russell 2000 ETF product tracks the price action in the small-cap index. The fund summary states:
The iShares Russell 2000 ETF seeks to track the investment results of an index composed of small-capitalization U.S. equities. The Fund seeks investment results that correspond to the performance of the Russell 2000 Index. The Index measures the performance of the small-capitalization sector of the U.S. equity market. The Fund uses a Representative Sampling strategy to try to track the Index.
Source: Fund Summary for the IWM ETF Product (Barchart)
At the $197.87 level at the end of last week, the IWM had over $59.675 billion in assets under management. IWM trades an average of over 26.47 million shares each day and charges a 0.19% management fee. The components of the Russell 2000 Index are available via this link.
Higher lows in IWM since February 24- The erosion of money’s value
The IWM ETF product fell from $244.46 on November 8 to the $197.87 level on Friday, April 8, or 19.1%, as it tracked the Russell 2000 E-Mini futures contract.
Chart of the IWM ETF Product (Barchart)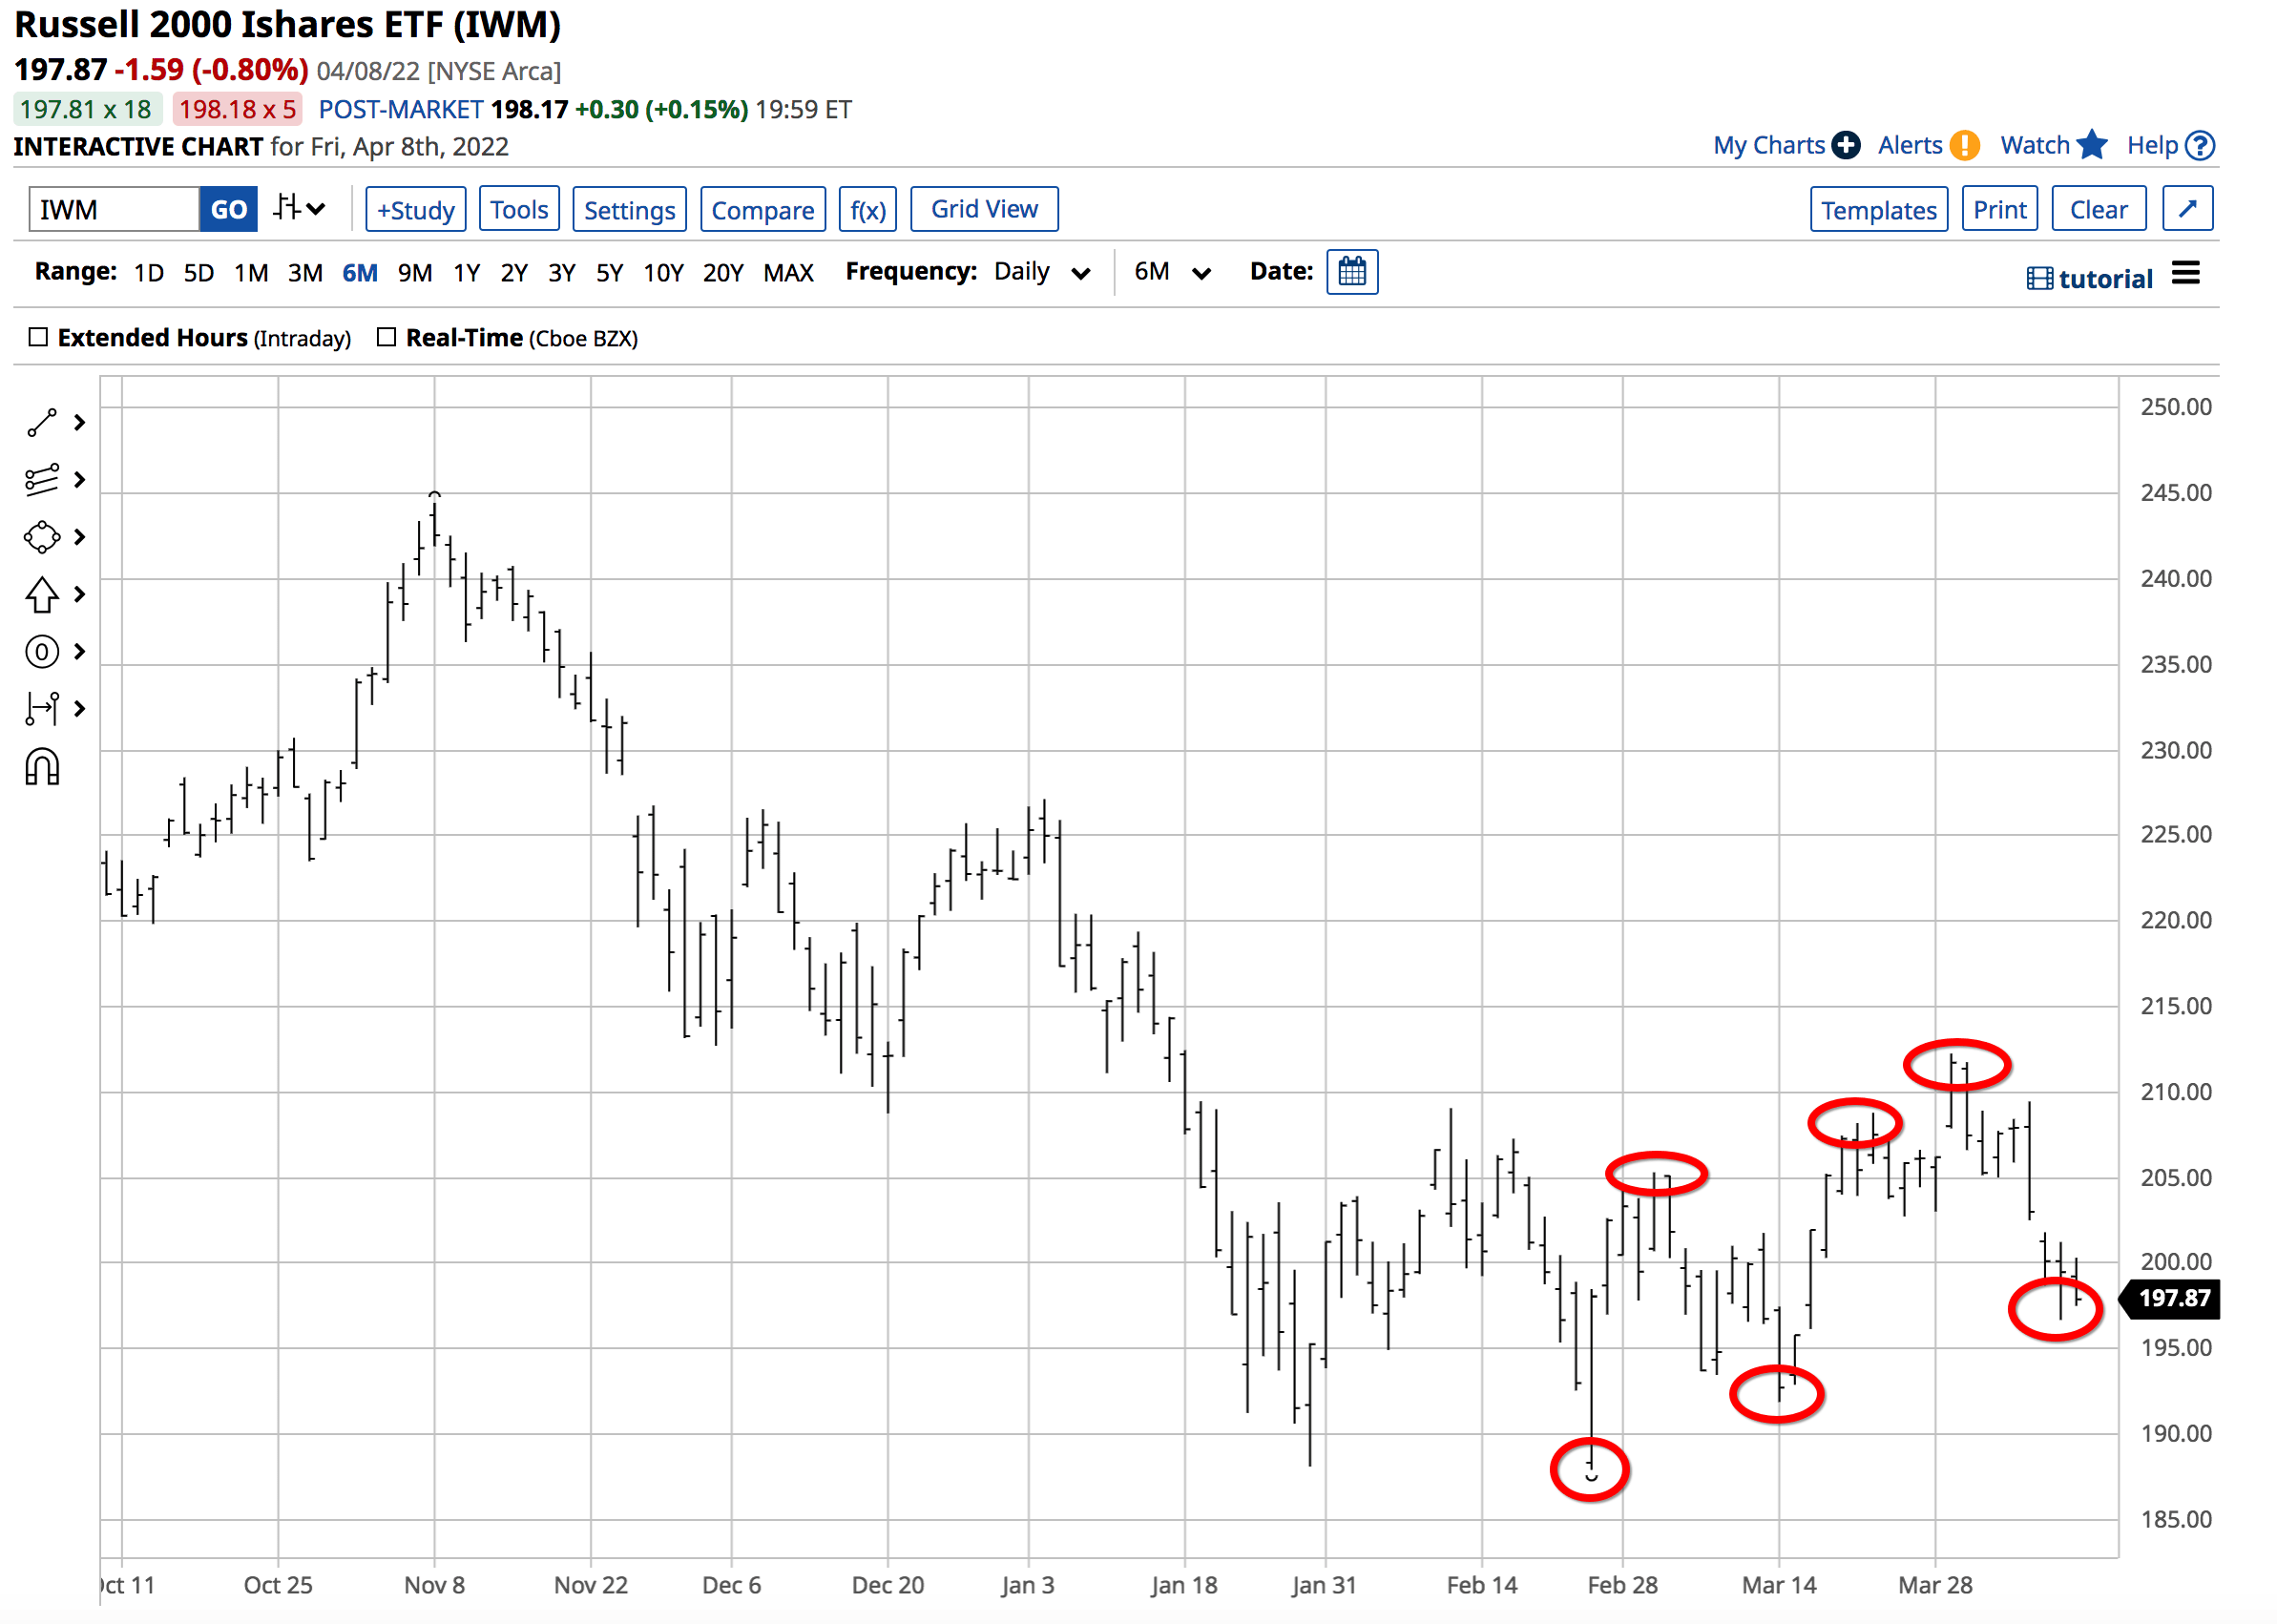
The chart highlights most of the activity has been between 190 and 210 since mid-January. However, after reaching a low of 187.92 on February 24, the day Russia invaded Ukraine, the IWM has made higher lows and higher highs. The short-term trend in the Russell 2000 was bullish at the end of last week.
Rising interest rates, raging inflation, and the first major war in Europe since WWII are not a bullish cocktail for stocks. However, inflation erodes money’s purchasing power, leading to higher asset prices and causing the Russell 2000 and other stock market indices to trend higher. If the gains in the stock market fail to keep pace with the erosion of purchasing power, the rise in the stock market becomes little more than a mirage.
The APS is long IWM, and it only follows trends
As of April 8, 2022, the trend in IWM shares was higher. The APS was long IWM shares as the trend is always your best friend in all markets. APS holds ten highly-liquid and optionable stocks and ETF products. IWM is a component as it meets the strategy’s requirements. At $197.87 per share, the ETF has been trending to the upside, making higher lows and higher highs.
Following trends via an algorithmic system requires strict adherence to rules. We do not attempt to pick bottoms or tops in any markets and are typically short at bottoms and long at tops. Taking the most significant percentage out of trends requires removing emotional impulses from trading and investing. We ignore fundamentals, news, and all of the daily noise. Our signals are never intraday. They can only change at the end of a session. Our system does not get caught up in the daily frenetic trading activity. News and noise are at a frenzied level with the war in Ukraine, sanctions, concerns over energy supplies, and the US administration’s moves to release oil from the SPR and punish oil companies. The APS is always long or short its components.
The price of any asset is always the correct price because it is the level where buyers and sellers meet in a transparent environment, the marketplace. Crowd behavior that determines trends can be the optimal market approach across all asset classes. As of April 8, the crowd’s wisdom points to a bullish trend in IWM despite the nervous trading conditions, falling bond market, and potential yield curve inversions. The APS will issue a sell signal for the IWM small-cap ETF product when the trend changes.
Be the first to comment