

niphon/iStock via Getty Images
Last week started with a hawkish pivot from Chairman Powell in a speech he gave Monday afternoon, asserting that a 50-basis-point rate increase was still a distinct possibility at one or more meetings this year. Each day thereafter we had a reminder of such from different Fed governors, but it wasn’t enough to prevent a second consecutive week of market gains. The bond market was not as fortunate, as prices fell, and yields rose sharply with the 10-year Treasury climbing to 2.5%. The stock market is clearly taking its cue from a strengthening economy, as evident in S&P Global’s Purchasing Managers Index for the manufacturing and services sectors.
edwardjones.com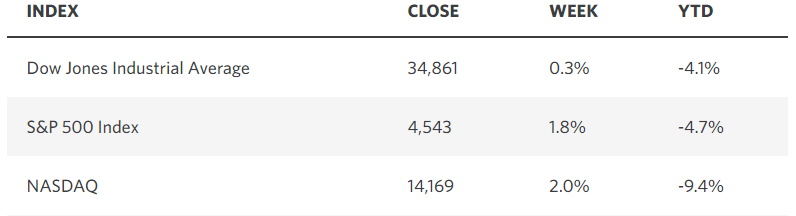
I do not believe the macroeconomic and market backdrop to be as bad as it was at the onset of the pandemic in March 2020 when the economy was being shut down to contain the spread of coronavirus, but that was the last time Bank of America’s sentiment indicator reached as extreme a bearish reading as it has today. That is a buy signal from a contrarian standpoint. The eight previous buy signals registered since 2013 produced an average return of 8% in the three months that followed, which falls in line with my market outlook like a puzzle piece. The bulls appear to be back in charge.
bloomberg.com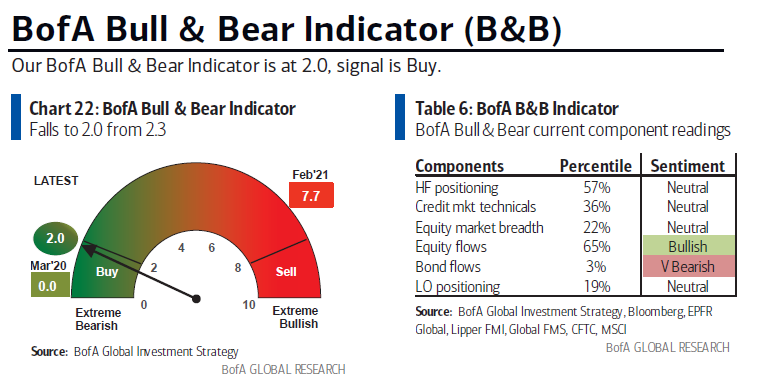
Why are rising interest rates not a more formidable headwind for stock prices at this stage? With just one 25-basis-point rate hike from the Fed behind us, the 2-year Treasury yield has already priced in as much as 200 basis points (2%) of additional tightening this year with a yield of 2.3%. Anything less will be good news for risk assets. Additionally, even if the Fed does raise short-term rates that high, it is not likely to slow the economy that much. This is because all of the debt incurred to battle the pandemic and pull the economy out of recession was assumed by the federal government. By contrast, debt ratios for consumers and corporations did not change. In fact, balance sheets strengthened as the value of real estate and the stock market soared. Both total household net worth and debt service costs have improved dramatically relative to disposable personal income.
stockcharts.com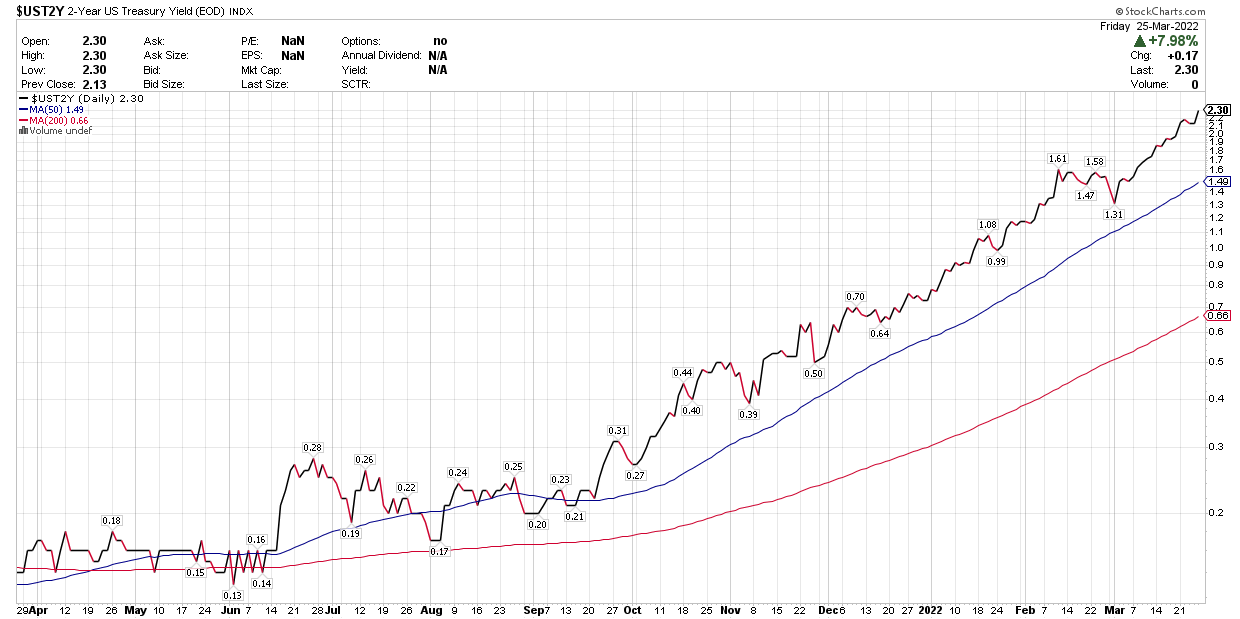
The increase in the 10-year Treasury yield, which is a proxy for mortgage rates, has increased more than 1% since last summer. That will soften demand for new and existing home purchases, but it does nothing to negatively impact those who already hold long-term, fixed-rate mortgages, which are the largest form of household debt.
stockcharts.com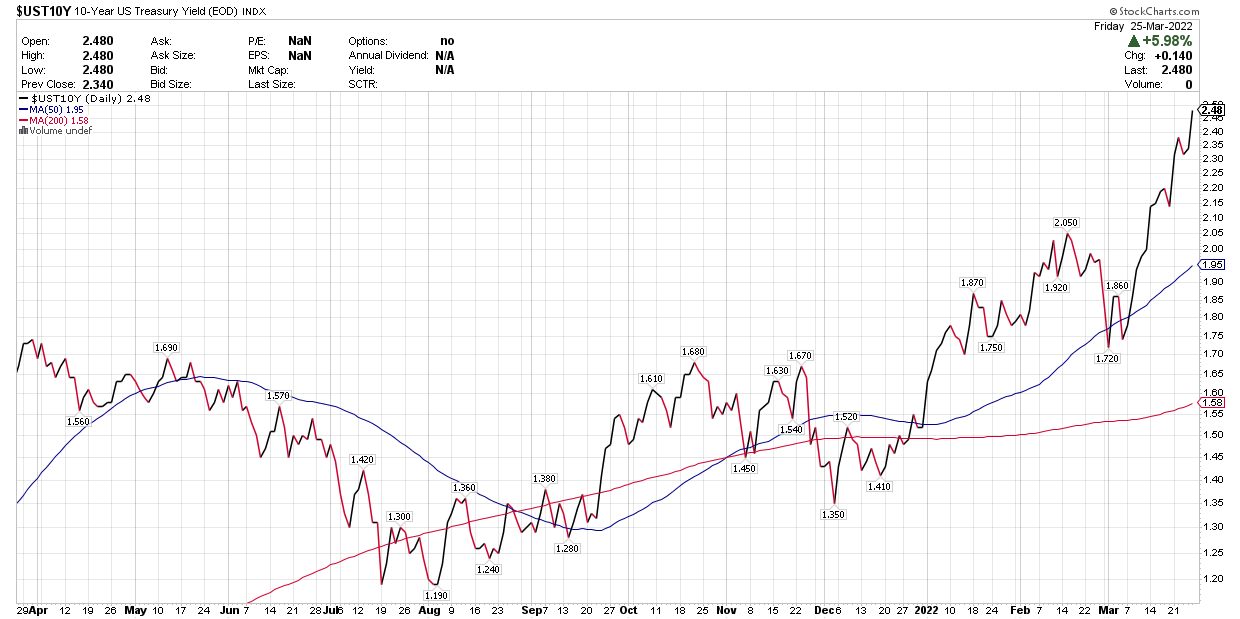
The good news is that the expected rate increases are already priced into markets and any easing of those expectations, due to a decline in the rate of inflation later this year, will be a tailwind. I expect the yield curve to steepen this year, as 2-year yields peak, and 10-year yields climb slowly upward towards 3-3.5%. That may keep the major market averages range bound this year, but the range will be wide enough for the S&P 500 to finish in positive territory.
The bad news is that both short- and long-term rates are likely to continue climbing in 2023. When real rates turn positive, which means that 5- and 10-year yields move above 5- and 10-year inflation expectations, the stock market will have competition from the bond market for investment flows that it hasn’t seen in a long time. That will weigh more on stock market valuations in 2023. For now, the bulls have the upper hand, but no one knows for how long.
Time in the market is almost always more successful than timing the market, but I have found a more effective compromise is to always maintain a core weighting in equities that I can increase by a predetermined percentage when I think the timing is right. From that standpoint, I can shift from defense to offense and back to defense again in an effort to enhance my returns without running the risk of missing out on the best performing days.
I began this year defensively positioned, expecting the consensus on Wall Street to start pricing in a much more aggressive tightening by the Federal Reserve as the year progressed, and anticipating a correction of 10% or more in the S&P 500 and far worse for the most highly valued stocks and speculative segments of the financial markets. This was outlined in The Year Ahead – 2022, but it came to fruition faster than I expected. The Russia-Ukraine conflict was an unforeseen shock that deepened the decline. Both were factored into market prices quickly. This is why I gradually leaned more offensive, looking for opportunities to increase exposure to stocks, as the major market averages carved out their bottoms in February and March.
Conditions look primed for the major averages to recover most of this year’s losses in the months ahead, fueled by better-than-expected first quarter earnings reports for S&P 500 companies. Should that occur, it may dictate reducing risk again, depending on whether or not the rate of inflation peaks during the second quarter, which is my expectation.
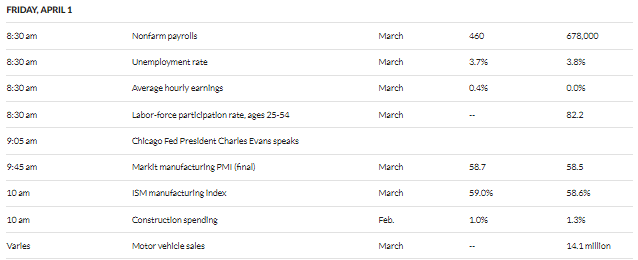
Economic Data
We are loaded with economic reports this week to close out the first quarter. The most important will be personal income and spending figures for February, which includes the Fed’s preferred inflation measure-the Personal Consumption Expenditures index. On Friday we have the jobs report for March.
marketwatch.com marketwatch.com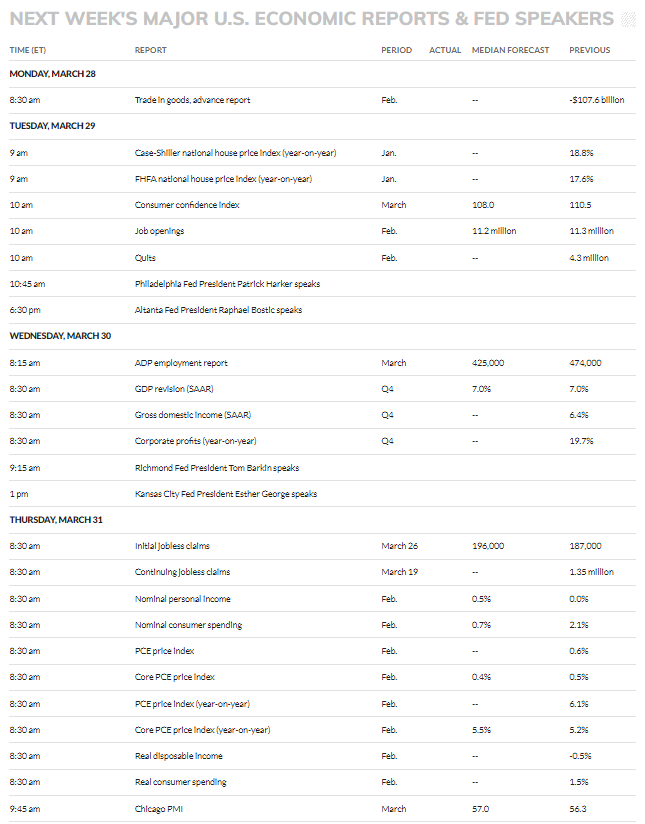
Technical Picture
The Philadelphia Semiconductor Index closed above its 50- and 200-day moving averages for the first time since January. This index typically leads the broad market, so its breakout is a positive for risk assets as we finish the first quarter and begin earnings season.
stockcharts.com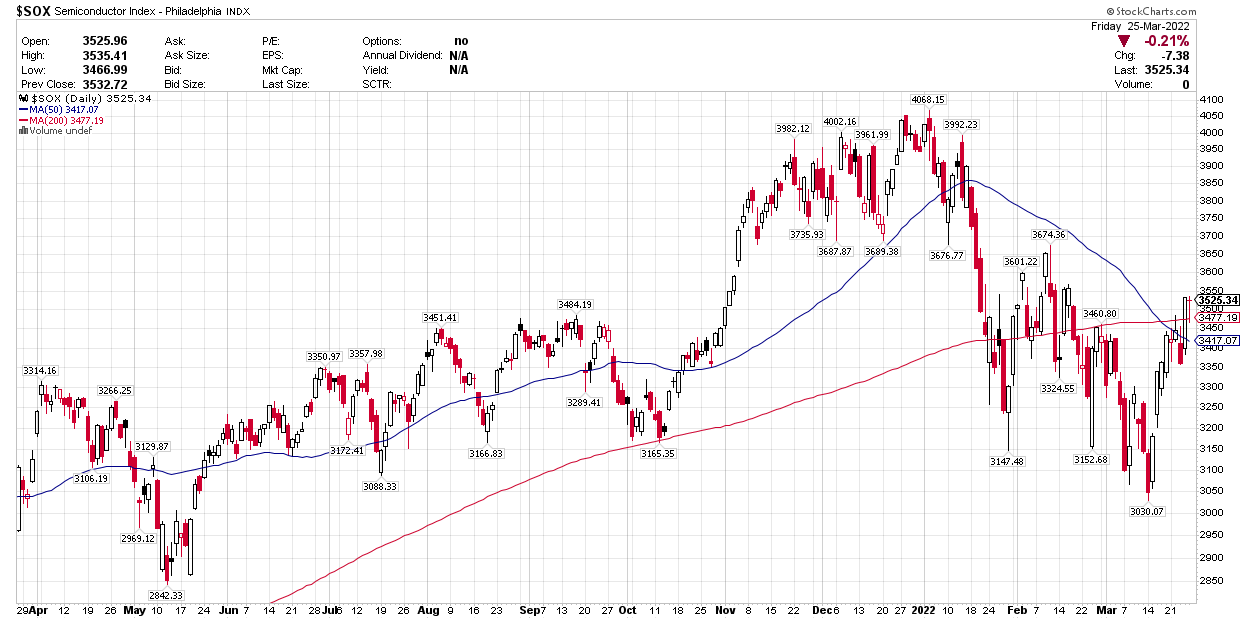
Be the first to comment