


relif
Earnings of Live Oak Bancshares, Inc. (NYSE: NYSE:LOB) will most probably be lower in 2023 due to the absence of one-time line items. However, subdued loan growth will support earnings. Further, the margin will likely expand once the up-rate cycle is over; thereby, supporting the bottom line. Overall, I’m expecting Live Oak Bancshares to report earnings of $3.27 per share for 2022, up 12%, and $2.27 per share for 2023, down 31% year-over-year. Compared to my last report on the company, I haven’t changed my earnings estimates much for 2023. The December 2023 target price suggests a moderate upside from the current market price. Based on the total expected return, I’m maintaining a hold rating on Live Oak Bancshares.
Economic Slowdown to Hurt Small Business Loans
Live Oak Bancshares successfully shifted its funds from lower-yielding assets into higher-yielding loans during the third quarter of 2022. The loan portfolio surged by a whopping 16.9% during the quarter, or 67.7% annualized.
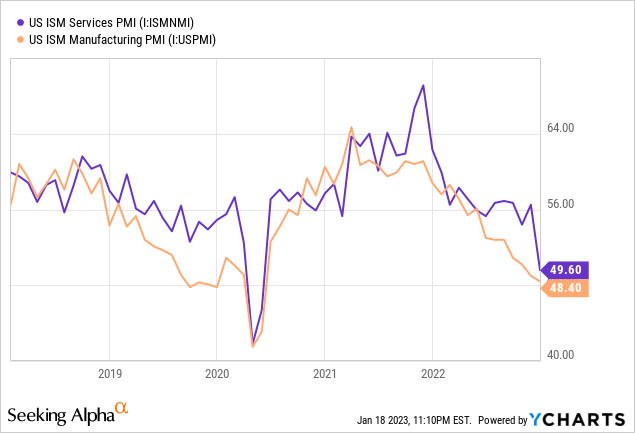
Going forward, loan growth will decelerate due to high-interest rates, which will dampen credit demand. Further, the economy’s health does not bode well for loan growth. Live Oak Bancshares specializes in lending to small businesses nationwide. As a result, the Purchasing Managers’ Index (“PMI”) is a good gauge of credit demand. As shown below, both the services and manufacturing PMI indices are currently below 50, which indicates a contraction in the economy. As a result, loan growth can be expected to significantly decelerate in the near term.
On the other hand, recent aggressive hiring will boost loan growth. The management mentioned in the conference call that it will be opportunistic in hiring in the future and that it expected expense growth to moderate in 2023.
Considering these factors, I’m expecting the loan portfolio to have grown by 3% in the last quarter of 2022, taking full-year loan growth to 28%. For 2023, I’m expecting loan growth to moderate to 13%. Further, I’m expecting deposits to grow in line with loans. The following table shows my balance sheet estimates.
| Financial Position | FY18 | FY19 | FY20 | FY21 | FY22E | FY23E |
| Net Loans | 1,811 | 2,599 | 5,093 | 5,458 | 6,978 | 7,854 |
| Growth of Net Loans | 37.2% | 43.5% | 95.9% | 7.2% | 27.9% | 12.6% |
| Other Earning Assets | 1,075 | 1,611 | 1,932 | 2,044 | 1,664 | 1,947 |
| Deposits | 3,150 | 4,229 | 5,713 | 7,112 | 8,657 | 9,744 |
| Borrowings and Sub-Debt | 1 | 3 | 1,542 | 318 | 35 | 32 |
| Common equity | 494 | 532 | 568 | 715 | 817 | 913 |
| Tang. Book Value Per Share ($) | 11.9 | 13.0 | 13.6 | 15.9 | 18.2 | 20.4 |
| Source: SEC Filings, Author’s Estimates(In USD million unless otherwise specified) | ||||||
Margin Expansion is Likely in the Second Half of the Year
Live Oak Bancshares was able to improve its net interest margin in the third quarter by improving its asset mix. The company shifted its funds from lower-yielding assets to higher-yielding loans. Had it not been for the mix improvement, Live Oak Bancshares’ net interest margin would have plunged as the company’s liabilities reprice faster than assets. Non-interest-bearing deposits, which anchor deposit costs for banks, made up just 2% of total deposits for Live Oak Bancshares.
As a result, the margin stands to suffer initially from rate hikes. However, when the up-rate cycle will end, the margin can benefit as deposit repricing will soon get over while asset repricing will continue. I’m expecting the Federal Reserve to increase the fed funds rate by 50 to 75 basis points in the first half of 2023 and then hold it steady in the second half of the year. Therefore, I believe there is a good chance the net interest margin will head northwards later this year.
Considering these factors, I’m expecting the margin to remain stable till the middle of 2023 and then rise by 10 basis points in the second half of the year.
Earnings to be Lower in 2023 Due to the Absence of Non-Recurring Items
Earnings will likely be lower in 2023 than in both 2022 and 2021 because of some one-time items that temporarily boosted non-interest income. In 2022, Live Oak Bancshares sold Finxact, Inc. while in 2021, the company reported unusually elevated equity security investment gains.
On the plus side, the anticipated loan growth and slight margin expansion will support earnings. Meanwhile, I’m expecting provisioning for expected loan losses to remain somewhat below normal. Despite the economic slowdown and threats of a recession, the outlook on provisioning for expected loan losses remains satisfactory because a large part of the loan portfolio is backed by government guarantees. As I’m expecting the loan growth to be lower than the historical average, the provisioning will also be lower than the historical average. I’m expecting the net provision expense to make up 0.52% of total loans in 2023, as compared to the last five-year average of 0.65%.
Overall, I am expecting Live Oak Bancshares to report earnings of $3.27 per share for 2022 and $2.27 per share for 2023. The following table shows my income statement estimates.
| Income Statement | FY18 | FY19 | FY20 | FY21 | FY22E | FY23E |
| Net interest income | 108 | 140 | 195 | 297 | 329 | 384 |
| Provision for loan losses | 13 | 20 | 41 | 15 | 39 | 41 |
| Non-interest income | 104 | 68 | 86 | 160 | 254 | 140 |
| Non-interest expense | 153 | 165 | 193 | 231 | 314 | 356 |
| Net income – Common Sh. | 51 | 18 | 60 | 167 | 190 | 101 |
| EPS – Diluted ($) | 1.24 | 0.44 | 1.43 | 3.71 | 4.24 | 2.27 |
| Normalized EPS – Diluted ($) | 0.73 | 0.36 | 0.71 | 2.91 | 3.27 | 2.27 |
| Source: SEC Filings, Earnings Releases, Author’s Estimates, Seeking Alpha(In USD million unless otherwise specified) | ||||||
In my last report on Live Oak Bancshares, which was issued in July 2022, I estimated earnings of $2.92 per share for 2022 and $2.29 per share for 2023. I haven’t changed my earnings estimate much for 2023. For 2022, I’ve increased my earnings estimate mostly because the non-interest income has been higher than I previously anticipated.
My estimates are based on certain macroeconomic assumptions that may not come to fruition. Therefore, actual earnings can differ materially from my estimates.
Maintaining a Hold Rating
Live Oak Bancshares is offering a dividend yield of just 0.39% at the current quarterly dividend rate of $0.03 per share. The earnings and dividend estimates suggest a payout ratio of 5% for 2023, which is close to the five-year average of 11%. The company has not changed its dividend level since 2018, and it’s unlikely that it will do so in 2023.
I’m using the historical price-to-tangible book (“P/TB”) and price-to-earnings (“P/E”) multiples to value Live Oak Bancshares. The stock has traded at an average P/TB ratio of 1.79 in the past, as shown below. I have removed the outlier in 2021 from the average.
| FY17 | FY18 | FY19 | FY20 | FY21 | T. Average | |
| T. Book Value per Share ($) | 11.5 | 11.9 | 13.0 | 13.6 | 15.9 | |
| Average Market Price ($) | 23.2 | 26.3 | 17.1 | 22.2 | 64.5 | |
| Historical P/TB | 2.01x | 2.21x | 1.32x | 1.63x | 4.06x | 1.79x |
| Source: Company Financials, Yahoo Finance, Author’s Estimates | ||||||
Multiplying the average P/TB multiple with the forecast tangible book value per share of $20.4 gives a target price of $36.5 for the end of 2023. This price target implies a 19.2% upside from the January 18 closing price. The following table shows the sensitivity of the target price to the P/TB ratio.
| P/TB Multiple | 1.59x | 1.69x | 1.79x | 1.89x | 1.99x |
| TBVPS – Dec 2023 ($) | 20.4 | 20.4 | 20.4 | 20.4 | 20.4 |
| Target Price ($) | 32.5 | 34.5 | 36.5 | 38.6 | 40.6 |
| Market Price ($) | 30.6 | 30.6 | 30.6 | 30.6 | 30.6 |
| Upside/(Downside) | 5.9% | 12.6% | 19.2% | 25.9% | 32.5% |
| Source: Author’s Estimates |
The stock has traded at a trimmed average P/E ratio of around 13.9x in the past, as shown below. I have removed the outliers in 2018 and 2019 from the average.
| FY17 | FY18 | FY19 | FY20 | FY21 | T. Average | |
| Earnings per Share ($) | 2.65 | 1.24 | 0.44 | 1.43 | 3.71 | |
| Average Market Price ($) | 23.2 | 26.3 | 17.1 | 22.2 | 64.5 | |
| Historical P/E | 8.7x | 21.2x | 38.8x | 15.6x | 17.4x | 13.9x |
| Source: Company Financials, Yahoo Finance, Author’s Estimates | ||||||
Multiplying the average P/E multiple with the forecast earnings per share of $2.27 gives a target price of $31.5 for the end of 2023. This price target implies a 2.8% upside from the January 18 closing price. The following table shows the sensitivity of the target price to the P/E ratio.
| P/E Multiple | 11.9x | 12.9x | 13.9x | 14.9x | 15.9x |
| EPS – 2023 ($) | 2.27 | 2.27 | 2.27 | 2.27 | 2.27 |
| Target Price ($) | 27.0 | 29.2 | 31.5 | 33.8 | 36.0 |
| Market Price ($) | 30.6 | 30.6 | 30.6 | 30.6 | 30.6 |
| Upside/(Downside) | (11.9)% | (4.5)% | 2.8% | 10.2% | 17.6% |
| Source: Author’s Estimates |
Equally weighting the target prices from the two valuation methods gives a combined target price of $34.0, which implies an 11.0% upside from the current market price. Adding the forward dividend yield gives a total expected return of 11.4%.
The market price of Live Oak Bancshares has declined by 59% over the last 12 months. However, I think it is still not at an attractive enough level. Therefore, I’m maintaining a hold rating on the stock. I would only consider investing in Live Oak Bancshares if its price dipped by a further 5% from the current level.
Be the first to comment