

Bet_Noire/iStock via Getty Images
In December, I named LSI the best bet in Storage REITs. In January, I identified Storage REITs as one of the 7 REIT sectors most likely to outperform in 2022. And in February, I named LSI as one of the top 12 REITs for the next 12 months. In April, Steven Cress named Life Storage, Inc. (NYSE:LSI) one of the three best REITs to buy to fight inflation.
Shows what we know. There are still several months to go on my predictions, but at least so far, it’s not looking good for me, or for Mr. Cress.
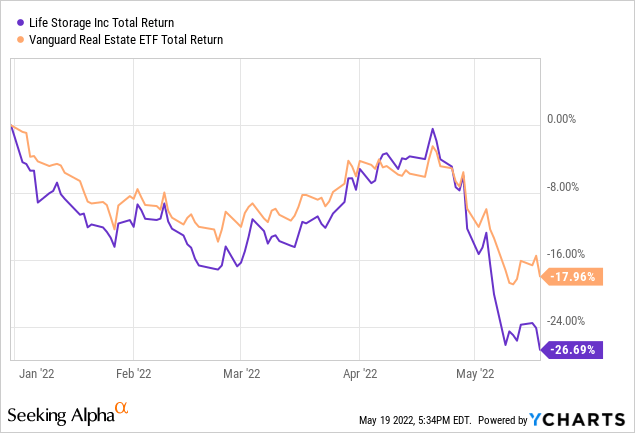
YTD (year-to-date) LSI is underperforming the Vanguard Real Estate ETF (VNQ) by 827 basis points (bps). Oof!
What’s going on? Is the company in some kind of trouble?
Meet the company
Life Storage Inc.
LSI opened its first self-storage facility in 1985, and is headquartered in Williamsville, NY. The company now operates 1,105 stores in 36 states, and sports a 93.7% same-store occupancy rate, up from 92.4% in Q3 2020. The company owns 727 of those facilities outright, with a stake in another 121 through joint ventures. LSI also manages a further 261 for third parties.
Geographic Distribution of LSI Assets (LSI investor presentation May 2022)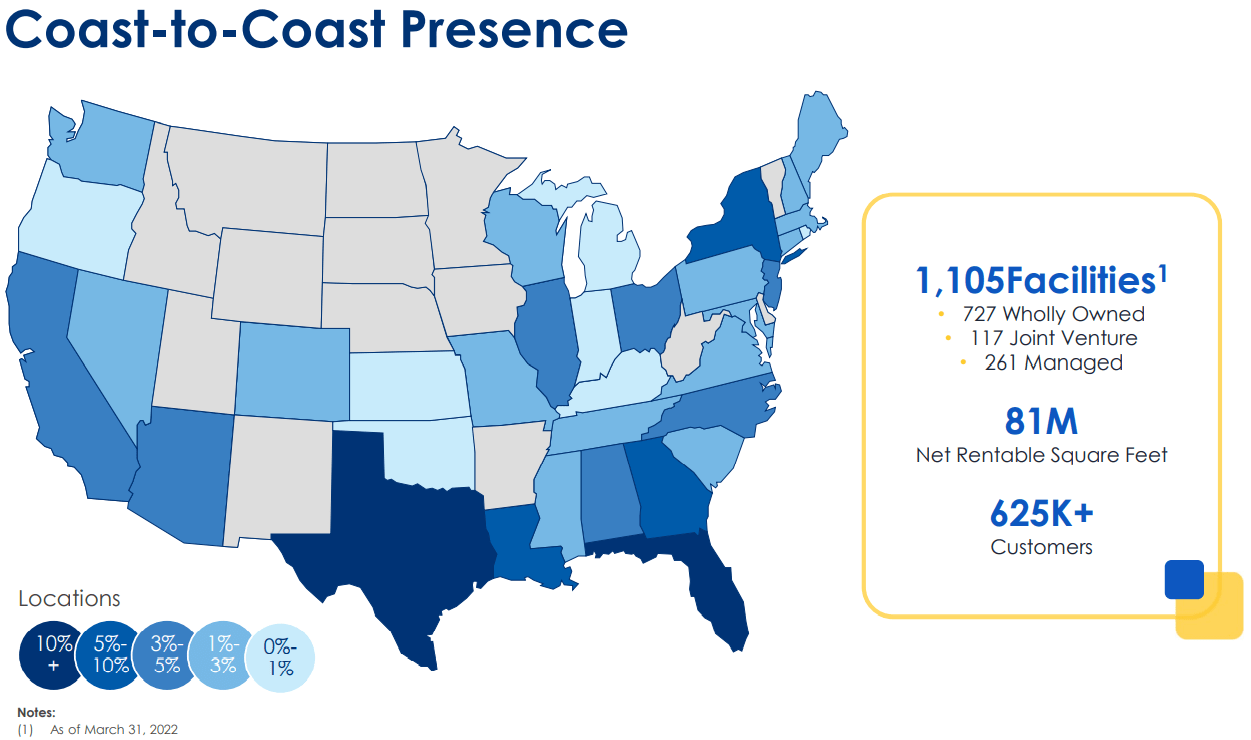
LSI is well diversified geographically, with only 8.7% of its revenues coming from the New York area, and its top 10 markets accounting for less than half its revenue.
Geographic breakdown of LSI revenues (Company investor presentation for May 2022 Is it in trouble?)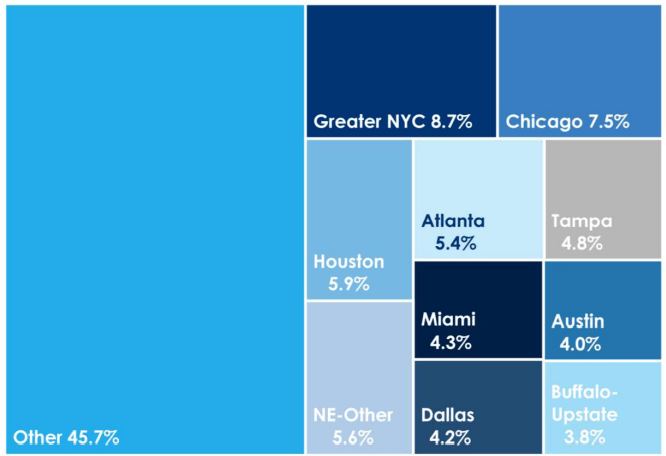
This also reflects the company’s emphasis on both primary and secondary markets in their acquisition strategy. The work-from-home trend has created a net migration out of big cities and into smaller towns and the Sun Belt. LSI’s strong presence in secondary markets will play in their favor. LSI has a larger percentage of its assets in the Sun Belt and in non-major markets than any storage REIT except National Storage Affiliates (NSA).
Hoya Capital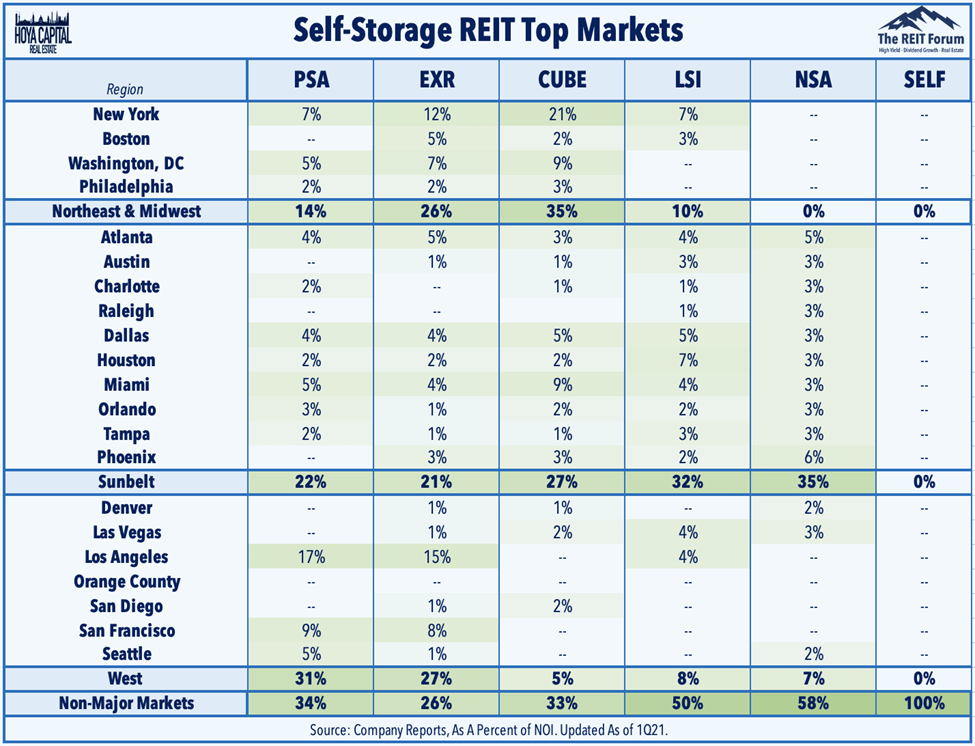
The company is seeing strong population growth of 10% or more across 53 of its markets, including 8 of its top 10. People tend to choose the storage facility closest to their home.
Population growth in LSI markets (Company investor presentation for May 2022)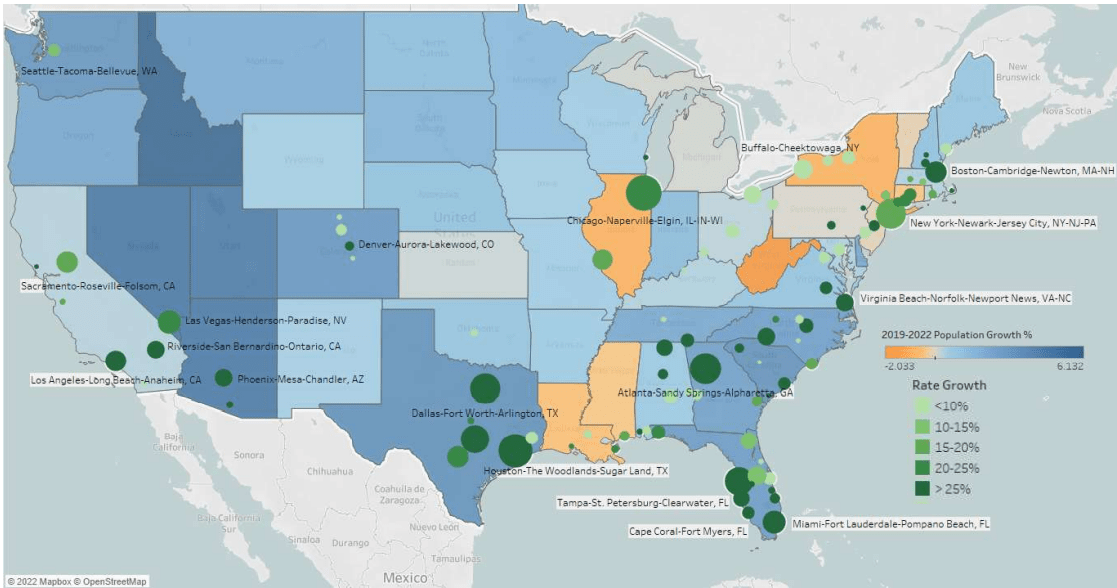
But what really sets this company apart is two things they have pioneered:
- Online, touchless self-service rentals (about 35% of all rentals currently)
- Storage for e-commerce (their “Warehouse Anywhere” program)
LSI does not build new facilities. They grow by acquisitions, and by expansion and enhancement of their existing buildings. Their pace of acquisitions has been rapidly accelerating for 3 years, and is off to a good start this year, with $445 million invested through April. Which brings us to quarterly results.
Life Storage Inc. pace of acquisitions (Company investor presentation for May 2022)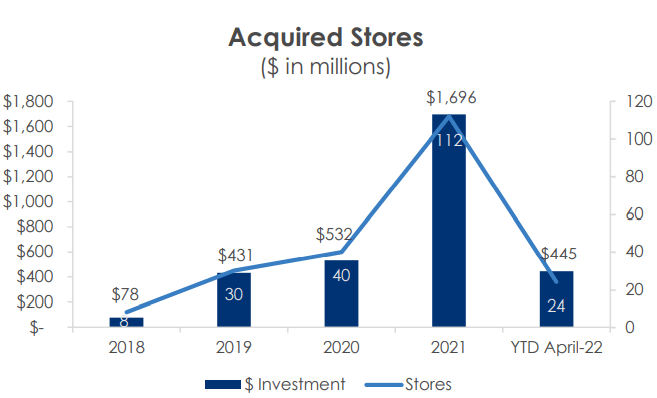
Quarterly results are in
Life Storage reported quarterly results May 5. Here are the highlights:
- Total revenues of $233.5 million, up 35.8% YoY (year over year)
- Income from operations of $97.5 million, up 47.9% YoY
- Earnings per share of $0.88, up 39.7% YoY
- FFO (funds from operations) per share of $1.44, a 33.3% increase YoY
- Same store revenue up by 15.6% YoY
- Same store NOI (net operating income) up by 21.9% YoY
- Net cash from operations of $105.3 million, up 57.0% YoY
- Ancillary income (reinsurance, fees, etc.) $28 million, up 29.5% YoY
- Acquired 18 stores for $351.5 million (a $1.4 billion annual pace)
- Added 25 stores to the Company’s third-party management platform.
These are sensational numbers. I don’t think CEO Joe Saffire was exaggerating when he said this on the Q1 earnings call:
We are off to a very strong start for the year as we continue to demonstrate strong pricing power in our footprint and robust acquisition activity. . . With a strong pipeline ahead, healthy consumer demand trends, and our ability to continue to operationally execute on our strategic initiatives, we are well positioned to continue to grow shareholder value through 2022 and beyond.
Growth metrics
Here are the 3-year growth figures for FFO (funds from operations), TCFO (total cash from operations), and market cap.
| Metric | 2017 | 2018 | 2019 | 2020 | 2021 | CAGR |
| FFO (millions) | $229 | $256 | $266 | $277 | $400 | — |
| FFO Growth | — | 11.8% | 3.9% | 4.1% | 44.4% | 14.96% |
| TCO (millions) | $249 | $262 | $279 | $299 | $434 | — |
| TCO Growth | — | 5.2% | 6.5% | 7.2% | 45.2% | 14.90% |
| Market Cap (billions) | $4.14 | $4.33 | $5.05 | $5.90 | $12.56 | — |
| Market Cap Growth % | — | 4.6% | 16.6% | 16.8% | 112.9% | 31.98% |
Source: TD Ameritrade, CompaniesMarketCap.com, and author calculations
These are sparkling, FROG-worthy growth numbers, and this resourceful and innovative company kept growing right through the pandemic.
Meanwhile, here is how the stock price has done over the past 3 twelve-month periods.
| Metric | 2018 | 2019 | 2020 | 2021 | 3-yr CAGR |
| LSI share price May 19 | $59.83 | $63.69 | $58.85 | $96.98 | — |
| LSI share price Gain % | — | 6.5% | (-7.6) | 64.8 | 12.83% |
| VNQ share price May 19 | $75.84 | $87.86 | $71.89 | $94.23 | — |
| VNQ share price Gain % | — | 15.8% | (-18.2) | 31.1 | 5.58% |
Source: MarketWatch.com and author calculations
LSI has outperformed VNQ in each of the past two years, and over the trailing 3-year period, has doubled VNQ in share price Gain. Investors who purchased shares on May 19, 2019 have been rewarded with price Gain of 12.83% per year on average, and a total return north of 16%.
Balance sheet metrics
Life Storage Inc.’s bond-rated balance sheet has strong liquidity and no serious weaknesses. This company is a bona fide FROG.
| Company | Liquidity Ratio | Debt Ratio | Debt/EBITDA | Bond Rating |
| LSI | 2.06 | 18% | 5.4 | BBB/Baa2 |
Source: Hoya Capital Income Builder, TD Ameritrade, and author calculations
As of Q1 2022, LSI was holding about triple the cash ($55 million) they were holding in Q1 2021 ($18 million), and have $365 million available on their $500 million line of credit. The weighted average interest rate on LSI’s $2.785 billion debt is 3.2%, with a 6.3 year weighted average maturity, and 95% of their equity is unencumbered.
Dividend metrics
LSI is a strong payer, with an above-average current Yield and superb dividend growth rate, resulting in a juicy 5.49% Dividend Score. Dividend Score projects the Yield three years from now, on shares bought today, assuming the Dividend Growth rate remains unchanged.
| Company | Div. Yield | Div. Growth | Div. Score | Payout Ratio | Div. Safety |
| LSI | 3.66% | 14.5% | 5.49 | 65% | B+ |
Source: Hoya Capital Income Builder, TD Ameritrade, Seeking Alpha Premium
The payout ratio of 65% is a little high, but nowhere near enough to endanger the quarterly payout. In fact, the dividend is a little too safe, at B+. The company retains more money for acquisitions than most, but investors have had little or nothing to complain about in the dividend department. LSI has raised its dividend 35% in the last 12 months alone.
Valuation metrics
Growth like this company has achieved usually comes at a premium price, but this company is on sale at just 18.0x FFO, and a discount of (-15.9)% to NAV.
| Company | Div. Score | Price/FFO | Premium to NAV |
| LSI | 5.49% | 18.0 | (-15.9)% |
Source: Hoya Capital Income Builder, TD Ameritrade, and author calculations
The YTD sell-off in LSI shares appears to have little or nothing to do with the company itself, and much more to do with the huge rotation from growth to value. This company appears to be bristling with good health.
What could go wrong?
LSI runs the same risks as any other company that relies on acquisitions for external growth, as those acquisitions don’t always prosper as expected. Changes in interest rates may affect their ability to acquire or finance new properties or redevelop existing sites, or may suppress cap rates.
The REIT storage sector is very competitive, with several strong players, including National Storage Affiliates, especially in the prized Sun Belt markets. Increased competition for deals could also drive down cap rates on new acquisitions.
Self-storage units are relatively easy to build, and industry oversupply could depress rental growth. So far, however, supply does not appear to be catching up.
Higher interest rates could raise LSI’s cost of debt funding (currently 3.2%).
Investor’s bottom line
Sparkling growth, a strong balance sheet, superb dividends, and a bargain price. What’s not to like? The REIT market overall may continue to sell off in the short term, but as I see it, the upside potential is much greater than the downside risk, at this point in the drawdown. The sell-off in LSI shares seems to have little to do with the company itself, and thus has created an attractive entry point. I rate this company a Strong Buy, and I am increasing my own position.
Seeking Alpha Premium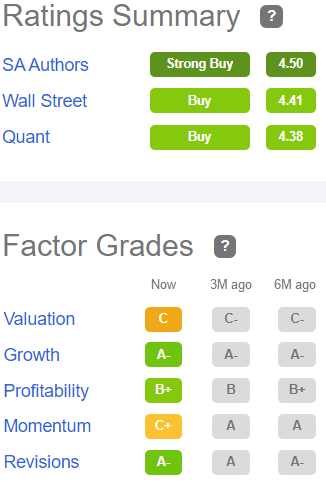
For once, I am not alone. The Seeking Alpha Quant Ratings rate LSI a Buy, as do the Wall Street Analysts, with an average price target of $153.33, implying 39.6% upside. Short-term trader Zacks concurs, and so does The Street.
TipRanks and Ford Equity Research are less enthusiastic, rating the company a Hold.
Be the first to comment