

DragonImages
The 5th bear market rally may be underway.
CNBC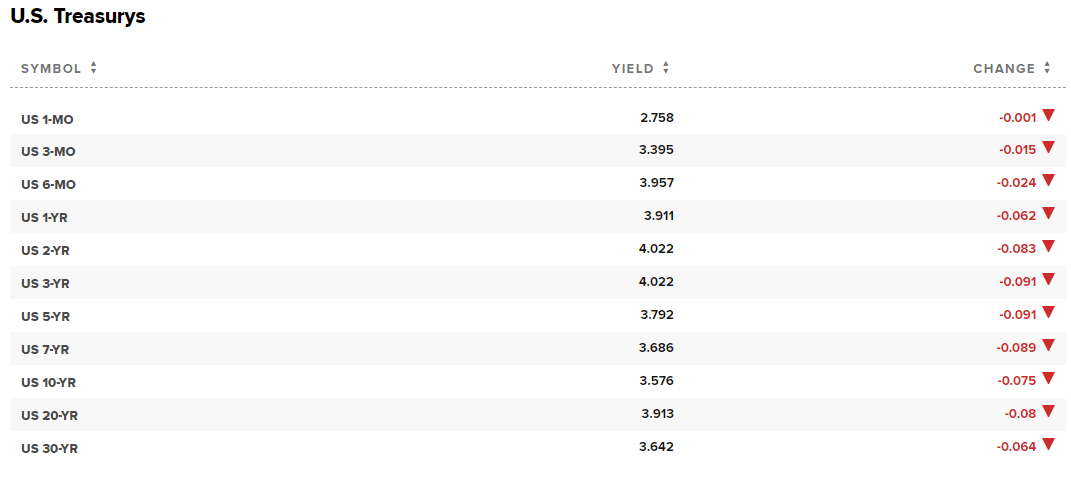
The stock market is up about 4% in the last two days, most likely a short-term relief rally caused by bonds being the most oversold in recent history.
Daily Shot 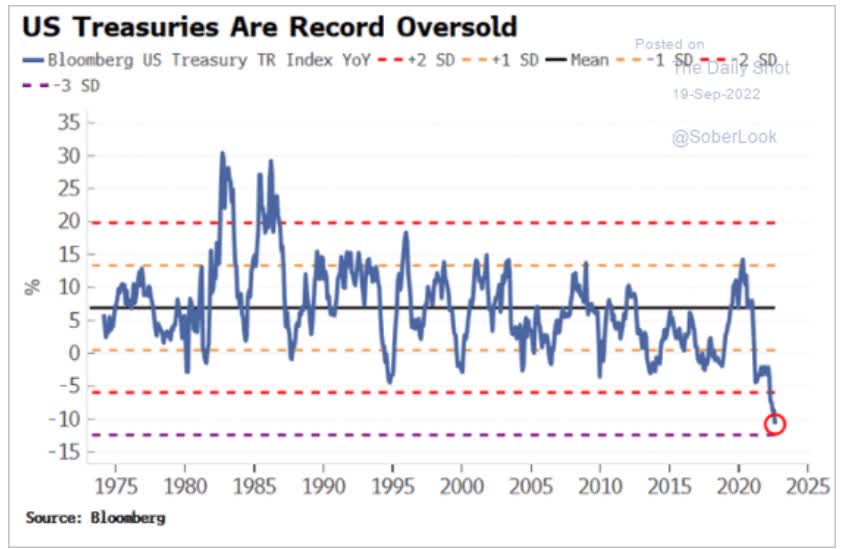
Short-term US treasuries tend to track the Fed, so those are most likely to keep rising until the Fed pauses.
CME Group
The bond market now thinks the Fed likely will pause at 4.25% rather than 4.5% as the Fed’s dot plot forecast says.
That’s rather speculative, given a few key facts.
- There is a 9 to 12 month between Fed hikes and economic impact
- thus slower growth (especially in the jobs market) might now show up until Q1 2023
- 280K net jobs are expected for Friday’s job report
- 200K to 390K range
The NY Fed estimates 115K net monthly jobs is necessary to keep up with population growth. According to Bloomberg, Toronto-Dominion, one of the most accurate economist teams on earth, thinks the Fed won’t consider pausing early unless US jobs creation is under 100K per month.
And TD says the Fed MIGHT pause early if the labor market weakens that much. Cleveland Fed President Mester said last week that the Fed won’t be deterred by recession alone.
Vice Chairman Brainard said that the only thing that would cause an early pause is financial instability.
NY Fed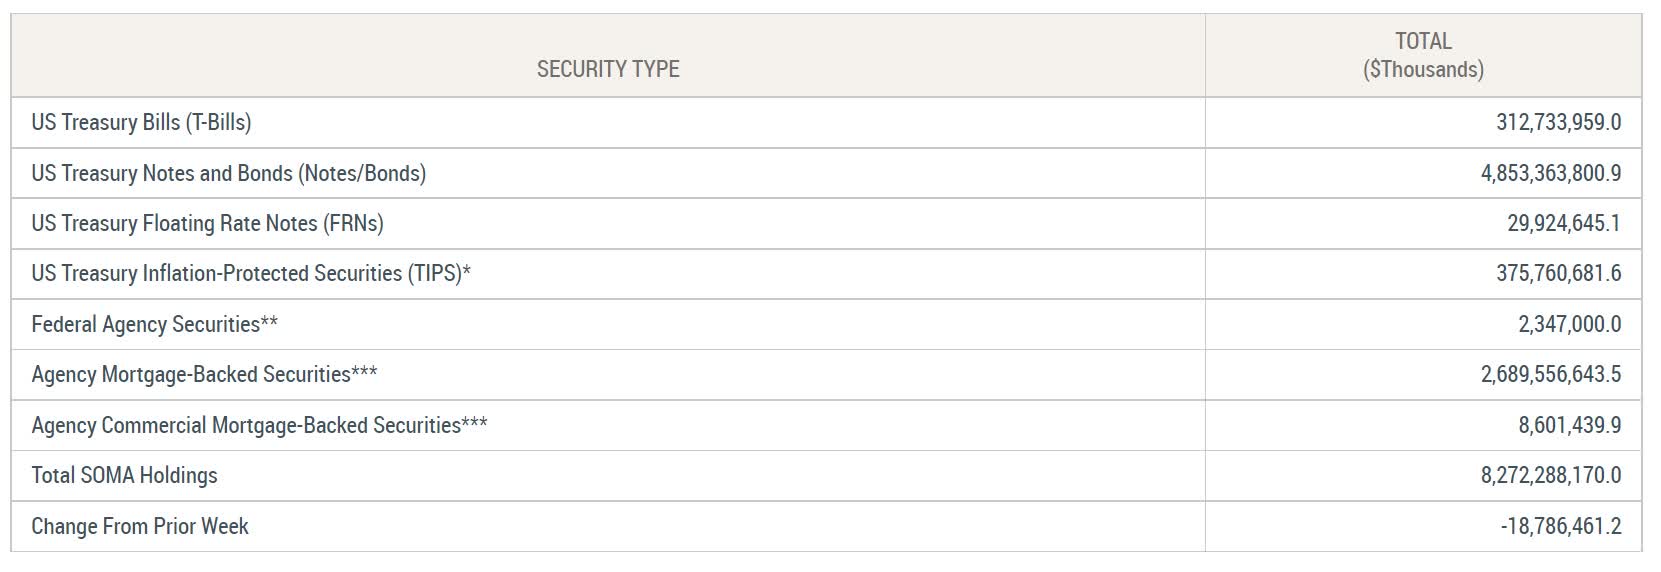
The Fed’s historic mega-QT is accelerating on schedule, now up to $19 billion per week. By November it will be at its full $95 billion monthly strength.
Daily Shot 
QT is designed to suck liquidity out of the economy, and it’s certainly doing that, especially in the US treasury market.
But let’s not forget what Fed Chair Powell said at the most recent press conference.
- the Fed plans to hike above core inflation (PCE).
- and then pause until core inflation falls “at least 1%” below the peak Fed funds rate
So what’s happening with core inflation?
Cleveland Fed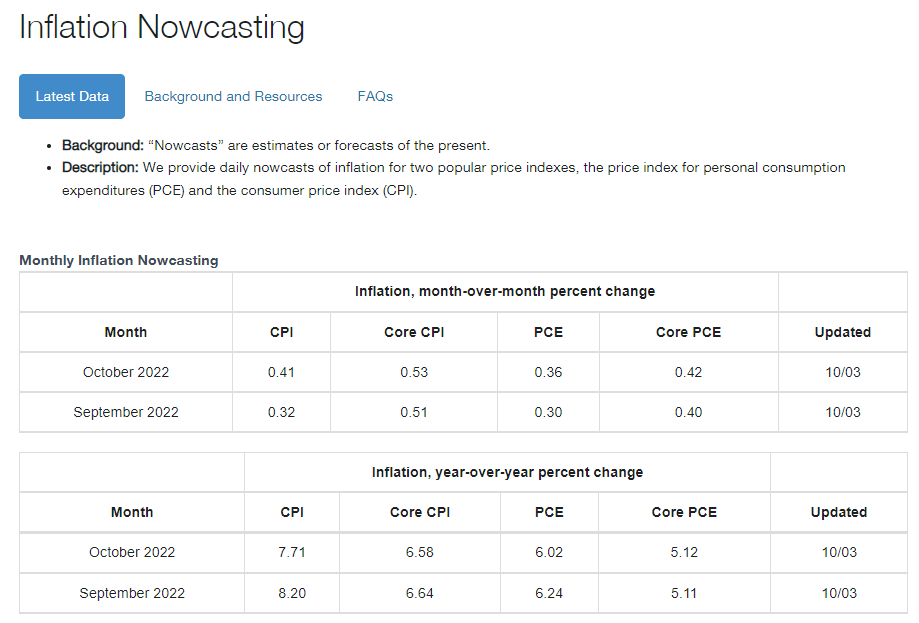
The Cleveland Fed’s inflation model now thinks core inflation will get stuck at 5.1%, at least for the next two months.
With housing 40% of core inflation, and not expected to peak (in the monthly inflation reports) until January to June 2023, it’s possible that core inflation remains sticky around 5%.
This means the Fed would likely hike to 5.25% before pausing and take short-term bond yields to around 4.75% to 5% as well.
The good news is that short-term bonds have such low duration that if you own 2-year yields (like SHY) a 1% increase in yields = about a 2% decrease in price.
Long bonds aren’t expected to rise nearly as much, especially once the economy really shows signs of weakening, which is expected in the 1st half of 2023.
What does all this mean for interest rates and the stock market in the short-term?
- the Fed is far from done
- bonds are likely experiencing a short-term relief rally
- and so are stocks
- the 5th bear market rally of this bear market
- Bloomberg thinks it could be a 5% to 10% rally before it fades
Or to put it another way:
Now this is not the end. It is not even the beginning of the end. But it is, perhaps, the end of the beginning.” – Winston Churchill
As Morgan Stanley’s Chief Investment Officer Mike Wilson explains, this bear market likely has two phases.
- inflation spike/Fed rate hike scare phase
- recession/growth scare phase
2022 so far has been all phase one, with valuations coming down but earnings expectations remaining strong.
In 2023 we’re likely to see the cumulative effect of the 4.25% worth of rate hikes the Fed is planning, plus a bit more in February or March.
As Mike Wilson said recently on Bloomberg, in regards to falling bond yields:
That light at the end of the tunnel you see is actually an oncoming freight train”.
I don’t mean to scare you or anyone out of owning stocks. My goal is to inform you of what’s most likely to happen next with interest rates and the economy, so you can avoid being shocked by what’s coming next.
Nobody can predict interest rates, the future direction of the economy or the stock market. Dismiss all such forecasts and concentrate on what’s actually happening to the companies in which you’ve invested.”— Peter Lynch
I love studying what’s happening with the economy, but not for market timing purposes. If you understand what’s LIKELY to happen, you are better prepared to ride out inevitable market storms and even profit from bear market blue-chip bargains.
Why not just sell everything now if stocks could fall lower over the next six to 12 months?
Charlie Bilello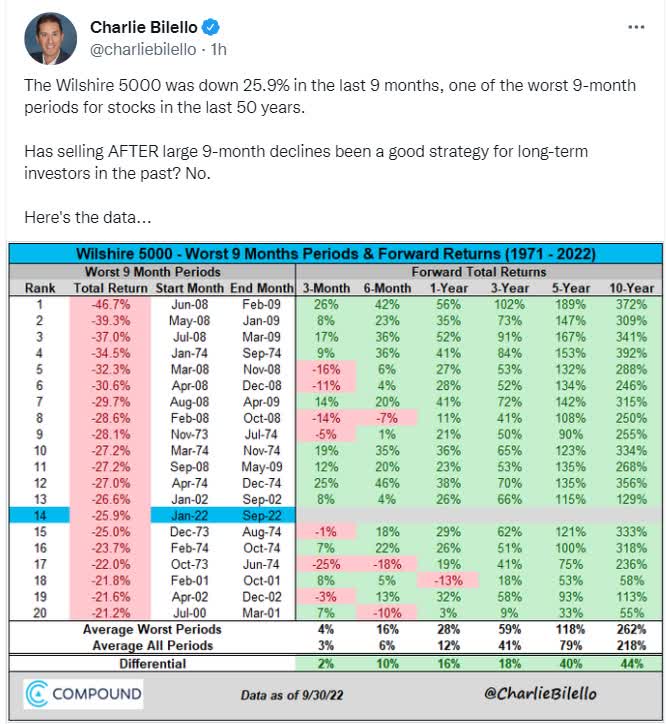
Because we’ve just been through the 14th worst bear market in history, selling now has always been a mistake for anyone with a 3+ year time horizon, including the stagflation hell of the 1970s.
Unless you think we’re in the literal apocalypse, then this time is likely to prove no different.
So what should you do for the next six to 12 months, which is how long Morgan Stanley thinks it will take for the market to really bottom?
- focus on safety and quality first, and prudent valuation and sound risk management always
That’s why today I’d like to provide an update that Dividend Kings members have requested about Cisco (NASDAQ:CSCO), one of our favorite tech utility Ultra SWANs (sleep well at night).
Let me show you why Cisco is a potentially strong buy today, even with that potential “recession freight train” barreling towards us.
But just as importantly, I want to show you why T. Rowe Price (TROW) and British American Tobacco (BTI) are two higher-yielding and faster-growing dividend aristocrat alternatives to CSCO.
Ones that might help you generate more very safe income and superior long-term returns, while helping you sleep well at night during the final phase of this bear market.
And once the next bull market begins, could help you earn outsized profits on the road to retiring in safety and splendor in the coming decades.
Why Cisco Is A Potentially Strong Buy Today
Further Reading
- Cisco: One Of The World’s Greatest Dividend Stocks Is On Sale
- a full deep dive on Cisco’s investment thesis, growth outlook, risk profile, valuation, and total return potential
Investment Thesis On Cisco
We view Cisco Systems as the dominant force in enterprise networking and expect it to retain its strength in both legacy and future networks. Cisco holds leading market shares across switching, routing, and wireless access, with strong complementary positions in security and collaboration. We believe Cisco’s portfolio is positioned appropriately to benefit from trends toward hybrid work and cloud environments. It offers the most comprehensive suite of capabilities across converging networking and security markets, and we deem its intertwined products as sticky and worthy of a wide economic moat.” – Morningstar
Cisco is a tech utility with a relatively recession-resistant business model.
- during the pandemic, earnings grew by 2%
- during the Great Recession, earnings grew by 9%
What makes Cisco so special? Simply put, its customers are some of the world’s largest and richest companies. Cisco is also transitioning to a subscription-based business model.
earnings presentation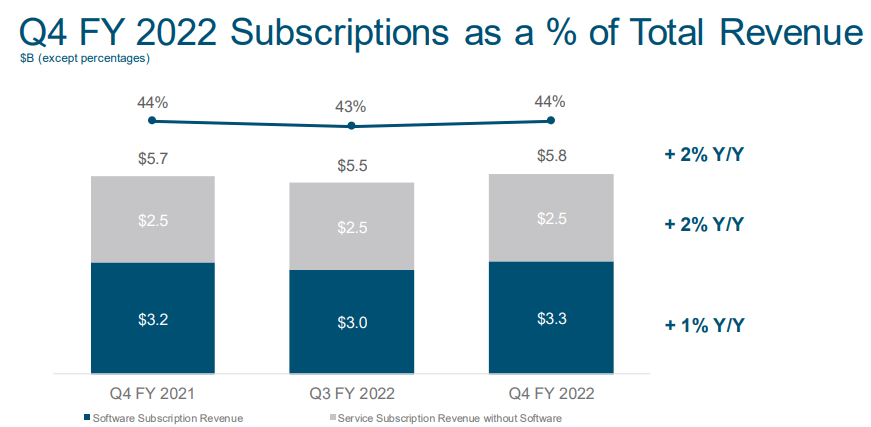
44% of sales are now recurring revenue, based on contracts ranging from three to seven years.
Cisco has plenty of rivals of course, including white box offerings but its wide moat and rich margins are a testament to its “one-stop-shop” suite of enterprise offerings.
Gurufocus Premium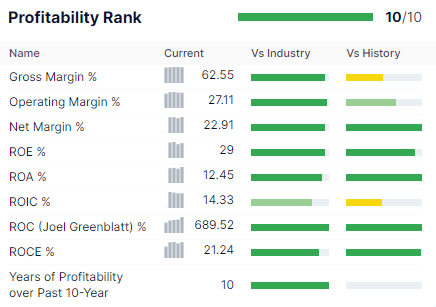
CSCO’s profitability is historically in the top 5% of peers. That’s not just a wide moat; that’s a very wide moat. One that’s relatively stable over time.
YCharts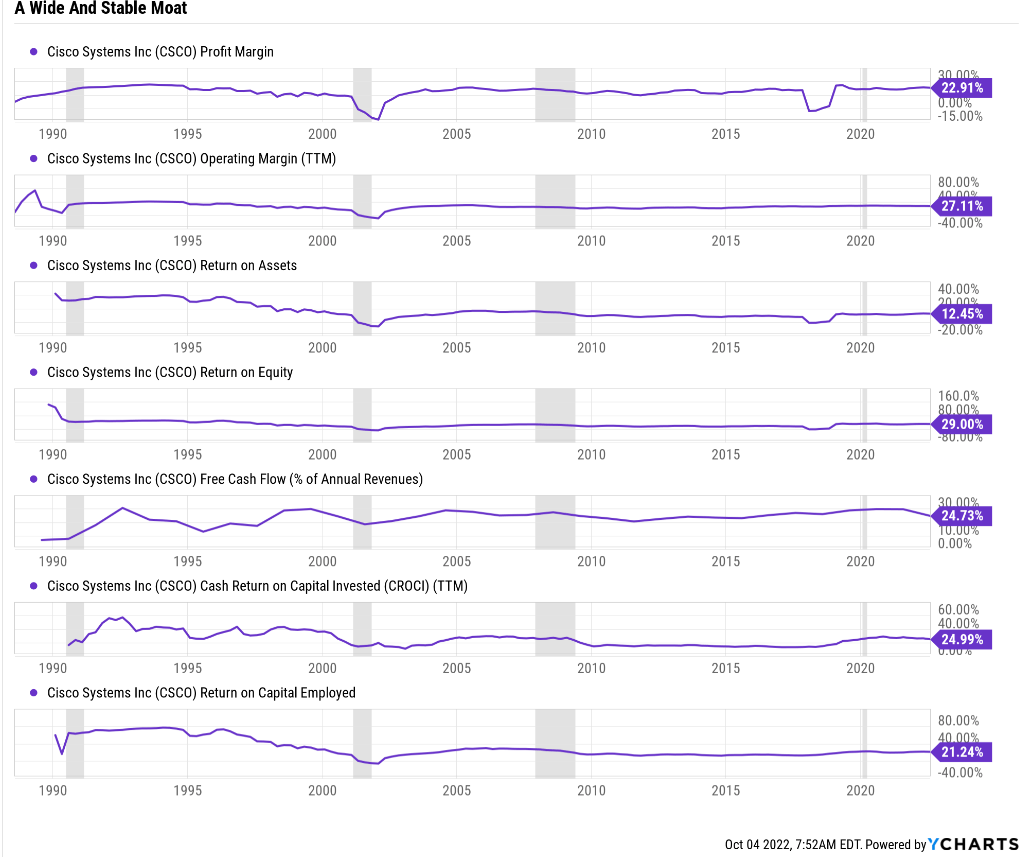
Cisco’s free cash flow margins are 25%, higher than Apple’s (AAPL). Its net margins are 23%, and its cash return on invested capital is a Buffett-like 25%.
Gurufocus Premium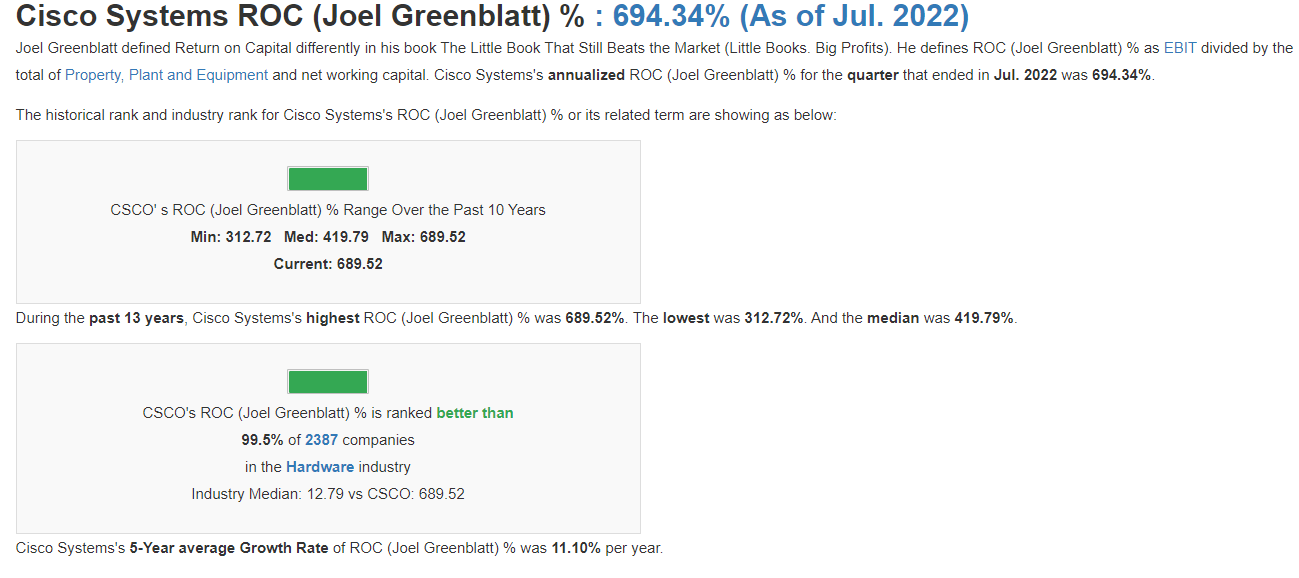
Cisco is generating almost 700% returns on capital, or ROC.
- annual pre-tax profit/the cost of running the business
- Joel Greenblatt’s gold standard of quality and moatiness
For context, the S&P 500’s ROC is 14.6%, the dividend aristocrats 105%, and the median for this industry is 12.8%.
CSCO’s ROC has been trending higher for almost 30 years, confirming its moat’s stable. Its 13-year median ROC of 420% is incredible; over the last five years, ROC has been rising by 11% annually.
Basically, Cisco is a gloriously profitable business that mints cash and has proven very dividend friendly with its 11-year dividend growth streak, including during the Pandemic.
(Source: FactSet Research Terminal)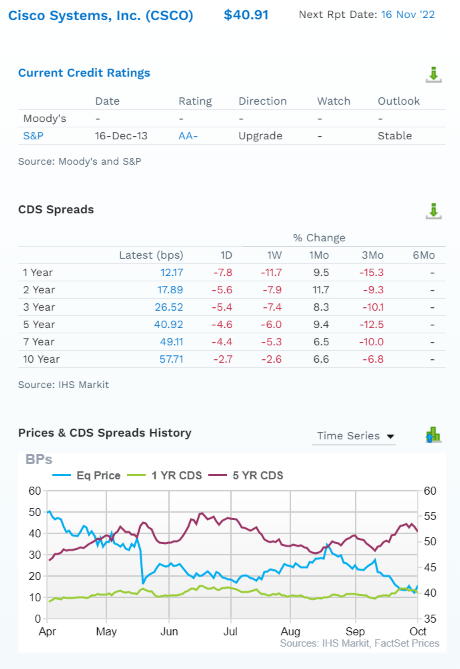
This is an AA-rated company with a 0.55% 30-year bankruptcy risk, according to S&P. The bond market believes CSCO’s fundamental risk has been falling modestly in the last few months.
(Source: FactSet Research Terminal)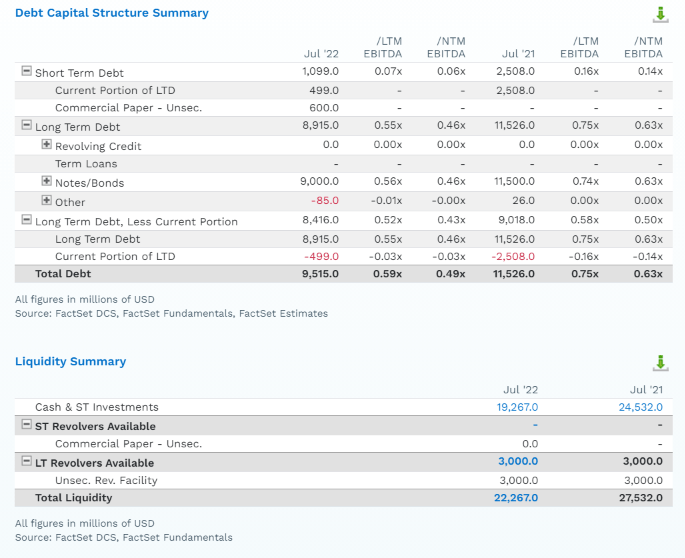
CSCO has $10 billion more cash than debt, and its debt/EBITDA is 0.6X on its way to 0.5X in the next year.
- 3.0X or less net debt/EBITDA is safe for this industry according to rating agencies
CSCO’s operating profits cover its interest costs almost 40X over, 5X more than the interest coverage ratio of 8 rating agencies consider safe.
Its average borrowing costs are 3.9%, or just 1.6% adjusted for long-term inflation, almost 16X less than its cash return on invested capital.
(Source: FactSet Research Terminal)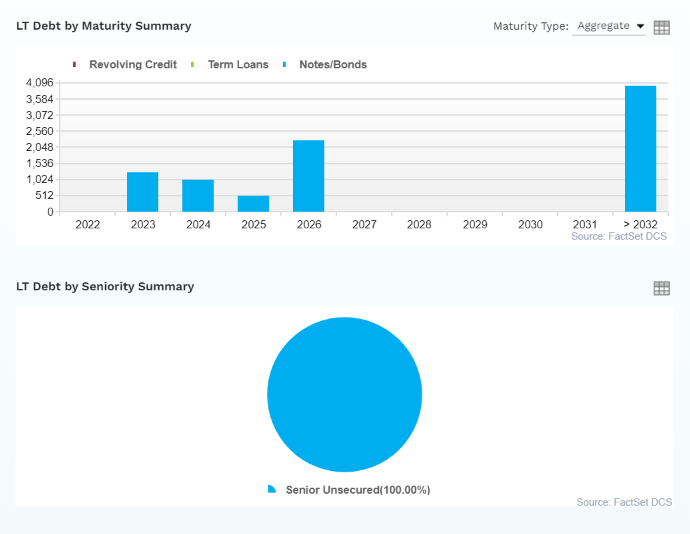
CSCO’s debt is well staggered and 100% unsecured for maximum financial flexibility.
This is a fortress balance sheet which means that Cisco’s dividend is very safe.
- perfect 100% safety score
- 0.5% average recession dividend cut risk
- 1% severe recession dividend cut risk
(Source: FactSet Research Terminal)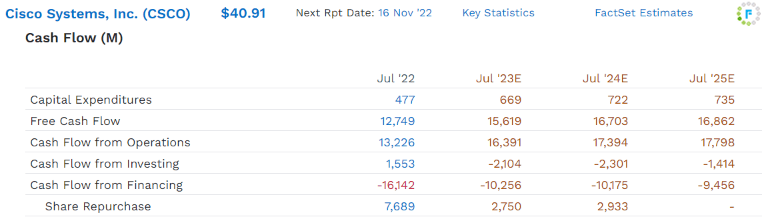
CSCO is generating slowly but steadily growing free cash flow each year to pay its $6.25 billion in dividends.
- 41% FCF payout ratio consensus for 2023
- Vs. 60% safe according to rating agencies
Cisco isn’t buying back that much stock right now, but it has the fortress balance sheet to buy back stock at a rate of about 2% per year.
Charts 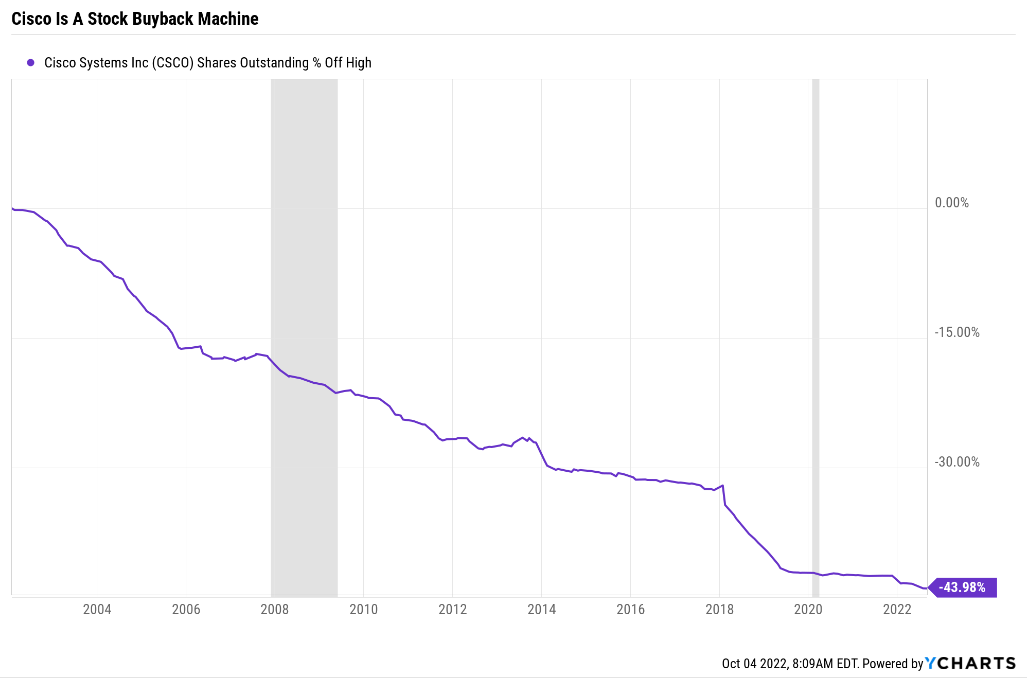
Since 2003 Cisco has repurchased 44% of its net shares, usually at reasonable to very attractive valuations.
(Source: FactSet Research Terminal)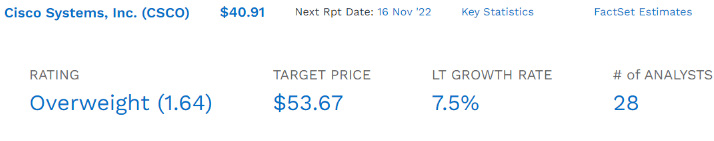
Analysts expect 7.5% CAGR long-term growth from Cisco, and this business is so stable that margins of error tend to be small.
FAST Graphs, FactSet 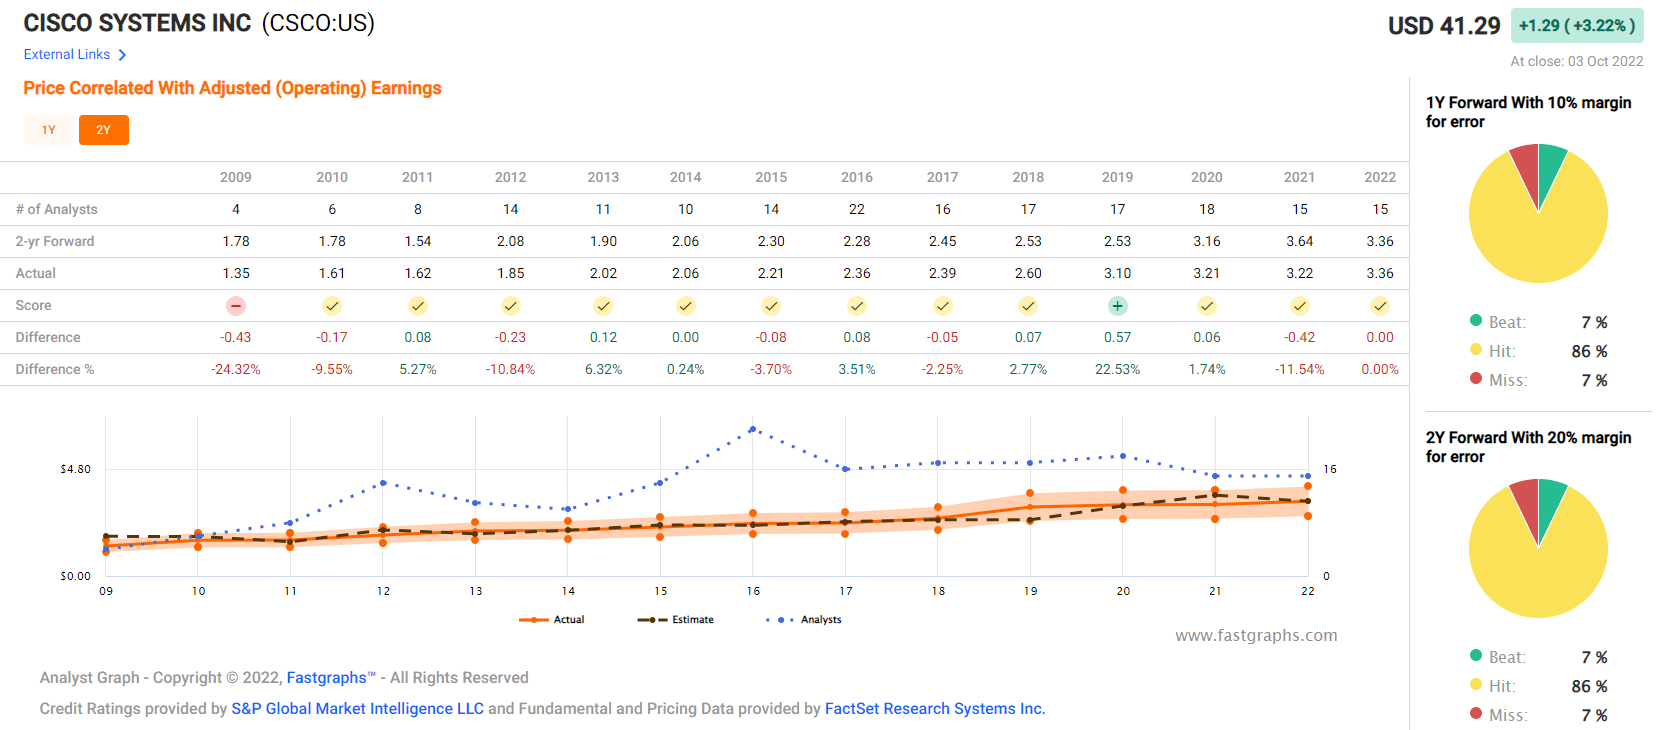
What do a very safe 3.7% yield and 7.5% CAGR growth mean for long-term investors?
| Investment Strategy | Yield | LT Consensus Growth | LT Consensus Total Return Potential | Long-Term Risk-Adjusted Expected Return | Long-Term Inflation And Risk-Adjusted Expected Returns | Years To Double Your Inflation & Risk-Adjusted Wealth |
10-Year Inflation And Risk-Adjusted Expected Return |
| REITs | 3.9% | 6.1% | 10.0% | 7.0% | 4.7% | 15.3 | 1.58 |
| Cisco | 3.7% | 7.5% | 11.2% | 7.8% | 5.6% | 13.0 | 1.72 |
| Schwab US Dividend Equity ETF | 3.6% | 8.80% | 12.4% | 8.7% | 6.4% | 11.3 | 1.86 |
| Dividend Aristocrats | 2.8% | 8.7% | 11.5% | 8.1% | 5.8% | 12.5 | 1.75 |
| S&P 500 | 1.9% | 8.5% | 10.4% | 7.3% | 5.0% | 14.4 | 1.63 |
(Sources: DK Research Terminal, FactSet, Morningstar, YCharts)
That analysis expects CSCO to deliver about 11.2% CAGR long-term returns, which is slightly better than the S&P 500 and on par with the dividend aristocrats.
Cisco Rolling Returns Since 2011 (When It Began Paying Dividends)
Portfolio Visualizer Premium 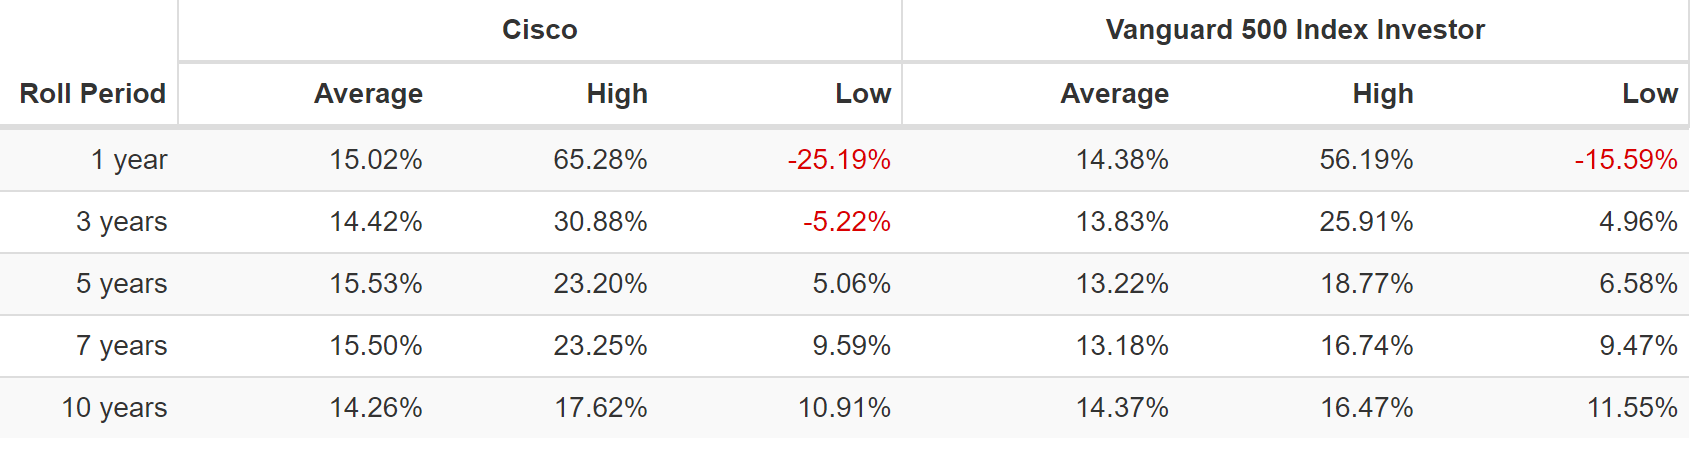
Cisco has proven itself a very dependable source of market matching returns but far superior income over time.
Portfolio Visualizer Premium 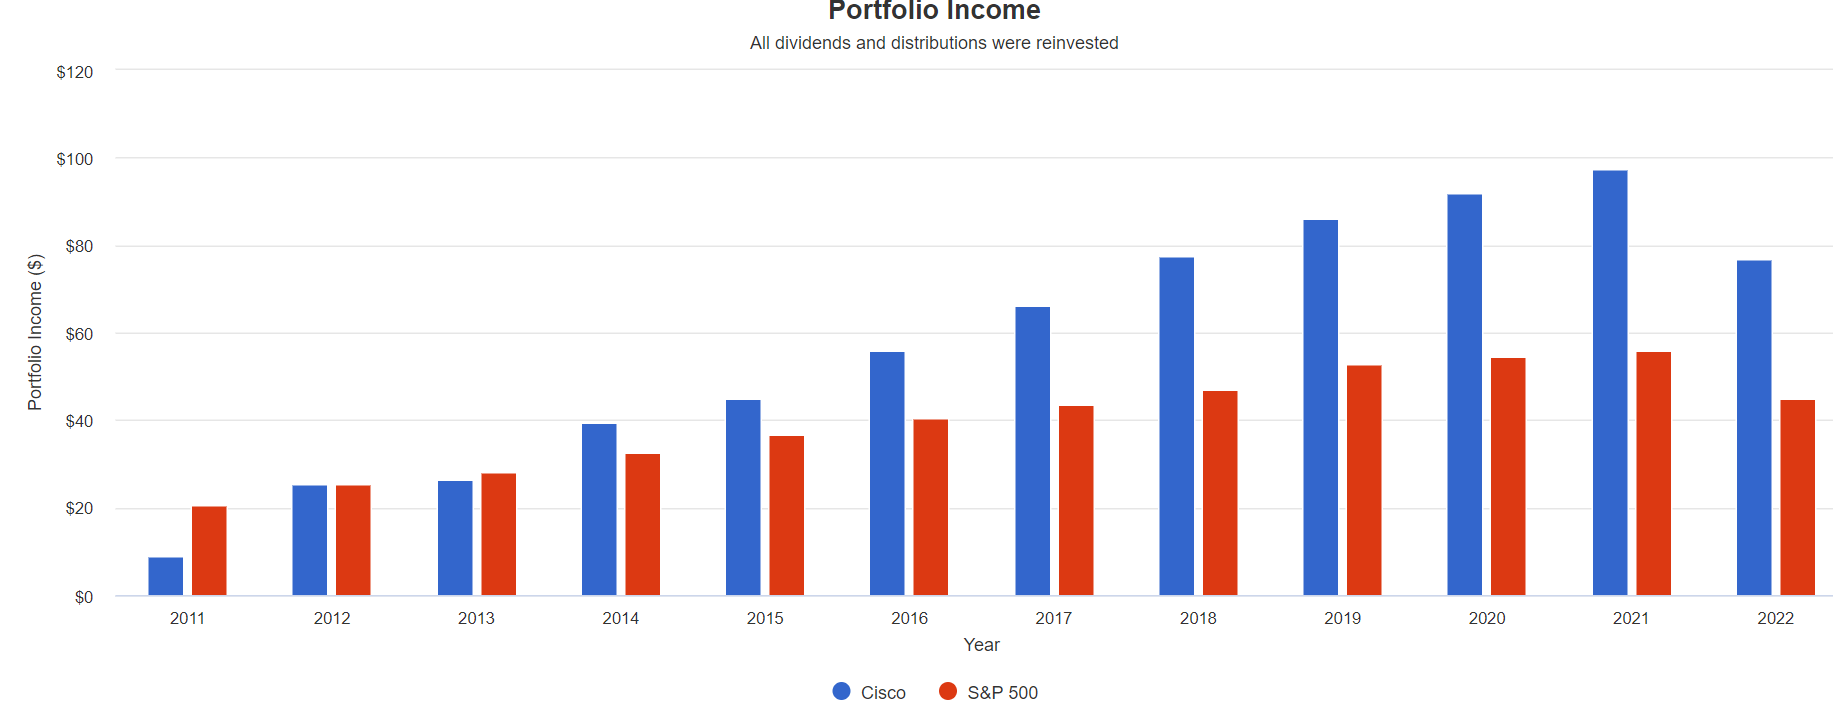
Cisco’s income growth over the last 11 years has been double that of the S&P 500, a very impressive 22%.
| Portfolio | 2011 Income Per $1000 Investment | 2022 Income Per $1000 Investment | Annual Income Growth | Starting Yield |
2022 Yield On Cost |
| S&P 500 | $21 | $60 | 10.01% | 2.1% | 6.0% |
| Cisco | $12 | $103 | 21.58% | 1.2% | 10.3% |
(Source: Portfolio Visualizer Premium)
In the future, 7% to 8% dividend growth is likely, now that the payout ratio has normalized at very safe 40% to 50% levels.
Cisco 2024 Consensus Total Return Potential
(Source: FAST Graphs, FactSet Research)
If CSCO grows as expected and returns to historical fair value by 2024, it could deliver 46% total returns, or 14% annually.
- about 33% more than the S&P 500
Cisco 2027 Consensus Total Return Potential
(Source: FAST Graphs, FactSet Research)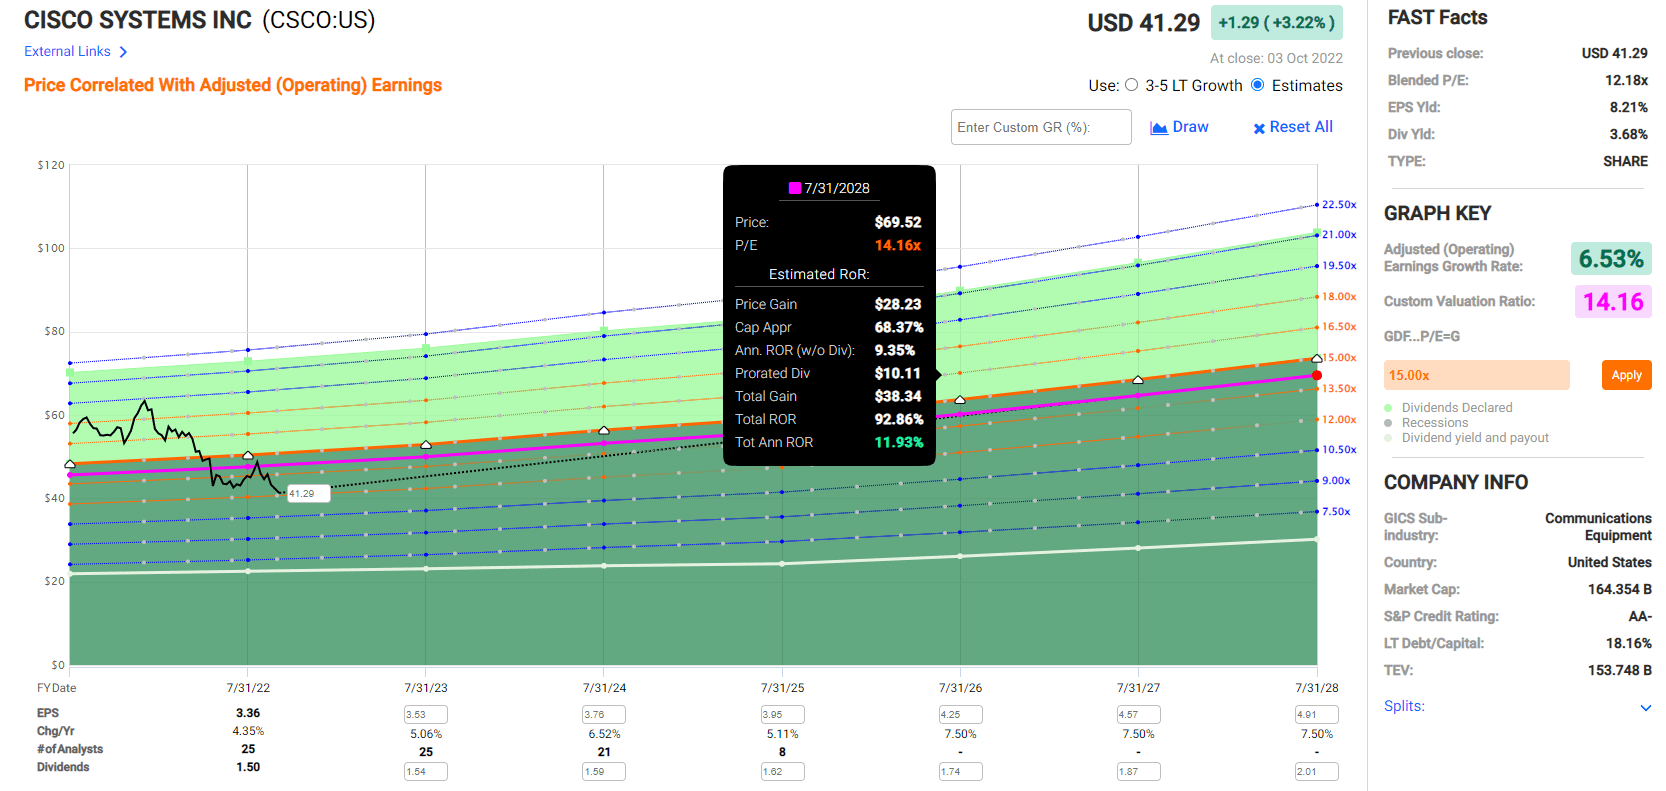
If CSCO grows as expected over the next five years (it almost always does) and returns to historical fair value, then it could nearly double, delivering 12% annual returns.
- about 50% higher total returns potential than the S&P 500
| Metric | Historical Fair Value Multiples (12 years) | 2021 | 2022 | 2023 | 2024 |
12-Month Forward Fair Value |
| 5-Year Average Yield | 2.97% | $49.83 | $51.18 | $51.18 | $52.53 | |
| Earnings | 14.10 | $46.25 | $48.36 | $51.18 | $55.84 | |
| Average | $47.97 | $49.73 | $51.18 | $54.13 | $50.59 | |
| Current Price | $41.29 | |||||
|
Discount To Fair Value |
13.93% | 16.97% | 19.33% | 23.72% | 18.38% | |
| Upside To Fair Value | 16.19% | 20.44% | 23.95% | 31.10% | 26.20% | |
| 2022 EPS | 2023 EPS | 2022 Weighted EPS | 2023 Weighted EPS | 12-Month Forward EPS | 12-Month Average Fair Value Forward PE |
Current Forward PE |
| $3.43 | $3.63 | $0.73 | $2.86 | $3.59 | 14.1 | 11.5 |
(Source: Dividend Kings Zen Research Terminal)
Cisco is about 18% historically undervalued and offers up to 26% fundamentally justified upside potential over the next year.
It’s trading at 11.5X forward earnings but just 8.2X cash-adjusted earnings.
- an anti-bubble private equity valuation pricing in -0.6% CAGR growth
Cisco Investment Decision Score
DK
(Source: Dividend Kings Automated Investment Decision Tool)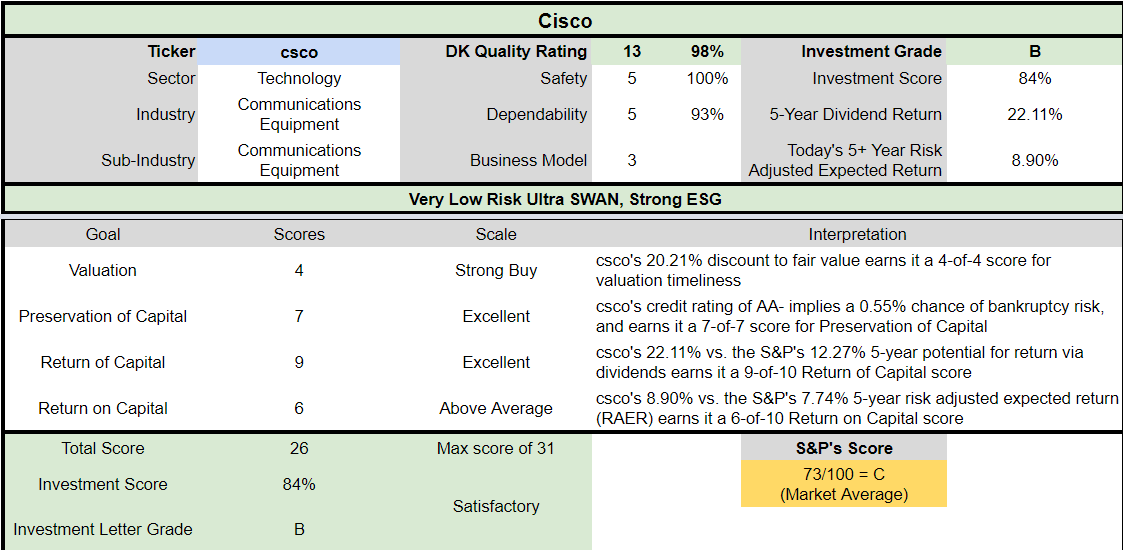
CSCO is a potentially reasonable high-yield Ultra SWAN choice for anyone comfortable with its risk profile.
- 3.7% safe yield vs. 1.9% S&P (2X higher and much safer yield)
- 10% higher annual long-term return potential
- similar risk-adjusted expected returns
- 2X the consensus 5-year income
But while Cisco is a potentially strong buy today, there are even better options available, with higher yields, and faster growth rates, like TROW and BTI.
British American Tobacco: Both The Best Valuation AND Growth Outlook In 20 Years
Further Reading
- 7% Yielding British American Tobacco Is The Perfect Bear Market Buy
- a full deep dive on BTI’s investment thesis, growth outlook, risk profile, valuation, and total return potential
Reasons To Potentially Buy British American Today
| Metric | British American Tobacco |
| Quality | 84% 13/13 Ultra SWAN (Sleep Well At Night) Global Aristocrat |
| Risk Rating | Low Risk |
| DK Master List Quality Ranking (Out Of 500 Companies) | 166 |
| Quality Percentile | 67% |
| Dividend Growth Streak (Years) | 22+ |
| Dividend Yield | 6.8% |
| Payout Safety Score | 82% |
| Average Recession Dividend Cut Risk | 0.5% |
| Severe Recession Dividend Cut Risk | 1.95% |
| S&P Credit Rating |
BBB+ Negative Outlook |
| 30-Year Bankruptcy Risk | 5.00% |
| Consensus LT Risk-Management Industry Percentile | 72% Good |
| Fair Value | $60.28 |
| Current Price | $36.59 |
| Discount To Fair Value | 39% |
| DK Rating |
Potentially Ultra Value, Buffett-style table-pounding strong buy |
| PE | 7.8 |
| Cash-Adjusted PE | 8.2 |
| Growth Priced In | -0.6% |
| Historical PE | 13 to 14 |
| LT Growth Consensus/Management Guidance | 10.4% |
| PEG Ratio | 0.78 |
| 5-year consensus total return potential |
23% to 28% CAGR |
| Base Case 5-year consensus return potential |
24% CAGR (5X better than the S&P 500) |
| Consensus 12-month total return forecast | 43% |
| Fundamentally Justified 12-Month Return Potential | 72% |
| LT Consensus Total Return Potential | 17.2% |
| Inflation-Adjusted Consensus LT Return Potential | 14.9% |
| Consensus 10-Year Inflation-Adjusted Total Return Potential (Ignoring Valuation) | 4.01 |
| LT Risk-Adjusted Expected Return | 11.44% |
| LT Risk-And Inflation-Adjusted Return Potential | 9.15% |
| Conservative Years To Double | 7.87 Vs. 15.2 S&P 500 |
(Source: Dividend Kings Zen Research Terminal)
British American Tobacco is well on its way to its goal of selling zero tobacco.
- just reduced risk nicotine
- and Cannabis
(Source: earnings presentation)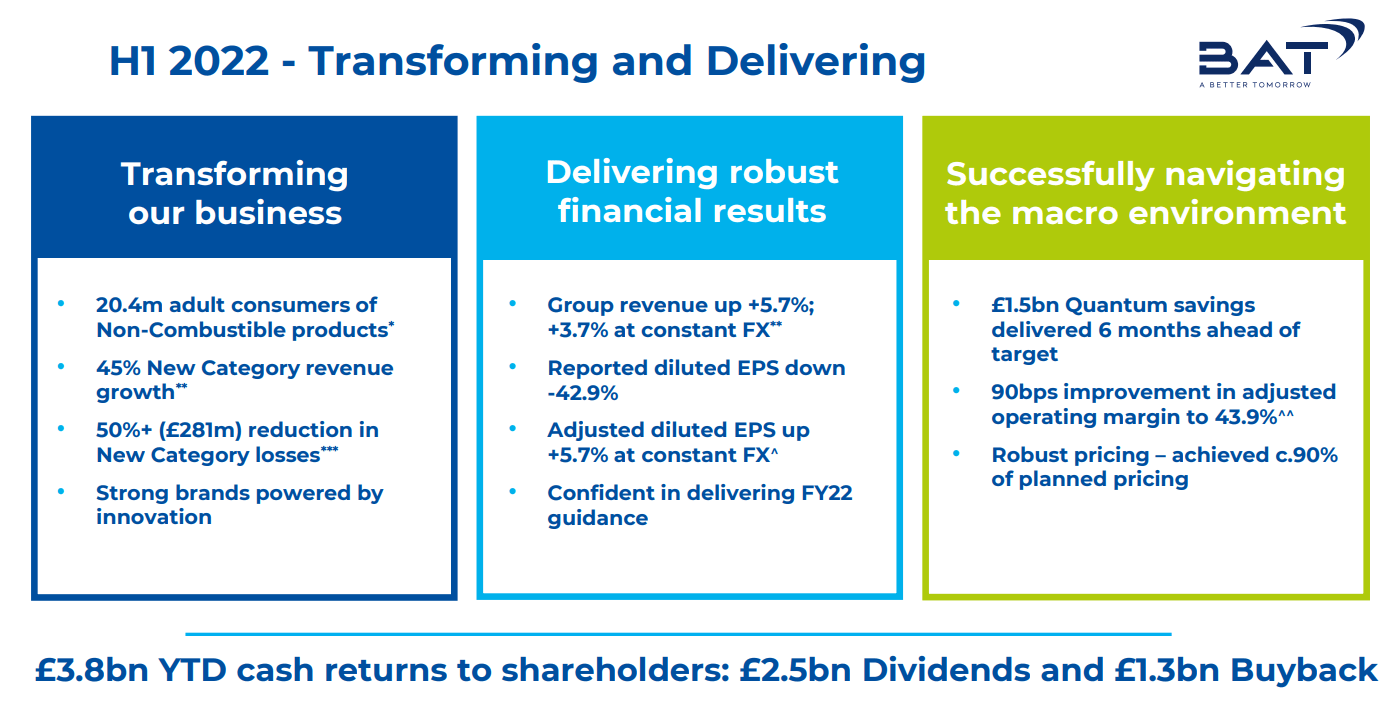
BTI is crushing it with reduced-risk products, posting 45% growth in the first half of 2022, over 50% when adjusting for Ukraine and Russia.
It has over 20 million RRP users, slightly more than PM has iQOS users.
(Source: earnings presentation)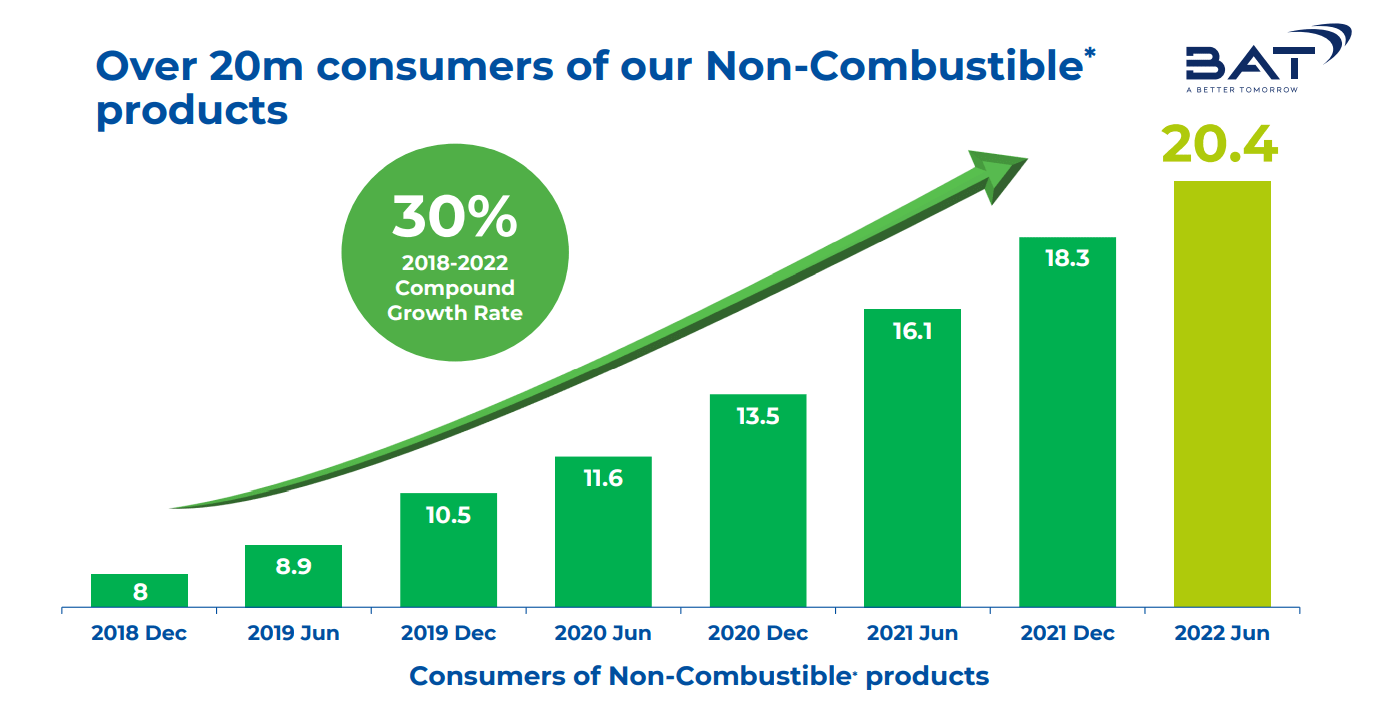
De-leveraging will continue at a more gradual pace as BTI is now buying back modest but accelerating amounts of stock at some of the best valuations in 20 years.
FactSet Research Terminal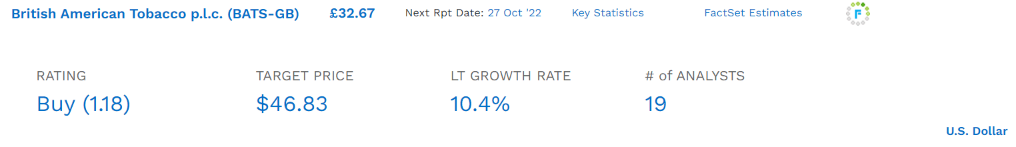
Do you know what else is at 20-year highs? BTI’s growth outlook which has been rising for the past year and just hit 10.4% CAGR.
And do you know what else is going up? The British Pound, which bottomed at 1.035 dollars/pound and has since recovered to 1.13.
- the annual dividend is 2.17 pounds
- the more the pound recovers, the higher BTI’s USD dividend climbs
- the pound should recover to 1.25 and remain stable once the current crisis is over
- a 7.4% yield
- once the recession in the UK ends, BTI’s normalized yield should return to about 8.2%, according to the FactSet consensus
- 8.9% 2024 yield on today’s cost
That’s a dividend that has been raised in local currency every year since at least 2000, a 22+ year dividend growth streak that makes BTI a global aristocrat.
BTI’s dividend policy is to maintain a 65% EPS payout ratio (vs. 85% safe for this industry, according to rating agencies). That’s the lowest payout ratio among tobacco blue-chips and means that the dividend could grow at double-digits long-term.
Basically, BTI represents one of the best Buffett-style ultra-value table-pounding fat pitches on Wall Street.
British American 2024 Consensus Total Return Potential
(FAST Graphs, FactSet Research)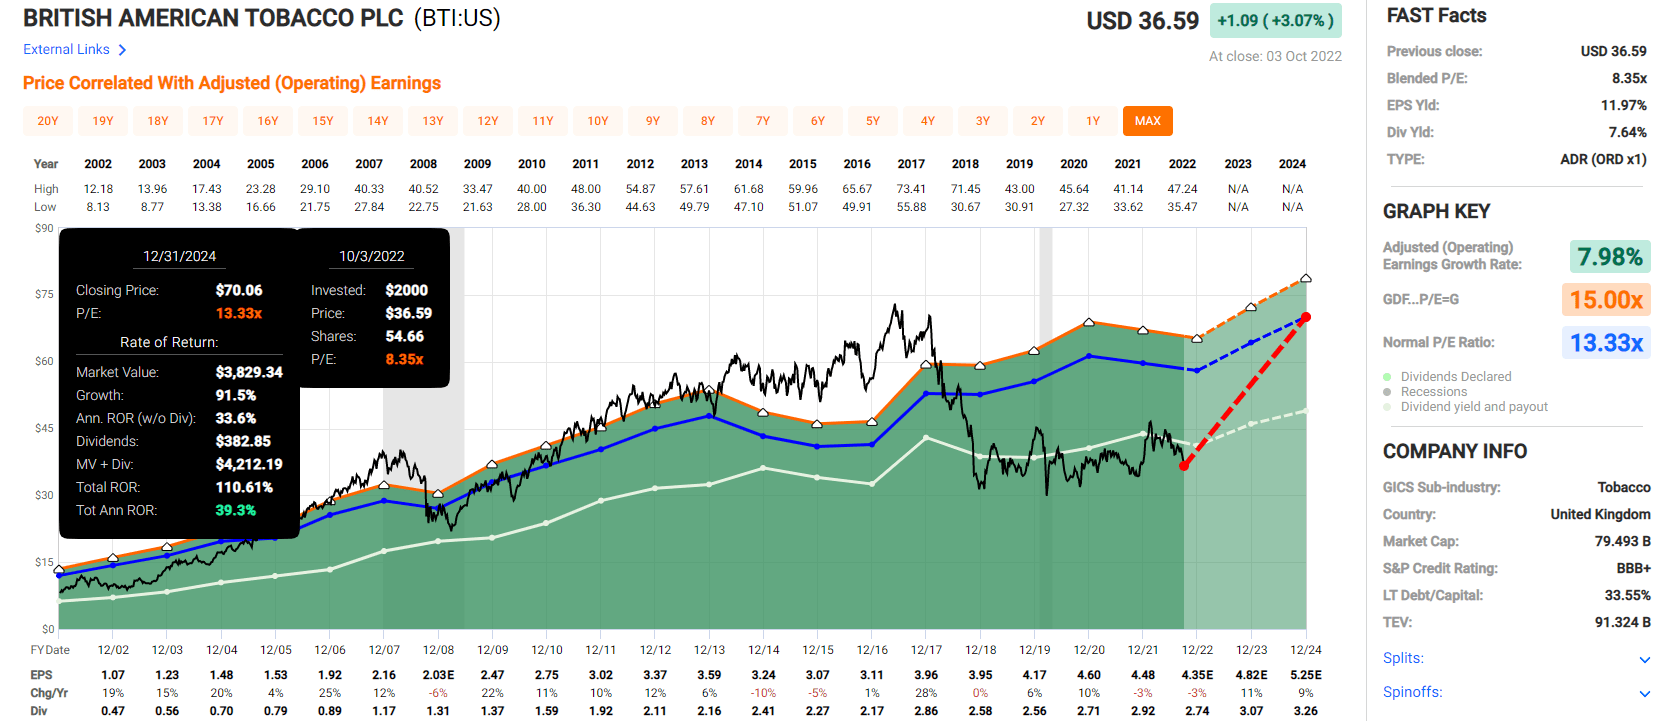
BTI’s bear market is the result of a crazy bubble popping. In 2017 BTI became 50% overvalued due to the TINA (there is no alternative) low rate bubble in high-yield dividend stocks.
It quickly crashed and became 50% undervalued, and the PE has languished at 8 to 9 for four years. The Pandemic lockdowns caused slightly negative growth (as did the strong dollar). But now that BTI’s growth engines are firing on all cylinders, with 21% EPS growth expected in 2023 and 2024, the return potential is immense.
110% in two years, or 39% annual returns, are what we’ll get if BTI grows as expected and returns to its market-determined fair value PE of 13.3.
British American 2027 Consensus Total Return Potential
(FAST Graphs, FactSet Research)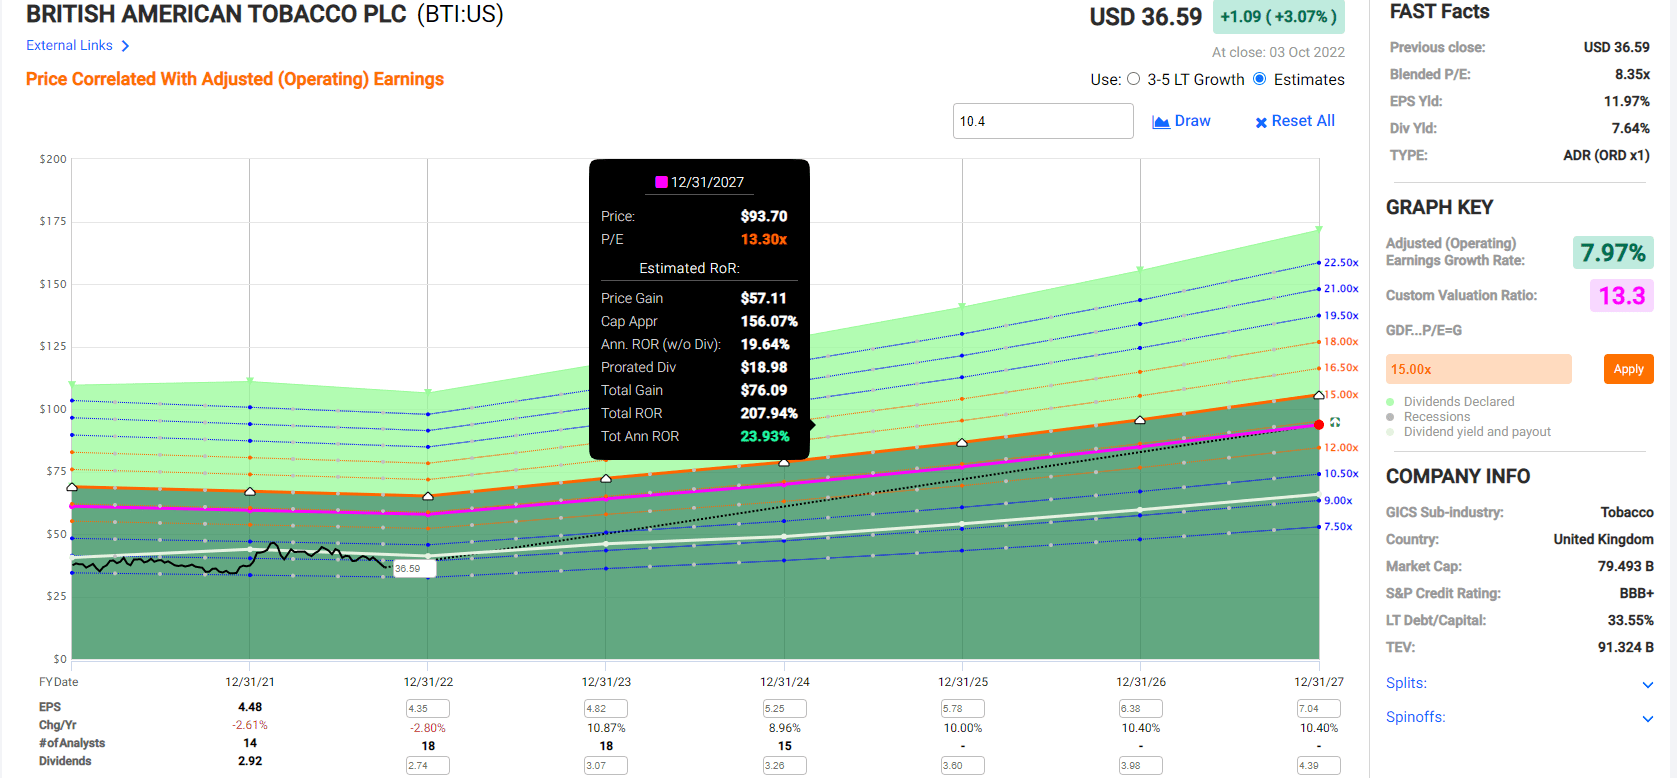
Over the next five years, BTI could more than triple, with 24% annual total returns.
Think Buffett-like returns from BTI are impossible?
BTI Rolling Returns Since 1985
Portfolio Visualizer Premium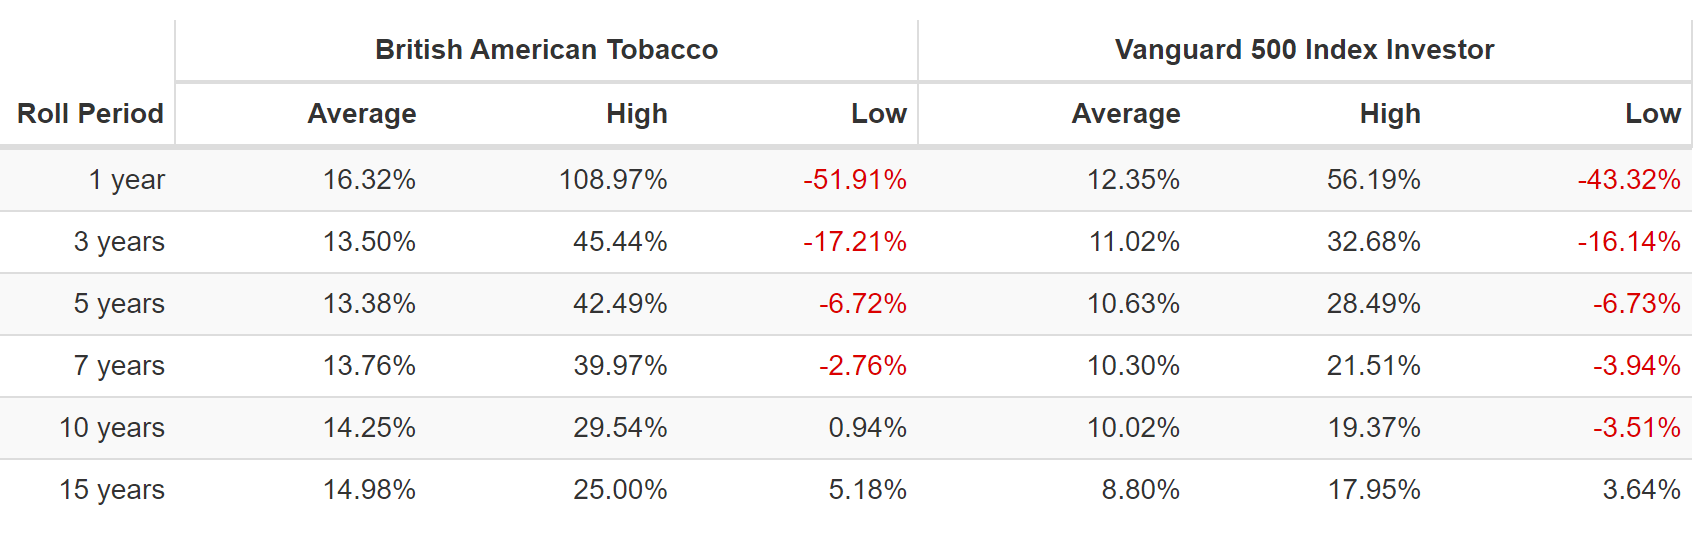
The last time BTI was 50% undervalued, in 2000, it went on to deliver 25% annual returns for the next 15 years. By the time it flew off into a bubble in 2017, it was up 30X from its 2000 lows.
| Investment Strategy | Yield | LT Consensus Growth | LT Consensus Total Return Potential | Long-Term Risk-Adjusted Expected Return | Long-Term Inflation And Risk-Adjusted Expected Returns | Years To Double Your Inflation & Risk-Adjusted Wealth |
10-Year Inflation And Risk-Adjusted Expected Return |
| British American Tobacco | 6.8% | 10.4% | 17.2% | 12.0% | 9.8% | 7.4 | 2.54 |
| T. Rowe Price | 4.3% | 12.6% | 16.9% | 11.8% | 9.5% | 7.5 | 2.49 |
| Cisco | 3.7% | 7.5% | 11.2% | 7.8% | 5.6% | 13.0 | 1.72 |
| S&P 500 | 1.9% | 8.5% | 10.4% | 7.3% | 5.0% | 14.4 | 1.63 |
(Sources: DK Research Terminal, FactSet, Morningstar, YCharts)
CSCO is likely to modestly beat the market over time. BTI is likely to crush the market, the aristocrats, and even the Nasdaq.
All while paying 2X the yield of CSCO, and that’s before the British pound even normalizes.
Management guidance is for 7% to 9% CAGR growth, which, when combined with the normalized yield of 8.9%, delivers BTI’s exceptional 14% to 15% returns for decades to come.
British American Investment Decision Score
DK Dividend Kings Automated Investment Decision Tool 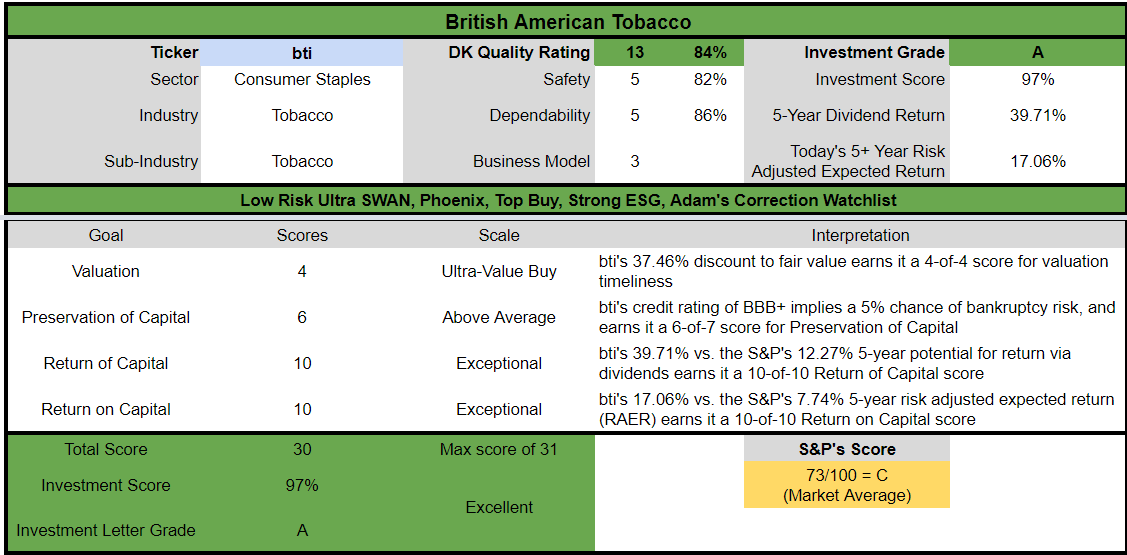
BTI is a potentially excellent ultra-yield Ultra SWAN aristocrat choice for anyone comfortable with its risk profile.
- 6.8% safe yield vs. 1.9% S&P (3.6X higher and much safer yield)
- 70% higher annual long-term return potential
- 2.5X higher risk-adjusted expected returns
- 3.5X the consensus 5-year income
Compared to either CSCO or the S&P 500, BTI is a clear winner and one of my favorite recommendations to anyone who doesn’t mind the risk profile of the tobacco industry.
- in the future, BTI will be no more “evil” than alcohol companies
T. Rowe Price: Bear Markets Are The Perfect Time To Buy The King of Active Fund Management
Further Reading
- Buy BlackRock And T. Rowe Price Today, And You’ll Thank Me Tomorrow
- a deeper look at TROW’s investment thesis, growth outlook, risk profile, valuation, and total return potential
Reasons To Potentially Buy T. Rowe Price Today
| Metric | T. Rowe Price |
| Quality | 93% 13/13 Ultra SWAN (Sleep Well At Night) Dividend Aristocrat |
| Risk Rating | Low Risk |
| DK Master List Quality Ranking (Out Of 500 Companies) | 49 |
| Quality Percentile | 90% |
| Dividend Growth Streak (Years) | 36 |
| Dividend Yield | 4.3% |
| Dividend Safety Score | 97% |
| Average Recession Dividend Cut Risk | 0.5% |
| Severe Recession Dividend Cut Risk | 1.15% |
| S&P Credit Rating |
Effective AAA Outlook (net cash balance sheet) |
| 30-Year Bankruptcy Risk | 0.07% |
| Consensus LT Risk-Management Industry Percentile | 75% Good |
| Fair Value | $125.62 |
| Current Price | $112.19 |
| Discount To Fair Value | 11% |
| DK Rating |
Potentially Good Buy |
| PE | 13.5 |
| Cash-Adjusted PE | 9.5 |
| Growth Priced In | 2.0% |
| Historical PE | 15 to 17 |
| LT Growth Consensus/Management Guidance | 12.6% |
| PEG Ratio | 0.75 |
| 5-year consensus total return potential |
12% to 29% CAGR |
| Base Case 5-year consensus return potential |
15% CAGR (2X the S&P 500) |
| Consensus 12-month total return forecast | -2% |
| Fundamentally Justified 12-Month Return Potential | 16% |
| LT Consensus Total Return Potential | 16.9% |
| Inflation-Adjusted Consensus LT Return Potential | 14.6% |
| Consensus 10-Year Inflation-Adjusted Total Return Potential (Ignoring Valuation) | 3.91 |
| LT Risk-Adjusted Expected Return | 11.82% |
| LT Risk-And Inflation-Adjusted Return Potential | 9.53% |
| Conservative Years To Double | 7.55 |
(Source: Dividend Kings Zen Research Terminal)
TROW, like many fund managers, is suffering due to this bear market. But bear markets are precisely the best time to buy asset managers because from bear market lows, life-changing returns follow.
TROW Rolling Returns Since 1989
(Source: Portfolio Visualizer Premium)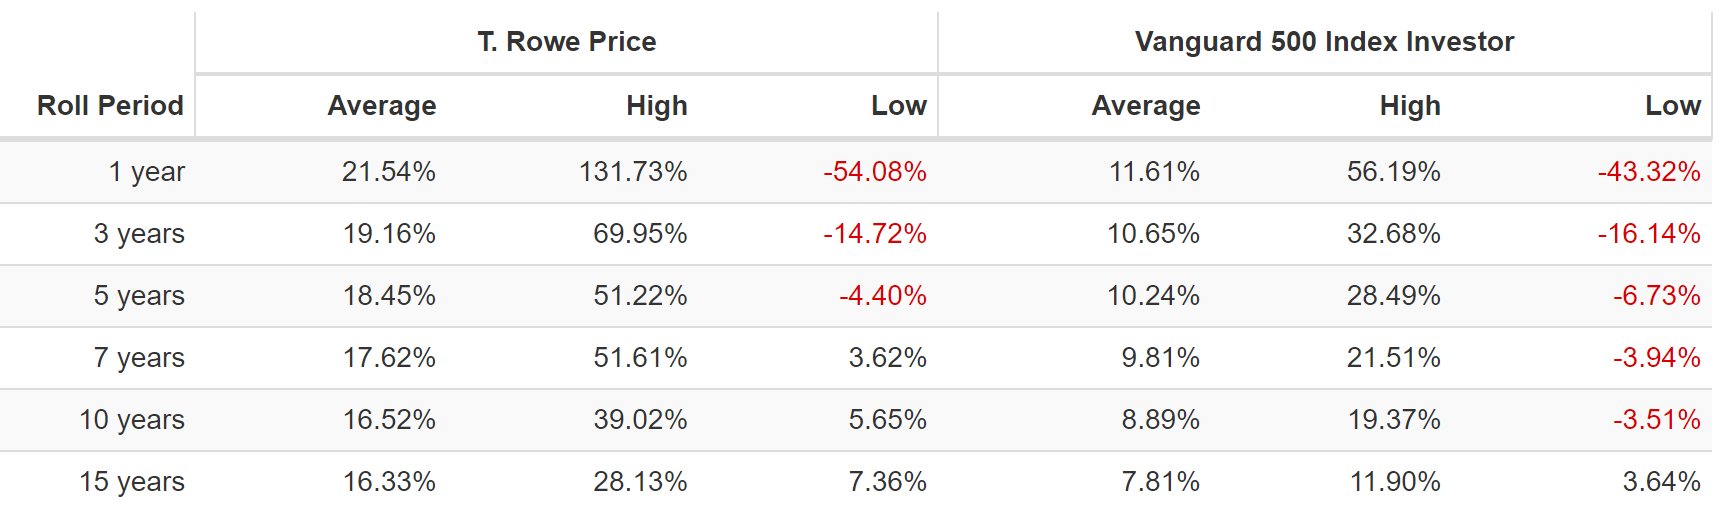
From bear market lows, TROW delivered as much as 39% annual returns for 10 years and 28% annual returns for 15 years.
- 27X return in 10 years
- 41X return in 15 years
TROW at 9.5X cash-adjusted earnings is priced for just 2% annual long-term growth.
Analysts expect it to actually grow at 12.6% CAGR over time.
What about the rise of passive investments?
In an environment where active fund managers are under assault for poor relative performance and high fees, we believe wide-moat-rated T. Rowe Price is one of the best positioned of the U.S.-based active asset managers we cover. The biggest differentiators for the firm are the size and scale of its operations, the strength of its brands, its consistent record of active fund outperformance, and reasonable fees. T. Rowe Price has historically had a stickier set of clients than its peers as well, with two-thirds of its assets under management derived from retirement-based accounts.” – Morningstar
Why is TROW Morningstar’s favorite active manager? Because since 1937, they have been consistently outperforming their peers.
At the end of June 2022, 65%, 66%, and 77% of the company’s fund AUM were beating the Morningstar category median on a three-, five-, and 10-year basis, respectively, with just under 50% of fund assets closing out the first half of the year with an overall rating of 4 or 5 stars, better than just about every other U.S.-based asset manager we cover.” – Morningstar
77% of its 110 funds beat their peers and benchmark over time, and no fund manager has more 4 or 5-star rated funds than TROW.
TROW’s target-date funds are also outperforming their peers and make up 25% of its assets under management.
It is true that TROW’s short-term returns will be hurt by the fact that positive fund flows aren’t expected until 2024. As a result, compared to 2021’s bull market-led growth, TROW is expected to experience slightly negative growth for the next few years.
TROW 2024 Consensus Total Return Potential
(FAST Graphs, FactSet Research)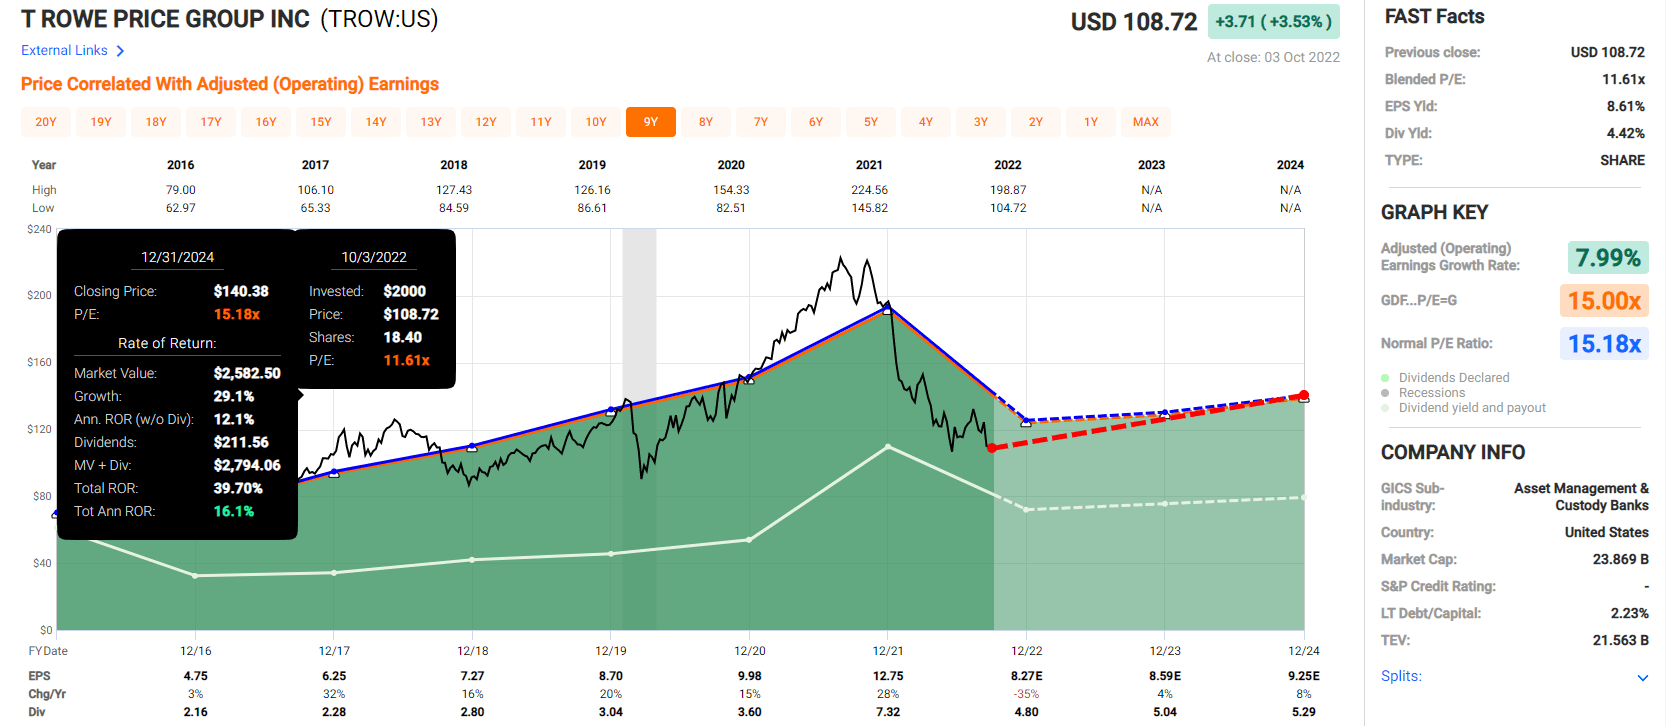
More specifically, earnings are expected to take a big hit in 2022, and start gradually recovering in the following years.
But TROW still offers the potential for market-beating 16% annual returns and from one of the world’s safest high-yield dividend growth blue-chips.
TROW 2027 Consensus Total Return Potential
(FAST Graphs, FactSet Research)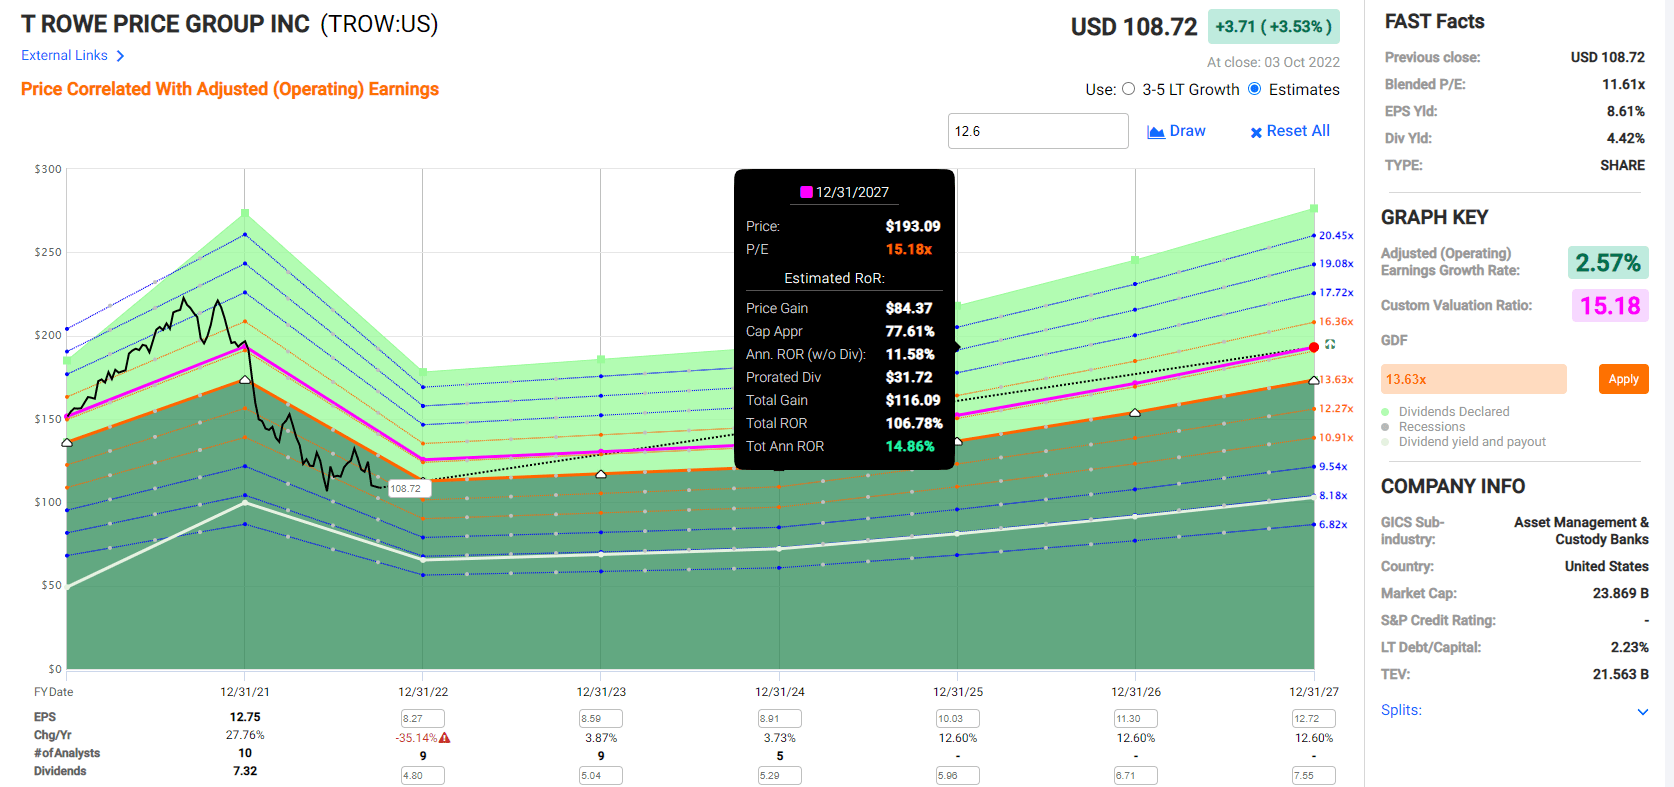
Over the next five years, TROW could double, delivering solid 15% annual returns.
- about 2X more than the S&P 500
- slightly more than CSCO
TROW Investment Decision Score
DK Dividend Kings Automated Investment Decision Tool 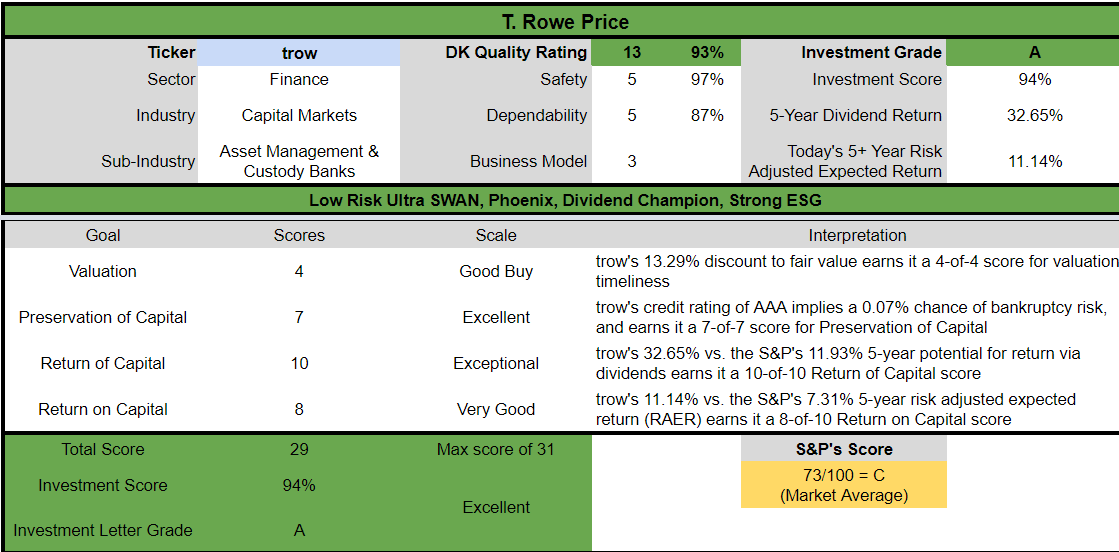
TROW is a potentially excellent high-yield Ultra SWAN aristocrat choice for anyone comfortable with its risk profile.
- 4.3% safe yield vs. 1.9% S&P (2X higher and much safer yield)
- 70% higher annual long-term return potential
- 2X higher risk-adjusted expected returns
- 3X the consensus 5-year income
Bottom Line: Cisco Is A Strong Buy, But Consider These 2 Faster Growing High-Yield Dividend Aristocrats
Dividend Kings Automated Investment Decision Tool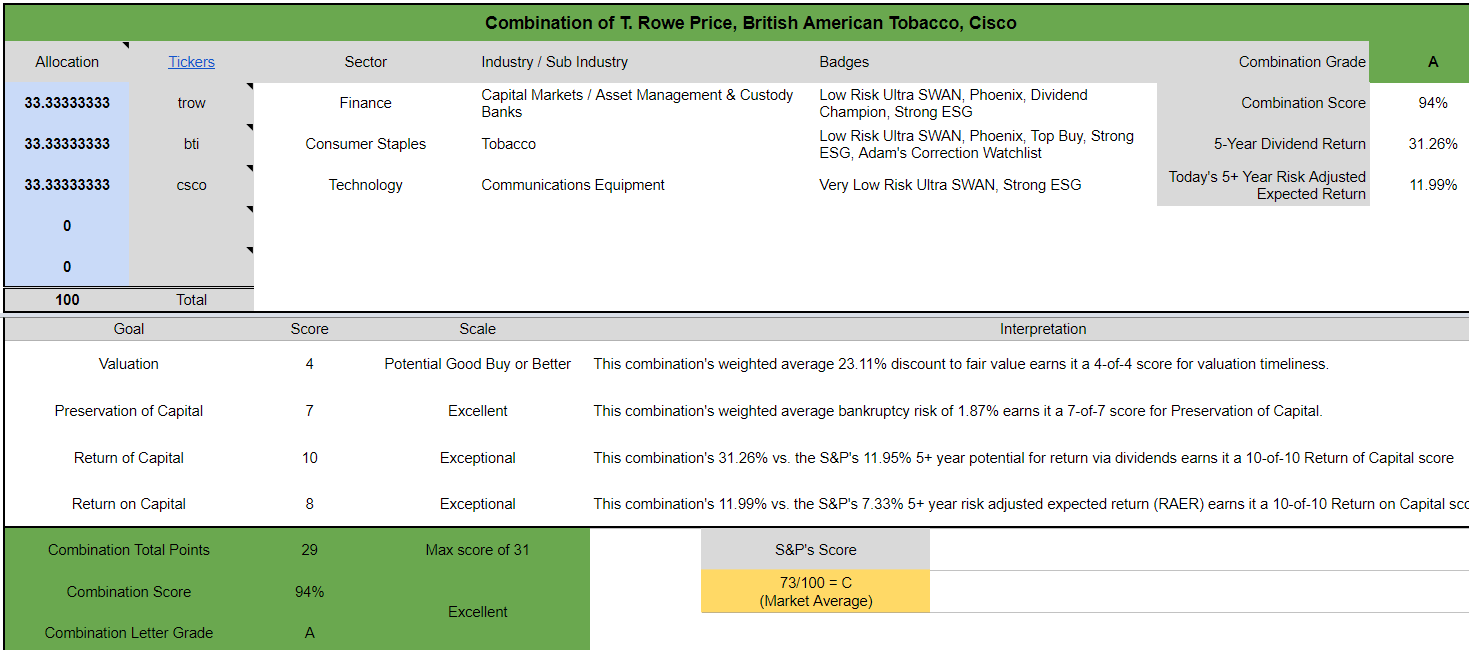
Cisco is a wonderful company, at a solid 18% discount to fair value. It’s a potentially strong buy for anyone comfortable with its risk profile.
But combining it with BTI and TROW creates an even better investment, with:
- 4.7% ultra safe yield
- 10.2% CAGR long-term growth consensus
- 14.9% CAGR long-term return potential (historical 16% CAGR)
- A- stable average credit rating
- 23-year average dividend growth streak
Cisco + British American + T. Rowe Price Since 1990
Portfolio Visualizer Premium 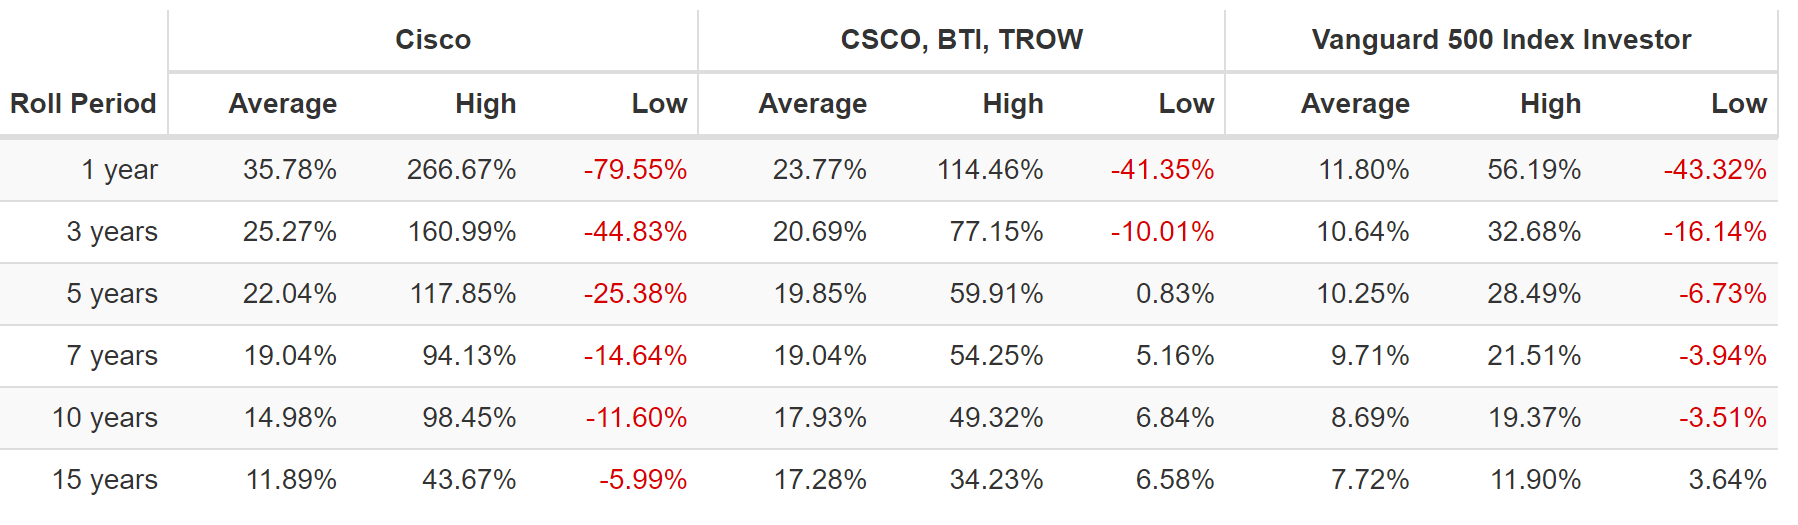
Better returns, safer dividends, and much more consistent returns.
That’s the power of combining world-beater blue-chips in this bear market.
Each of these is a wonderful high-yield Ultra SWAN, and you can’t go wrong with any of them.
Personally, I would buy BTI 1st, then TROW 2nd, and CSCO 3rd, but that’s my personal risk profile.
The point is to think outside the box whenever considering a blue-chip investment.
- Is what I’m considering buying a reasonable and prudent investment?
- Are there better alternatives?
- What blue-chip combinations can I create that will enhance yield today while potentially boosting long-term returns tomorrow?
When you have the right watchlist to work with, you never have to worry about settling for “good enough” because it’s always and forever a market of stocks, not a stock market.
In this bear market, blue-chip bargains are everywhere. Deep value and sky-high margin of safety is easy to find. You can’t swing a dead cat without hitting a potentially life-changing long-term opportunity.
That’s what I love about my job, bringing you the world’s best dividend blue-chip ideas, and teaching you how to find more, so you can make your own luck on Wall Street.
When you’re focused on safety and quality first, and prudent valuation, and sound risk-management always, retiring rich, and staying rich in retirement is not a matter of luck. It’s a matter of time and patience.
Be the first to comment