

Galyna Myroniuk/iStock via Getty Images
|
Q2 2022 |
YTD |
1 Year |
3 Year |
Inception† |
|
|
Leaven Partners, LP* |
-1.6% |
-6.5% |
-5.7% |
25.3% |
20.6% |
|
S&P 500 (SPXTR) |
-16.1% |
-19.9% |
-10.5% |
35.3% |
47.7% |
|
MSCI EAFE (EFA) |
-13.2% |
-18.8% |
-18.0% |
4.0% |
2.3% |
|
Vanguard Total World (VT) |
-15.2% |
-19.8% |
-16.1% |
20.8% |
23.6% |
*Leaven Partners, LP are time-weighted gross cumulative returns (unaudited) provided by our prime broker, Interactive Brokers. Performance data, (net of all fees and expenses), for each partner are provided by Liccar Fund Services.
†Trading began on March 16, 2018.
|
Investment Terms and Service Providers |
|
|
Investment Structure: |
Michigan LP |
|
Management Fee: |
0% |
|
Performance Fee: |
25% over 6% hurdle |
|
High Water Mark: |
Yes |
|
Lockup: |
3-year |
|
Minimum Investment: |
$50,000 |
|
Auditor |
Summit LLC |
|
Prime Broker: |
Interactive Brokers |
|
Custodian: |
Interactive Brokers |
|
Fund Administrator: |
Liccar Fund Services |
|
Legal Counsel: |
Cott Law Group, PC |
Dear Partners,
In the second quarter of 2022, fund assets declined by approximately -2%, well outpacing the downturn in the major market indices. Even though it may feel nice to hang our hat on solid relative performance against the standard benchmarks, our interest is in absolute returns. So, in real terms, year-to-date, we are down -6.5%. Although short-term losses are never pleasant, the strategy of buying cheap stocks will not preclude us from having periods when we show losses.
However, I believe the strategy, if well executed, will limit the frequency and severity of those down periods. By limiting the frequency and severity of losses in our portfolio, we make our goal of absolute returns a much easier hill to climb. To get back to zero after a loss of -20%, you need to get a positive return of +25%. The further down you go, the harder it is to make up for losses. Down -50% needs a +100% return or doubling your money, just to get back to where you started. It continues to get worse from there.
Eventually, the hole becomes so deep that you do not have the fortitude to attempt to climb out of it. A critical part of assessing the fund is answering the question: how are we doing when the markets are down? Long-term success will come via favorable results in bad markets.
For the quarter, our core holdings, which make up 90% of fund assets, had a negative contribution to fund performance of -7.0%, and, on average, were down -7.7%. Since our international holdings are marked in U.S. Dollars, part of the unrealized losses is explained by the strengthening of the dollar. I wrote in our first quarter letter that our international holdings were marked down to the U.S. Dollar resulting in a loss in currency terms.
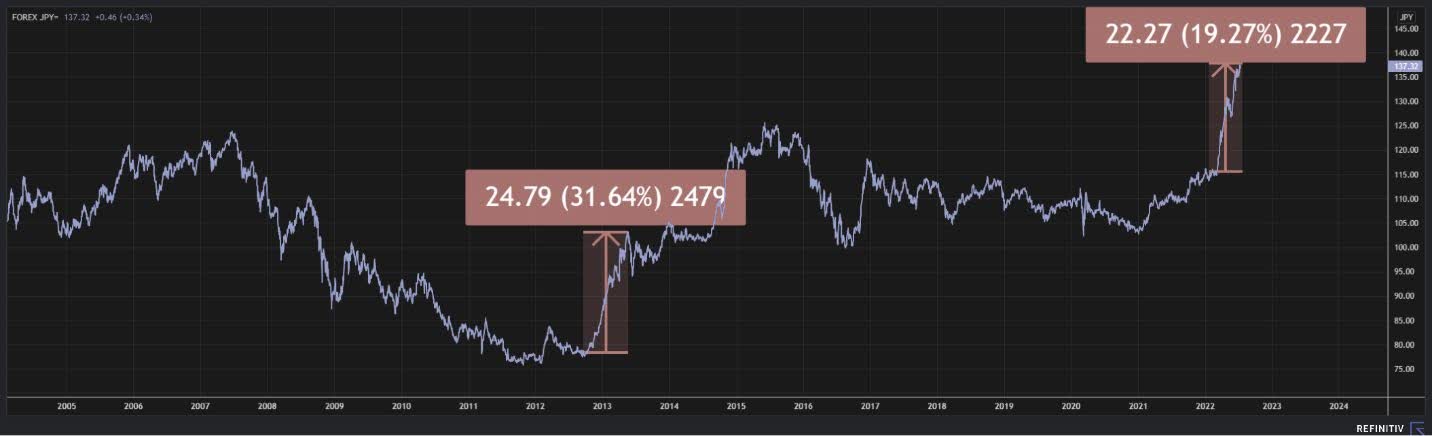
The Japanese Yen continued to weaken against the U.S. Dollar, (as it had last year), and was down sharply by approximately -20% in short order, (beginning the year at around ¥115 to the dollar and closing around ¥137, to end the quarter). This type of move of one G7 currency against another G7 currency is not unprecedented, but it does not happen all too often either. In the graph below (of the U.S. Dollar/Japanese Yen Spot Rate), you must go back to 2012-2013 to see a similar type of move.
In response to the negative impact of our currency exposure, early in the second quarter, I decided to hold our Japanese assets in U.S. Dollars. This marks the first time I decided to hedge currency risk in our portfolio and is a change from my earlier stance of leaving the portfolio unhedged to currencies. Since we hold Japanese assets in U.S. Dollars, we are short the Japanese Yen— having borrowed yen to buy the stock.
In the quarter, our short position in the Japanese Yen had a positive contribution to overall fund performance of +2.4%, offsetting some of our losses in our core holdings. Using a simplified trend following approach, the objective of managing our currency exposure is to attempt to limit losses when major trends in the exchange rate move against us. As I write, we remain short the Japanese Yen as it continues to be in an uptrend1—but I do not expect to be in a hedged position indefinitely. I will continue to closely monitor developments.
|
2nd Quarter Contribution |
|
|
Put Options |
+3.22% |
|
Core Holdings |
-7.01% |
|
Cash/Currency Hedge |
+2.42% |
|
Total Return |
-1.62% |
In addition to a positive contribution from our hedge position, our put options on the domestic market had an average gain of +72% in the quarter and a positive contribution of +3.2% to the fund. The put options have grown to about 6% of total fund assets and I continue to hold them. There is obviously a general concern in the markets, but no sign of panic yet. Parts of the market have been decimated so far in the worst start to a year in the past 50 years2, but overall equity valuations appear elevated above average3 and corporate profit expectations for the second half of this year do not appear to be as sensible as they should be4.
There could be more carnage to come; so, for now, I continue to hold our put options, but will most likely look to sell some of our contracts in the second half of this year5. Of course, I may decide to roll over the contracts and extend them. We will have to wait to see how things play out.6
Value and Price. Which has our ear?
In aggregate, our core holdings increased in value over the past 12 months, despite the lack of agreement from the market. To tackle this claim, let us approach it from a unique angle using our Japanese holdings, (which are 42% of our core holdings as of June 30th), as a proxy for our portfolio.
Over the past 12 months, we have owned, collectively but not simultaneously, a total of 42 Japanese companies. For the sake of illustration, let us merge the forty-two companies into one conglomerate. One year ago, the conglomerate was selling on the market for ¥462 trillion7. Today it sells for ¥452 trillion, or about -2% less than it did a year ago8.
On the operations side, the conglomerate increased its liquidation value by approximately 5% and the yield, or owner earnings, (expressed by the growth in retained earnings after adding back dividend payouts), was over 8% on the year. In other words, as an owner of the business, you got an 8% yield in the business as a going concern, or more conservatively stated, the saleable value of the company assets increased by 5%.
The market was not impressed by our operational results and said our company is worth -2% less. So, who is right?
Well, for starters, the value of assets increased by 5%, which is based on very conservative estimates, while the price went down by -2%. So, I am confident in writing, on a pure asset basis alone, that we are getting more value for less price compared to a year ago. Like discount shoppers, we are excited to find an identical shirt that is -6.7% less than it cost when we saw it shopping a year ago. Or should I say, we should be excited! It is a behavioral quirk that we like things on sale at the grocery store, but not in the stock market.
As for earnings, owner earnings increased by 8%, so at first glance, it would appear that we are getting a good deal here, as well. If earnings were to grow at 8% indefinitely, then our return would be 8%, clearly resulting in a discounted price compared to last year. However, the future is uncertain and, based on earnings, our fictitious conglomerate is worth the sum of its future earnings—which we can’t precisely know. Based on historical results, the conglomerate grew around 5% the previous year, while its 10-year average growth is around 4%.
No matter how you slice it, whether you use an aggressive 8% growth estimate or a conservative 4% growth estimate, if you believe the last 10 years will look similar to the next 10 years, you are getting more this year for your money than you did last year. Certainly, the argument would follow that the market must know something that we do not and that it is properly discounting a future for the conglomerate that is less prosperous than the previous 10 years.
For an individual company, I would agree that the probability of a disappointing future increases—but for all forty- two companies? Forty-two companies, I might add, that are in various sectors and industries. Of course, there is a chance, but I would put that at a low probability.
Sold Positions
I sold 29 companies in the first half of the year. The major reason for this activity was to whittle our portfolio holdings down to a more manageable number of positions—which is currently 54 stocks. (I prefer to hold 30 to 50 stocks.) I sold some of the stocks because they were too small of a position size to justify continuing to hold, and I was not able to build up the position at prices I was willing to pay.
A few of the companies sold, such as Yotai Refractories and Daisue Construction, appreciated above my calculation of intrinsic value and warranted a sale. The net result of the consolidation was an increase in the position sizing of our top 20 holdings.
|
Company Name |
Country |
|
|
5357.T |
Yotai Refractories Co Ltd |
Japan |
|
7841.T |
Endo Manufacturing Co Ltd |
Japan |
|
1814.T |
Daisue Construction Co Ltd |
Japan |
|
7937.T |
Tsutsumi Jewelry Co Ltd (OTCPK:TSSJF) |
Japan |
|
Tandy Leather Factory Inc (TLF) |
United States of America |
|
|
HG Metal Manufacturing Ltd |
Singapore |
|
|
7922.T |
Sanko Sangyo Co Ltd (OTC:SNSKF) |
Japan |
|
Technovator International Ltd (OTC:TINNF) |
Singapore |
|
|
1793.T |
Ohmoto Gumi Co Ltd (OTC:OHMGF) |
Japan |
|
9967.T |
Sakai Trading Co Ltd (OTC:SKAIF) |
Japan |
|
3131.T |
Shinden Hightex Corp |
Japan |
|
China Pipe Group Ltd |
Hong Kong |
|
|
7871.T |
Fukuvi Chemical Industry Co Ltd |
Japan |
|
8152.T |
Somar Corp |
Japan |
|
7565.T |
Mansei Corp (OTC:MSPVF) |
Japan |
|
7338.T |
INV Inc |
Japan |
|
9995.T |
Glosel Co Ltd |
Japan |
|
5408.T |
Nakayama Steel Works Ltd |
Japan |
|
Hengdeli Holdings Ltd (OTCPK:HENGY) |
Hong Kong |
|
|
2055.T |
Nichiwa Sangyo Co Ltd (OTC:NCWAF) |
Japan |
|
8249.T |
Techno Associe Co Ltd |
Japan |
|
7537.T |
Marubun Corp |
Japan |
|
7501.T |
Tiemco Ltd (OTC:TIEMF) |
Japan |
|
ES Group (Holdings) Ltd |
Singapore |
|
|
7175.T |
Imamura Securities Co Ltd |
Japan |
|
7723.T |
Aichi Tokei Denki Co Ltd |
Japan |
|
Koyo International Ltd |
Singapore |
|
|
Computime Group Ltd |
Hong Kong |
|
|
JLMC.PK |
JLM Couture Inc (OTCPK:JLMC) |
United States of America |
Maintaining Conviction
Although we were not rewarded with price appreciation, I take solace in knowing that the real value of our holdings increased and that, if we are patient enough to wait, the stock price will eventually agree with us. The goal of any value investor is to understand the difference between price and value—and to maintain a clear head by focusing on value relative to price.
I will continue to buy undervalued stocks; they are cheap because the market believes the company to have:
- very unfavorable prospects;
- a likelihood of bankruptcy; and/or
- a likelihood of poor stock price appreciation.
For these reasons, oftentimes, a stock becomes too cheap, and the result, on average, is that the stock appreciates due to the following:9
- The creation of an earning power commensurate with the company’s assets. This may result from:
- General improvement in the industry, and/or
- Favorable change in the company’s operating policies, with or without a change in management. These changes include more efficient methods, new products, abandonment of unprofitable lines, etc.
- A sale or merger, because some other concern is able to utilize the resources to better advantage and hence can pay at least liquidating value for the assets.
- Complete or partial liquidation.
The fundamental problem is that good companies do not invariably equate to good investments. The price you pay matters. Don’t overpay!
In Closing
I am grateful for your participation in Leaven Partners, LP, and that you have entrusted me to manage your assets. I look forward to reporting to you at our next quarter-end.
In the meantime, if there is anything I can do for you, please do not hesitate to contact me. Sincerely,
Brent Jackson, CFA
Leaven Partners, LP • (313) 309-7024 • brent@leavenpartners.com
Footnotes
1The U.S. Dollar and Japanese Yen exchange rate is traditionally quoted in Japanese Yen. When the U.S. Dollar appreciates versus the Japanese Yen it takes more yen to buy dollars, so the spot exchange rate will go “up”. Conversely, when the yen appreciates against the dollar the spot exchange rate will show a downtrend.
2Every sector, except for the energy sector is down this year. Cryptocurrencies, SPACs, meme stocks, IPOs, SaaS and unprofitable tech companies, just to name a few, are all down significantly.
3“The problem is that after a decade of deranged monetary policies that ultimately amplified speculation beyond 1929 and 2000 extremes, we are so far from “normal’ that arriving anywhere near that neighborhood will be a journey. The recent market decline has simply retraced the frothiest portion of the recent bubble, bringing the most reliable market valuation measures back toward their 1929 and 2000 extremes.” https://www.hussmanfunds.com/comment/mc220707/?mc_cid=8579f97826&mc_eid=dfbb5461a6
4“While second-quarter profit growth forecasts have fallen in recent weeks, estimates for the third and fourth quarters and for all of 2022 have held up or risen, according to IBES data from Refinitiv.” https://www.reuters.com/markets/us/investors- worry-that-us-profit-forecasts-are-too-high-2022-06-16/
5Our largest block of put options, on iShares Russell 2000 Growth ETF, expire January 2023
6The objective of the put strategy was to limit losses when/if the inflating stock market bubble were to break. Now that the market is “breaking” and the initial heavy lifting of the put strategy is being done, the question is: do we discontinue the strategy? I believe we are still in a stock market bubble, just not as big of a bubble as it was in November 2021. However, valuation is not a good predictor of short-term market movements, and no one knows what will happen next. In this particular case, I am focused more on the price trend—which continues to remain in a downtrend.
7That is about $3.4 billion in U.S. Dollars, or equivalent to a U.S. mid-cap stock.
8This example is isolated in yen, so it assumes we are fully hedged against movements in the U.S. Dollar. Over the past year, the dollar appreciated by about 24% against the yen. Left unhedged, that would equate to an approximate -26% return!
9Graham, B., & Dodd, D. L. (2009). Security analysis: Principles and technique. New York: McGraw-Hill.
Editor’s Note: The summary bullets for this article were chosen by Seeking Alpha editors.
Be the first to comment