

LunaKate/iStock via Getty Images
This ETF (exchange-traded fund) article series aims at evaluating products regarding the relative past performance of their strategies and quality metrics of their current portfolios. As holdings and weights change over time, updated reviews are posted when necessary.
QUAL strategy and portfolio
The BTC iShares MSCI USA Quality Factor ETF (BATS:QUAL) was launched on 7/16/2013 to track the MSCI USA Quality Index. It changed strategies on 9/1/2015 to track the MSCI USA Sector Neutral Quality Index. It has a total expense ratio of 0.15% and 125 holdings, excluding cash and equivalents.
The underlying index weights stocks in the MSCI USA Index using a quality score based on three factors: return on equity (higher is better), earnings variability (lower is better) and leverage (lower is better). Then, constituent weights are adjusted to match the sector weights of the parent index (MSCI USA Index).
The fund invests mostly in large and mega cap companies (80% of asset value). The heaviest sector is technology (25.9%), followed by healthcare (16.1%), consumer discretionary (11%) and financials (10.8%). Other sectors are below 9%. Although it is based on the MSCI USA Index, the sector breakdown is very close to the S&P 500 (SPY).
QUAL sectors (Chart: author with iShares data)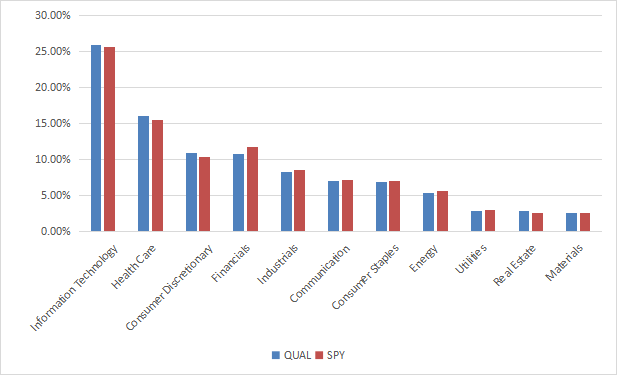
QUAL is cheaper than SPY regarding the price/earnings and price/cash flow ratios (see next table). Price/book is more expensive and price/sales is almost identical.
|
QUAL |
SPY |
|
|
P/E TTM |
16.43 |
19.48 |
|
Price/Book |
4.91 |
3.61 |
|
Price/Sales |
2.3 |
2.31 |
|
Price/Cash Flow |
13.65 |
14.31 |
Data: Fidelity
The top 10 companies in the portfolio, listed below, represent 31.9% of asset value. None of them weights more than 4.2%, so risks related to individual stocks are limited. The two share series of Alphabet Inc (GOOGL, GOOG), accounted as different holdings in the original list, have been grouped in the next table.
|
Ticker |
Name |
Weight (%) |
EPS growth %TTM |
P/E TTM |
P/E fwd |
Yield% |
|
S&P Global, Inc. |
4.18 |
3.09 |
28.95 |
31.23 |
0.98 |
|
|
Johnson & Johnson |
3.85 |
7.38 |
24.29 |
17.37 |
2.59 |
|
|
Apple, Inc. |
3.5 |
8.83 |
24.07 |
23.56 |
0.63 |
|
|
Eli Lilly & Co. |
3.47 |
1.64 |
55.38 |
47.14 |
1.06 |
|
|
NIKE, Inc. |
3.28 |
-6.48 |
28.25 |
33.93 |
1.23 |
|
|
Microsoft Corp. |
3.14 |
3.73 |
26.18 |
25.53 |
1.12 |
|
|
Alphabet, Inc. |
3.07 |
-4.28 |
18.90 |
19.85 |
0 |
|
|
NVIDIA Corp. |
2.61 |
8.85 |
51.65 |
46.98 |
0.10 |
|
|
Mastercard, Inc. |
2.49 |
23.12 |
33.69 |
31.98 |
0.58 |
|
|
Visa, Inc. |
2.34 |
25.45 |
29.85 |
24.74 |
0.88 |
Performance
Since the underlying index changed in September 2015, QUAL has lagged SPY and the Invesco S&P 500 Quality ETF (SPHQ) by less than one percentage point in annualized return. It doesn’t show a reduction of risk measured in drawdown and volatility.
|
Total Return |
Annual Return |
Drawdown |
Sharpe ratio |
Volatility |
|
|
QUAL |
116.45% |
11.36% |
-31.85% |
0.67 |
16.41% |
|
SPHQ |
128.80% |
12.23% |
-29.34% |
0.77 |
15.00% |
|
SPY |
129.96% |
12.30% |
-32.05% |
0.76 |
15.93% |
QUAL has also underperformed SPY and SPHQ in 2022 to date (next chart). Another quality ETF did much better: the American Century STOXX U.S. Quality Value ETF (VALQ).
QUAL vs. 2 competitors and SPY in 2022 (Portfolio123)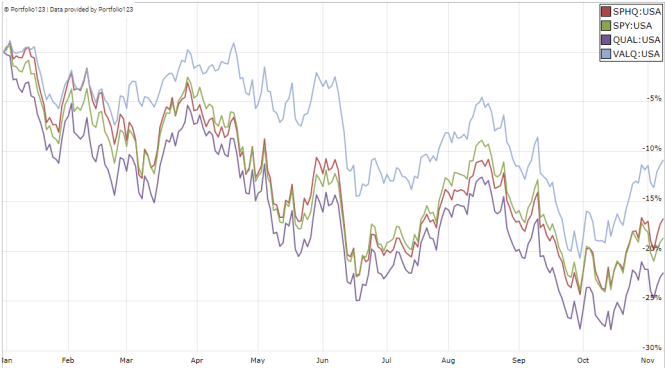
Comparing QUAL with my quality model
In previous articles, I have shown how three factors may help cut the risk in a dividend portfolio: Return on Assets, Piotroski F-score, and Altman Z-score.
The next table compares QUAL since September 2015 with a subset of the S&P 500: stocks with a dividend yield and an ROA above the average, a good Altman Z-score, a good Piotroski F-score, and a sustainable payout ratio. It is rebalanced annually to make it comparable with a passive index.
|
Total Return |
Annual Return |
Drawdown |
Sharpe ratio |
Volatility |
|
|
QUAL |
116.45% |
11.36% |
-31.85% |
0.67 |
16.41% |
|
Large cap quality subset |
144.56% |
13.27% |
-37.07% |
0.78 |
16.68% |
Past performance is not a guarantee of future returns. Data Source: Portfolio123
QUAL lags my S&P 500 quality subset by 1.9 percentage point in annualized return. However, QUAL performance is real, whereas the subset is simulated. My core portfolio holds 14 stocks selected in this subset (more info at the end of this post).
Scanning QUAL with quality metrics
QUAL currently holds 125 stocks, of which 7 are risky regarding my metrics. In my ETF reviews, risky stocks are companies with at least 2 red flags among: bad Piotroski score, negative ROA, unsustainable payout ratio, bad or dubious Altman Z-score, excluding financials and real estate where these metrics are less reliable. Here, risky stocks weight only 2.4% asset value, which is a good point.
According to my calculation of quality metrics (reported in the next table), portfolio quality is significantly superior to the benchmark. The aggregate return on assets is especially impressive.
|
Altman Z-score |
Piotroski F-score |
ROA% TTM |
|
|
SPY |
3.44 |
5.8 |
7.58 |
|
QUAL |
6.35 |
5.8 |
15.26 |
Takeaway
QUAL selects large and mid-cap U.S. companies with a quality score based on ROE, earnings variability and financial leverage. It seeks to keep the sector weights of the U.S. stock market. It is a bit cheaper than the S&P 500 regarding the price/earnings and price/cash flow ratios. My metrics confirm the high quality of QUAL portfolio. Its exposure to risky stocks regarding my criteria is only 2.4%.
Despite all these good points, QUAL historical performance is disappointing: it has lagged SPY since 2015, and it is behind its competitors SPHQ and VALQ in 2022. For transparency, I have a passive allocation in quality-oriented ETFs (QUAL is not part of it) and a dividend quality active portfolio of 14 stocks (“Stability” model).
Be the first to comment