

AlpamayoPhoto/E+ via Getty Images
A Quick Take On Lead Real Estate Co.
Lead Real Estate Co., Ltd. (LRE) has filed to raise $27 million in an IPO of its American Depositary Shares representing underlying ordinary shares, according to an F-1 registration statement.
The firm develops and sells luxury residential properties and other property activities in Japan and Dallas, Texas.
For risk-on investors, the LRE IPO may be an interesting opportunity to play Japanese high rise real estate in a period of time where it has become a favored wealth transfer asset.
I’m more cautious, so my outlook on the IPO is on Hold for the near term.
Lead Real Estate Overview
Tokyo, Japan-based Lead Real Estate was founded to develop single-family homes and condominiums for sale in Tokyo and Kanagawa prefecture in Japan.
Management is headed by founder, president, and CEO Mr. Eiji Nagahara, who has been with the firm since inception in 2001 and previously worked at a variety of real estate companies such as FEC Co., Mibu Co., and Uptown Co.
The company also operates hotels in Tokyo and leases apartment building units to renters in Japan and Dallas, Texas.
Lead Real Estate has booked fair market value investment of $2.6 million as of December 31, 2021, from investors including the founder Eiji Nagahara.
Lead Real Estate – Customer Acquisition
The firm operates through real estate agents and targets wealthy family buyers who are buying for their personal use as well institutional customers who are buying for investment purposes.
The company recently launched a listing and marketing platform it calls Glocaly to match sellers and buyers of condominiums.
Selling, G&A expenses as a percentage of total revenue have risen as revenues have increased, as the figures below indicate:
|
Selling, G&A |
Expenses vs. Revenue |
|
Period |
Percentage |
|
Six Mos. Ended December 31, 2021 |
12.4% |
|
FYE June 30, 2021 |
9.2% |
|
FYE June 30, 2020 |
9.4% |
(Source – SEC)
The Selling, G&A efficiency multiple, defined as how many dollars of additional new revenue are generated by each dollar of Selling, G&A spend, rose slightly to 2.9x in the most recent reporting period, as shown in the table below:
|
Selling, G&A |
Efficiency Rate |
|
Period |
Multiple |
|
Six Mos. Ended December 31, 2021 |
2.9 |
|
FYE June 30, 2021 |
2.5 |
(Source – SEC)
Lead Real Estate’s Market & Competition
According to a 2021 market research report by Japan Property Central citing the Real Estate Economic Institute, the latest report shows 280 high-rise apartment buildings planned or under construction throughout Japan from 2021 forward.
The 280 buildings are planned to provide over 109,000 apartments, of which nearly 75% will be within the greater Tokyo area.
The main drivers for this expected growth are a change in inheritance tax deductions in 2015 as well as increased construction near public transportation stations.
Also, the chart below shows the historical and projected future annual supply of new apartments in high-rise buildings in the greater Tokyo region:
Tokyo High Rise Apartment Supply (Real Estate Economic Institute)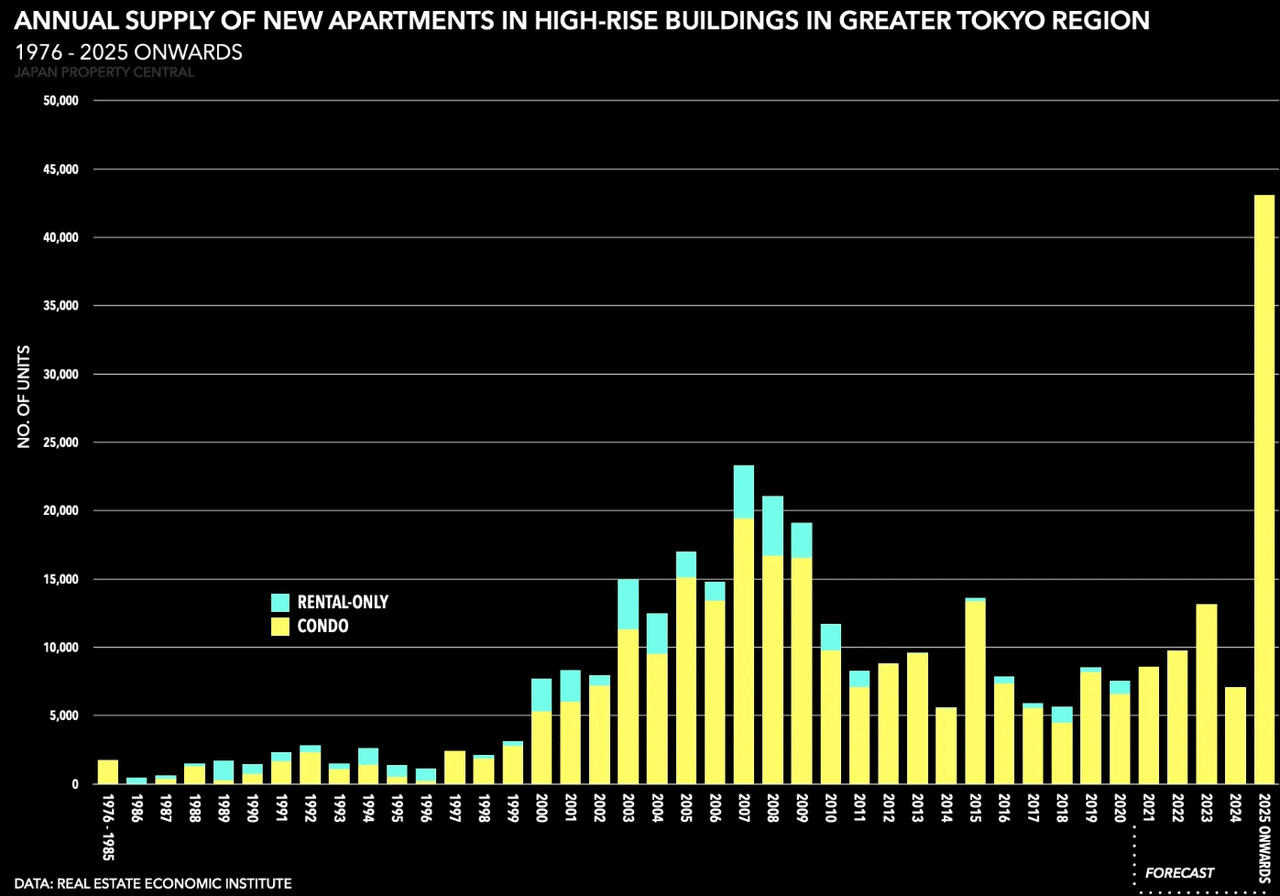
Major competitive or other industry participants include:
-
Mitsubishi Estate (OTCPK:MITEY)
-
Sumitomo Realty & Development (OTCPK:SURDF)
-
Mori Trust (OTCPK:MRGIF)
-
Tokyo Land Corporation
-
Mitsui Fudosan (OTCPK:MTSFF)
-
Nomura Real Estate (OTCPK:NMEHF)
-
Daiwa House Group (OTCPK:DWAHY)
-
Tokyo Tatemono (OTCPK:TYTMF)
-
Nakano Corporation
-
Daikyo
Lead Real Estate Financial Performance
The company’s recent financial results can be summarized as follows:
-
Growing topline revenue
-
Increasing gross profit and gross margin
-
Higher operating profit and operating margin
-
Increasing cash used in operations
Below are relevant financial results derived from the firm’s registration statement:
|
Total Revenue |
||
|
Period |
Total Revenue |
% Variance vs. Prior |
|
Six Mos. Ended December 31, 2021 |
$ 53,368,877 |
55.9% |
|
FYE June 30, 2021 |
$ 84,347,100 |
29.7% |
|
FYE June 30, 2020 |
$ 65,055,186 |
|
|
Gross Profit (Loss) |
||
|
Period |
Gross Profit (Loss) |
% Variance vs. Prior |
|
Six Mos. Ended December 31, 2021 |
$ 8,967,131 |
126.4% |
|
FYE June 30, 2021 |
$ 11,143,967 |
49.7% |
|
FYE June 30, 2020 |
$ 7,445,301 |
|
|
Gross Margin |
||
|
Period |
Gross Margin |
|
|
Six Mos. Ended December 31, 2021 |
16.80% |
|
|
FYE June 30, 2021 |
13.21% |
|
|
FYE June 30, 2020 |
11.44% |
|
|
Operating Profit (Loss) |
||
|
Period |
Operating Profit (Loss) |
Operating Margin |
|
Six Mos. Ended December 31, 2021 |
$ 2,322,969 |
4.4% |
|
FYE June 30, 2021 |
$ 3,399,625 |
4.0% |
|
FYE June 30, 2020 |
$ 1,340,715 |
2.1% |
|
Comprehensive Income (Loss) |
||
|
Period |
Comprehensive Income (Loss) |
Net Margin |
|
Six Mos. Ended December 31, 2021 |
$ 1,396,208 |
2.6% |
|
FYE June 30, 2021 |
$ 2,086,541 |
3.9% |
|
FYE June 30, 2020 |
$ 750,022 |
1.4% |
|
Cash Flow From Operations |
||
|
Period |
Cash Flow From Operations |
|
|
Six Mos. Ended December 31, 2021 |
$ (10,297,400) |
|
|
FYE June 30, 2021 |
$ (1,833,446) |
|
|
FYE June 30, 2020 |
$ (384,457) |
|
As of December 31, 2021, Lead Real Estate had $2 million in cash and $63.8 million in total liabilities.
Free cash flow during the twelve months ended December 31, 2021, was negative ($7.2 million).
Lead Real Estate IPO Details
Lead Real Estate intends to raise $27 million in gross proceeds from an IPO of its American Depositary Shares representing underlying ordinary shares.
No existing shareholders have indicated an interest to purchase shares at the IPO price.
Post-IPO, the firm’s founder will control approximately 84.4% of the voting stock of the public company.
Assuming a successful IPO, the company’s enterprise value at IPO would approximate $227.4 million, excluding the effects of underwriter over-allotment options.
The float to outstanding shares ratio (excluding underwriter over-allotments) will be approximately 13.8%. A figure under 10% is generally considered a ‘low float’ stock which can be subject to significant price volatility.
Management says it will use the net proceeds from the IPO as follows:
approximately 50% for domestic business expansion, including expanding our condominium development and sales in Japan;
approximately 30% for the development of our Glocaly platform, including sales and marketing, feature development, and server maintenance costs; and
approximately 20% for general corporate purposes
(Source – SEC)
Management’s presentation of the company roadshow is not available.
Regarding outstanding legal proceedings, management said the firm is not currently a party to any legal or administrative proceedings that would have a material adverse effect on its financial condition or operations.
The sole listed bookrunner of the IPO is Network 1 Financial Securities.
Valuation Metrics For LRE
Below is a table of the firm’s relevant capitalization and valuation metrics at IPO, excluding the effects of underwriter options:
|
Measure [TTM] |
Amount |
|
Market Capitalization at IPO |
$195,735,150 |
|
Enterprise Value |
$227,448,150 |
|
Price / Sales |
1.89 |
|
EV / Revenue |
2.20 |
|
EV / EBITDA |
44.29 |
|
Earnings Per Share |
$0.22 |
|
Operating Margin |
4.96% |
|
Net Margin |
3.08% |
|
Float To Outstanding Shares Ratio |
13.79% |
|
Proposed IPO Midpoint Price per Share |
$13.50 |
|
Net Free Cash Flow |
-$7,207,277 |
|
Free Cash Flow Yield Per Share |
-3.68% |
|
Debt / EBITDA Multiple |
11.73 |
|
CapEx Ratio |
-5.75 |
|
Revenue Growth Rate |
55.86% |
|
(Glossary Of Terms) |
(Source – SEC)
Commentary About Lead Real Estate’s IPO
LRE is seeking U.S. capital market funding for its expansion plans in Japan.
The company’s financials have produced increasing topline revenue, growing gross profit and gross margin, increased operating profit and operating margin and higher cash used in operations.
Free cash flow for the twelve months ended December 31, 2021, was negative ($7.2 million).
Selling, G&A expenses as a percentage of total revenue has risen as revenue has increased; its Selling, G&A efficiency multiple rose to 2.9x in the most recent reporting period.
The firm did not characterize any plans to pay dividends, however, management said that any cash dividends paid would be paid in Japanese yen.
The company’s trailing twelve-month CapEx Ratio is negative (5.75), which indicates it is spending heavily on capital expenditures as a percentage of its operating cash flow.
The market opportunity for building residential towers in Japan is large and expected to grow strong, so the firm enjoys strong industry growth dynamics in its favor.
Network 1 Financial Securities is the sole underwriter and the four IPOs led by the firm over the last 12-month period have generated an average return of 498.2% since their IPO. This is a top-tier performance for all major underwriters during the period.
The primary risk to the company’s outlook is a rising interest rate environment, although so far, the Japanese financial authorities have intervened to keep interest rates low during a period of inflation.
As for valuation, management is asking investors to pay an EV/Revenue multiple of approximately 2.2x.
Although the firm appears well positioned in a growth market, its exposure to currency risk is significant as the Japanese Yen has fallen against the US Dollar over the past year as the chart shows here:
One Year Chart: Japanese Yen vs. US Dollar (Google Finance)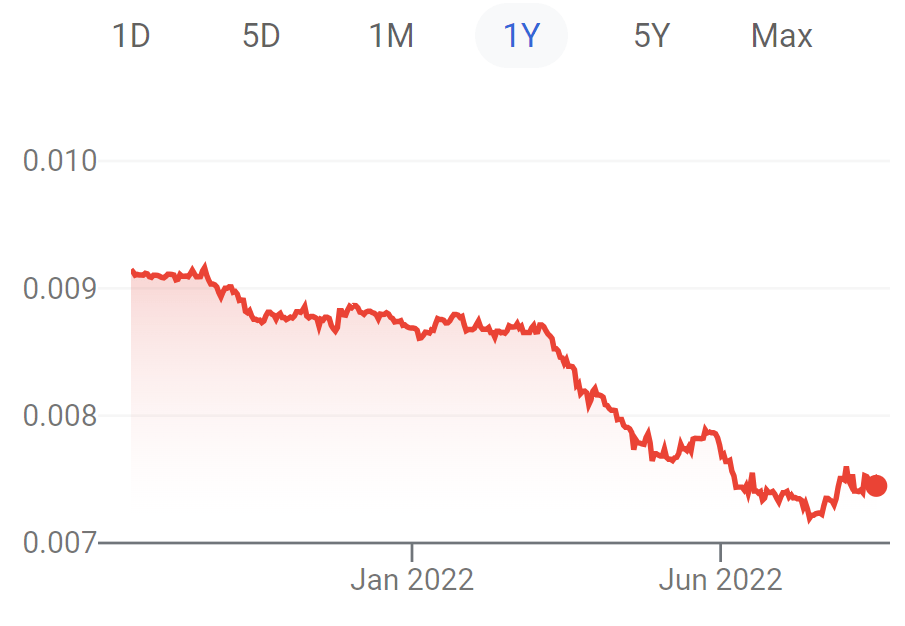
So, while the company may perform well in its development activities, that performance is at risk of being partially negated by a falling yen against the dollar.
For risk-on investors, the LRE IPO may be an interesting opportunity to play Japanese high rise real estate in a period of time where it has become a favored wealth transfer asset.
I’m more cautious, so my outlook on the IPO is on Hold for the near term.
Expected IPO Pricing Date: To be announced.
Be the first to comment