

milan2099/E+ via Getty Images
Thesis
Masonite (NYSE:DOOR) is currently trading at a premium that is not factoring in any margin of safety for investors. Analyzing Masonite through the lens of having potentially both negative and positive outcomes over the next decade is important. The current long-term housing price index trends are favorable for Masonite but the short-term volatility is cause for contingency planning. Masonite insiders observably trade with inconsistent patterns resulting in net selling overall. This does not exude confidence for retail investors and requires a margin of safety before establishing a position. Masonite showed strengthening performance trends through the past decade but the current price does not factor in any potential negative outcomes as experienced from 2007 to 2012.
Introduction
The intent of this analysis is to assess whether Masonite is a good long-term investment. In my attempt to analyze Masonite, I focused on a few key aspects to determine whether I would be willing to start establishing a position. Given the market that Masonite operates in, it is important to consider multiple scenarios for valuation. The process for the analysis is as follows:
- Accentuate potential risk outcomes using significant macro-economic trends
- Utilize descriptive analytics to determine multiple discounted cash flow (DCF) inputs
- Discounted cash flow valuation scenarios
- Gain perspective on insider transactions
This article is not a complete portrayal of each and every variable that affects Masonite as a firm. The intent is to highlight important aspects and derive assumptions from those in a relevant manner to determine potential valuation models.
Macroeconomic Trends
Housing market trends are extremely important for the successful growth of Masonite. The first step in the analysis was to analyze multiple housing indicators and determine if one has a high correlation with Masonite revenue. The approach considered using housing price data and housing new starts as a few potential key driving variables which are referenced as some of the factors that influence product demand on Masonite’s 10Q. The All-Transactions House Price Index (HPI) for the United States and the New Privately-Owned Housing Units Started: Total Units (New Residential Construction) were selected as the potential driving variables due to their comprehensive nature in the portrayal of a healthy housing market.
The HPI is a weighted broad measure of the movement of single-family home prices. It “serves as a timely, accurate indicator of house price trends at various geographic levels” (Figure 1). The figure shows a long term trend line of the weighted index and has a few interesting observable qualities. The first observation I notice is how the index rate of change increased upwards at the end of 2020 and into early 2021. This rate increase over the past two years is unlike any other period since 1975 according to the figure. The second observation that is most notable is how there was a large downtrend in the index from 2007 until 2012 which resulted in an approximate 20% decrease from peak to trough. The third observation is how the housing index seems to be trending in a generally positive manner throughout the time period.
Figure 1. All-transactions housing price index (FRED & Author)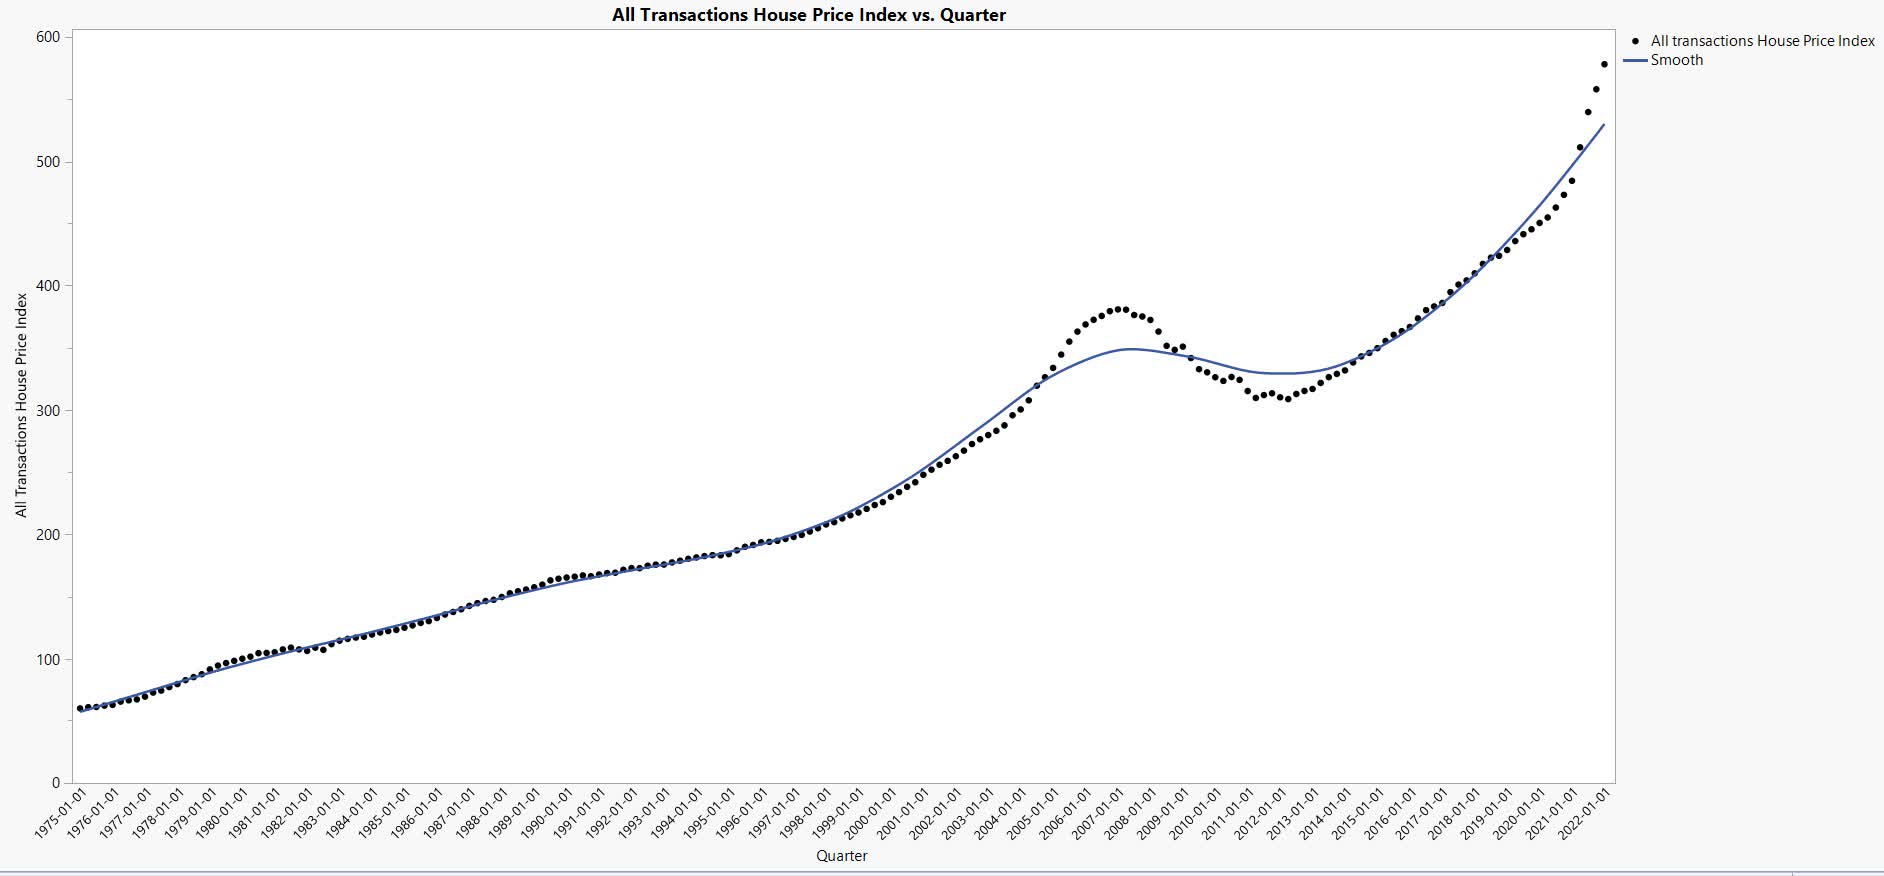
The New Residential Construction data is based on the number of new housing units authorized by building permits (Figure 2). The figure shows the long-term cyclicality of building permits from 1959 until 2022. The observation of this data represents the ebbs and floods of building permits which are driven by investor and personal sentiment among other factors. The current trend seems to be on a decade long uptrend with periods of volatility. It is beyond the scope of this article to attempt to forecast where the peak of the trend will reside and the subsequent effects.
Figure 2. New residential construction (FRED and Author)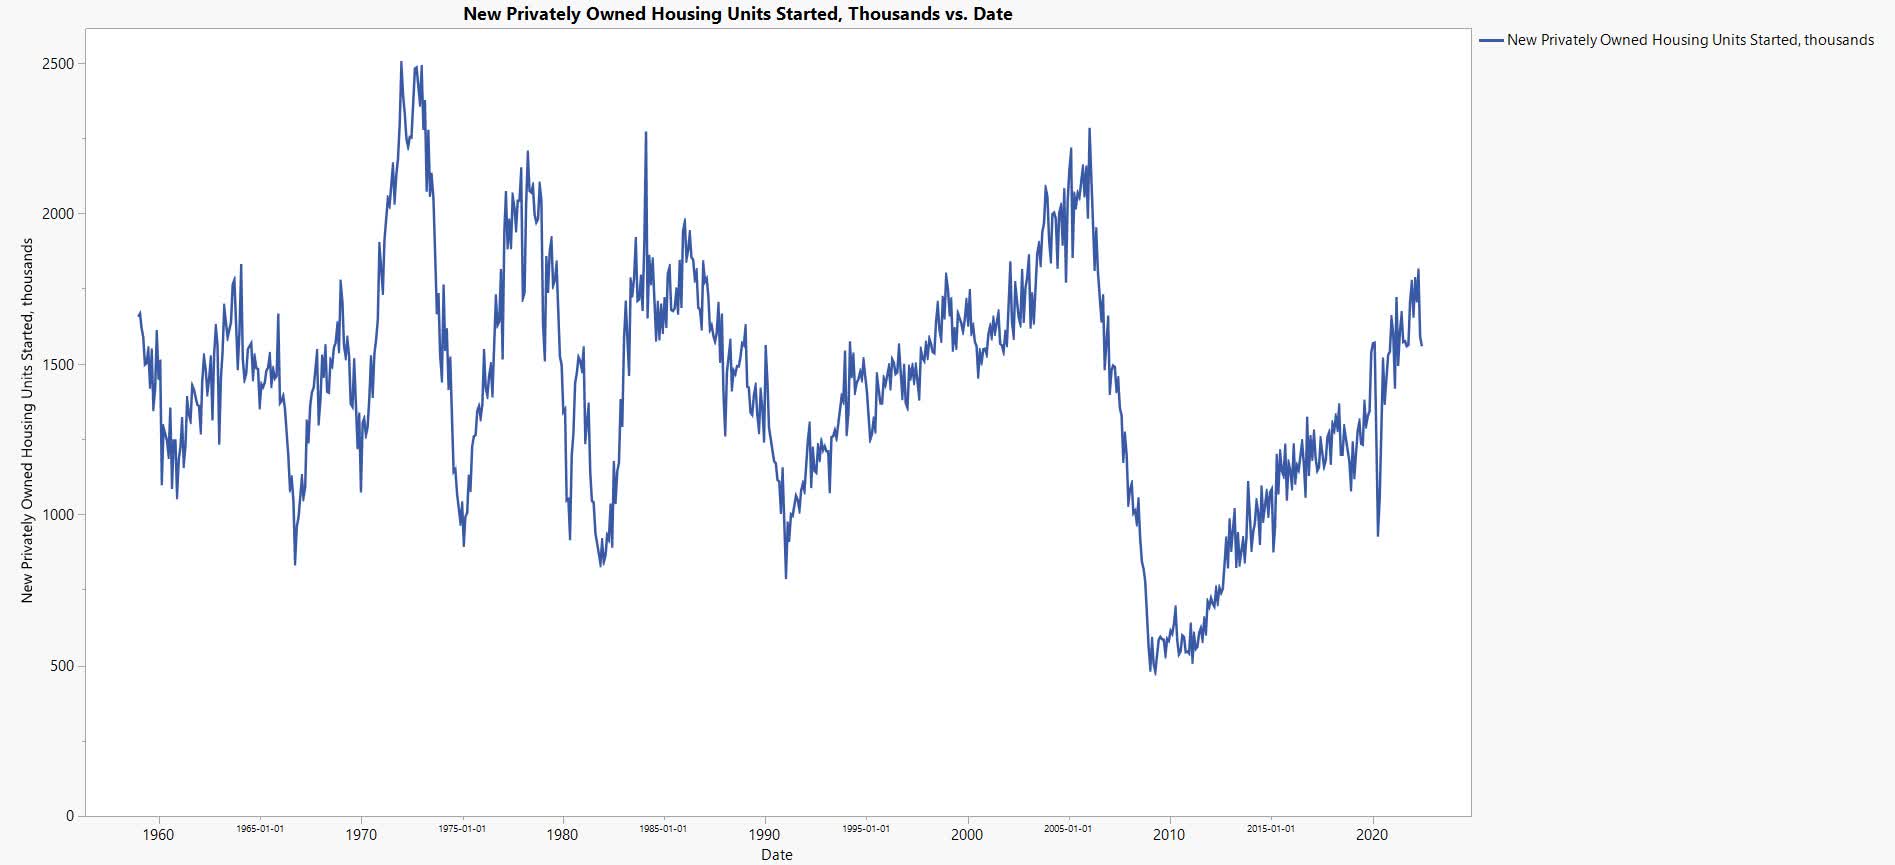
The next step was to utilize an ANOVA model and determine which of the variables carried significance with the revenues of Masonite since 2007 (Figure 3). The results demonstrate that the better variable to utilize is the HPI since it has a much stronger correlation with Masonite revenue. This is observable by having a significance of less than 0.0001 and through the relatively linear trend as seen in the right-most aspect of figure 3.
Figure 3. ANOVA of variables (Author)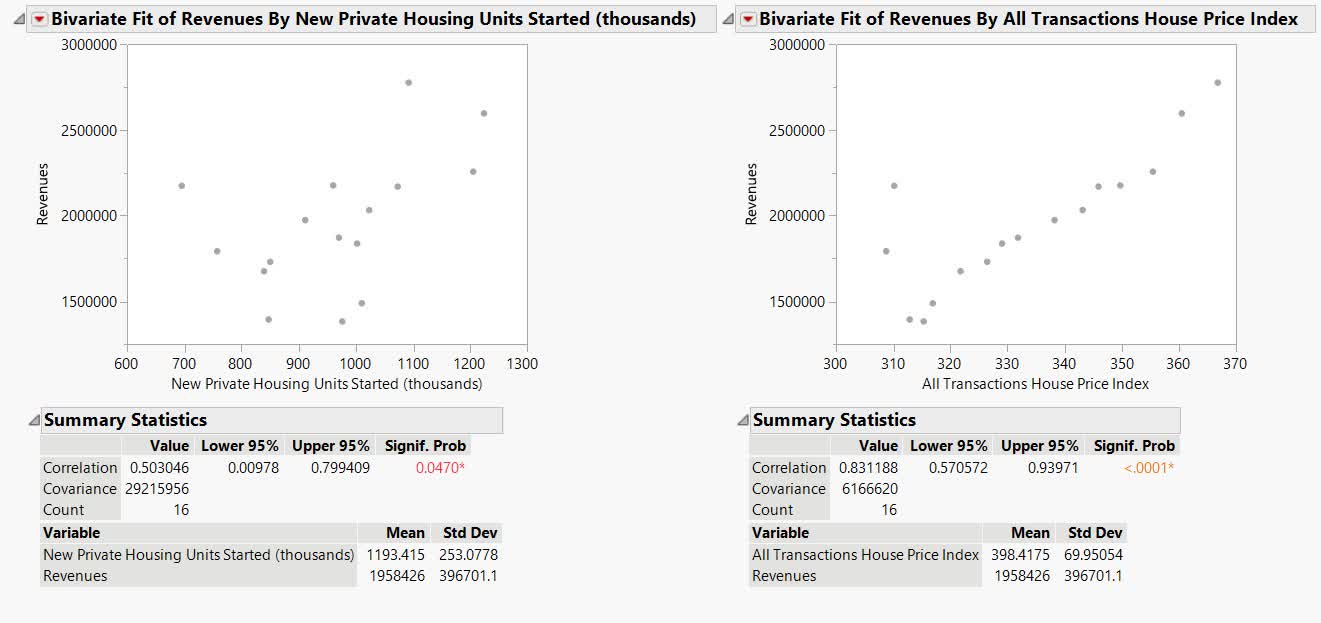
Finally, a simple linear regression is performed to determine that there is a high correlation between the HPI and the total quarterly revenue of Masonite (R2 = 0.908, P < 0.0001, Figure 4). The formula for solving for quarterly revenue is $128,587 + (952.6 * HPI). This suggests that we could solve quarterly revenue for different values of HPI along the line of best fit.
Figure 4. Simple linear regression of HPI and revenue (Author)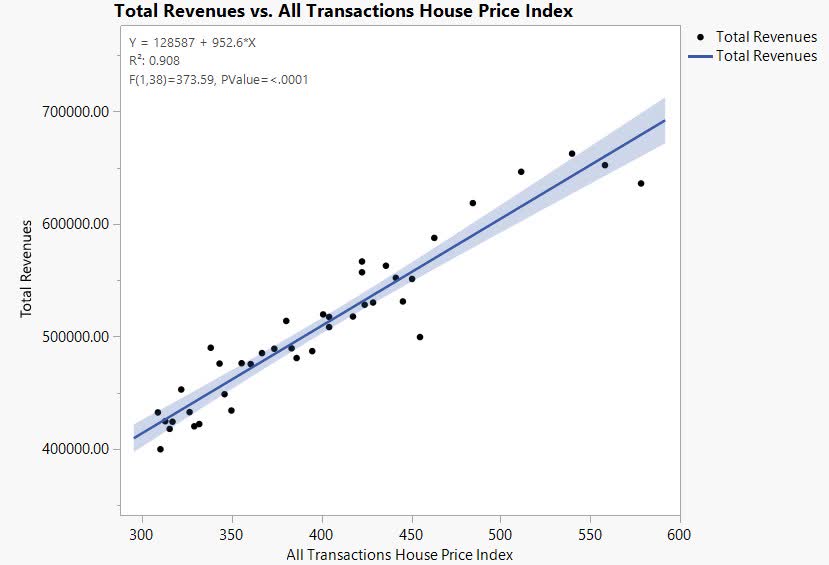
What is important to deduce from the analysis of macro-housing indicators is that the long-term trend of the HPI is likely to be beneficial for Masonite since there historically is a positive trend in the overall HPI index. There is also a possibility that a large downturn in the HPI could significantly affect the valuation of Masonite. We clearly observe that the rate of change of the index through the past two years has been larger than its historical amount and that housing construction building permits are typically cyclical. All of these are important points to consider when developing a thesis for investments. It is also important to understand that historical trends are not the only consideration for forecasting and that timing the market is not a realistic way to invest for retail investors. Therefore, hypothesizing different scenarios and their likelihood is the most logical way to proceed.
Risk Outcomes
The regression is important because it allows us to statistically derive a risk outcome based from historical data. We can observe the HPI trends over time noting that the period between 2007 and 2012 showed a decrease in the index value. As we recall, an approximate 20% downturn occurred in that time-period which could be used as an aid to calculate the approximate revenue impact that would have on Masonite. The most recent reading of the HPI occurred in Q1 of 2022 with a value of 578.04. This means an adjustment of 20% would result in an HPI value of 462.432. Utilizing that value would equal a quarterly revenue of $569,099 which annualizes to $2,276,398.89 which is a large decrease from the current annualized revenue.
Another way of considering the risk to revenue of Masonite would be to consider the firm’s demonstrated performance over the same time period of poor performance. The annual revenue in 2007 was approximately $2,174,431,000 compared to the low in 2010 of $1,383,271,000 which is a total decline of approximately 36% spread over multiple years.
This revenue is significantly lower than the current estimated revenue and would place pressure on the price action of Masonite if this risk were to materialize. This potential risk outcome is not currently factored into the current price action of Masonite and modeling a scenario that includes the statistical values is important to consider for downside perspective.
Descriptive Analytics
The descriptive analytics are going to be used to derive inputs for the valuation model. The free cash flow and revenue can be utilized to create discounted cash flow models for estimating a range of implied values of the firm that may be suitable for different investors.
Free Cash Flow Margins
The annual free cash flow margin distribution since 2007 shows a mean FCF margin of 2.83% and a median of 2.69% (Figure 5). It also shows that the 95% confidence interval is from 0.68% to 4.97% meaning that the FCF margin values historically have fallen 95% of the time between that range.
The quarterly free cash flow margin distribution since Q1 2012 shows a mean FCF margin of 3.99% and a median of 4.92% (Figure 5). It also shows that the 95% confidence interval is from 2.03% to 5.95% meaning that the FCF margin values historically have fallen 95% of the time between that range.
The difference between the quarterly and annualized margins is likely due to the time periods covered. Since the annualized margins are from 2007, the results factor in a period of more challenging firm performance. Multiple FCF margins will be utilized for valuation in this analysis to incorporate a range of potential outcomes. It is important to note that the operating performance of Masonite has improved due to factors such as technology improvement, systems improvement, etc… though it is indeterminate to know whether the improved margins could be sustained if macroeconomic pressures increased on Masonite given the current business model.
Figure 5. Free cash flow margin distribution, annual and quarterly (Author)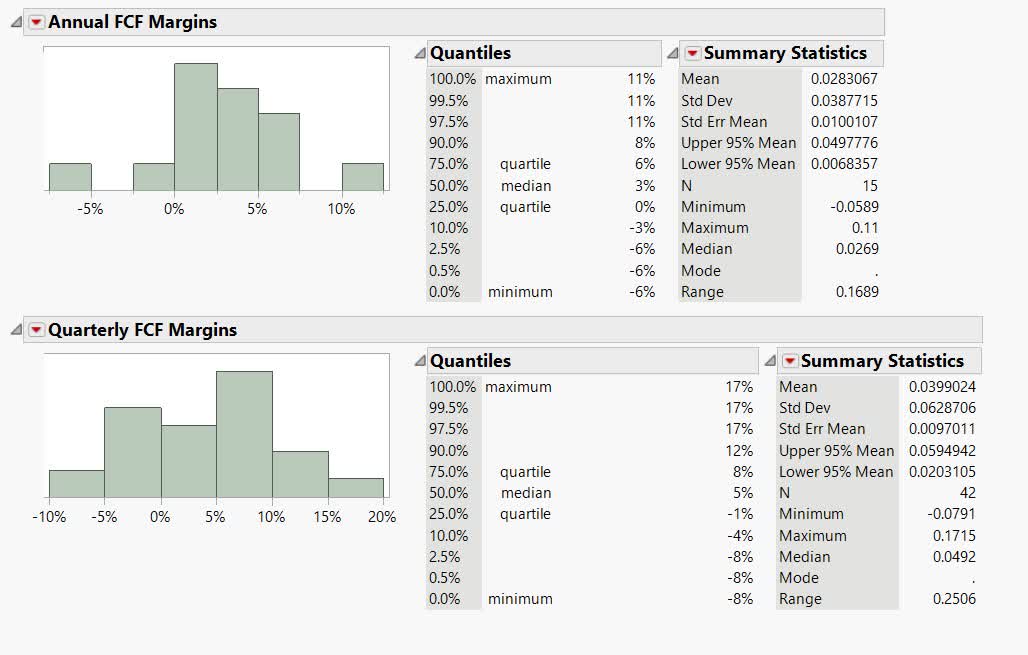
Revenue Growth Rates
The historical revenue growth rates combined with short-term analyst estimates or Masonite’s revenue forecasts can help hypothesize revenue into the future.
The mean and median annualized revenue growth rate since 2007 is 2.14% and 3.69% respectively. This incorporates the two negative years around the period of 2007. The 95% confidence interval ranges from -3.35% to 7.63% meaning that the revenue growth values have historically fallen 95% of the time between that range.
Figure 6. Revenue growth rates, annual (Author)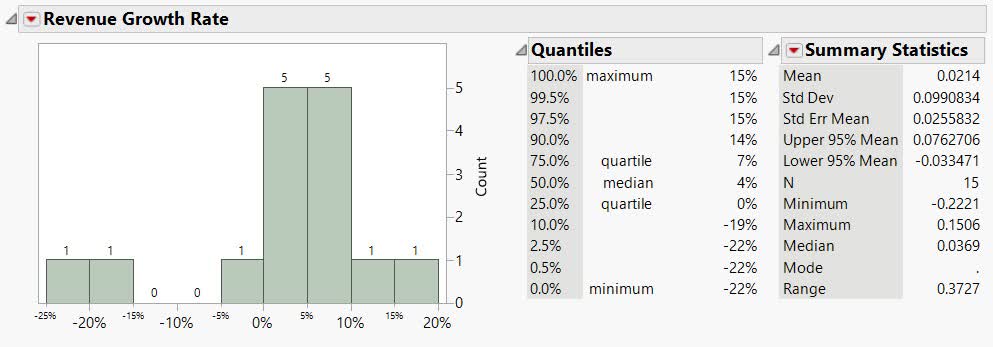
According to TIKR Terminal, analysts’ expectations estimate the revenue in 2024 to grow to approximately $3 billion (Figure 7).
Figure 7. Analysts revenue estimates through 2024 (TIKR Terminal)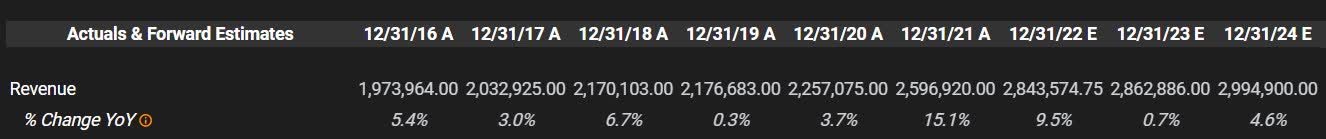
According to Masonite, their 2025 Centennial Plan Financial Goal is to achieve approximately $4 billion in revenue through 2025 (Figure 8).
Figure 8. Masonite revenue Centennial Plan goal (Masonite Q2 2022 Earnings Presentation)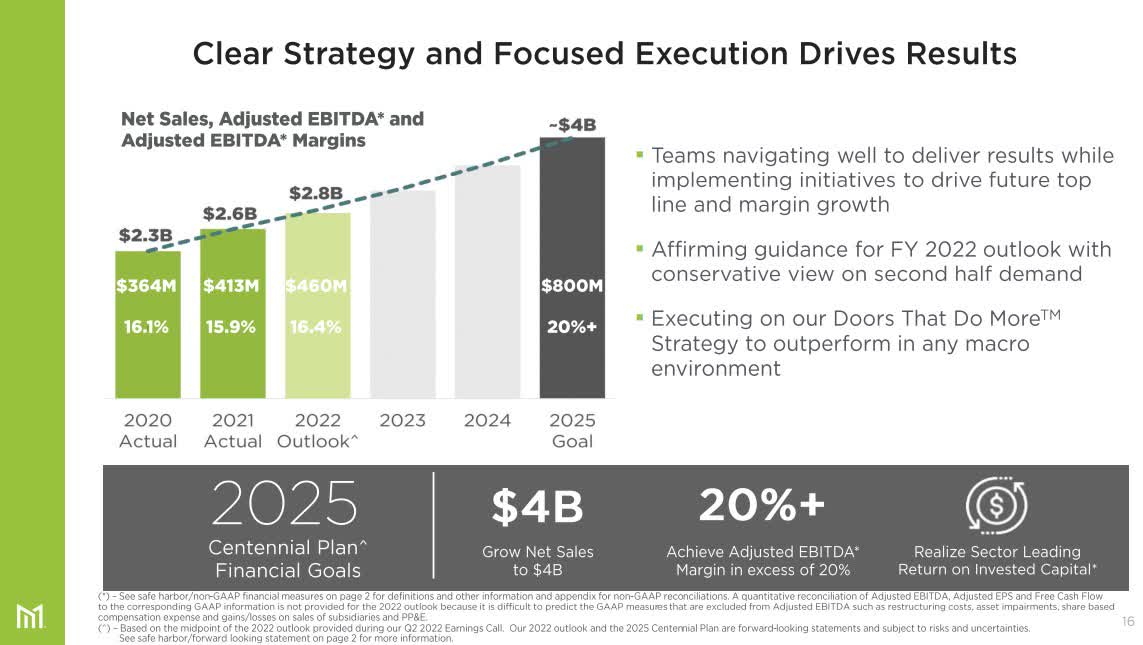
The different revenue estimates can be utilized to create a range of potential outcomes which investors can factor into their decision making process.
Valuation Scenarios
The valuation scenarios will utilize a variety of assumptions to aid in the determination of a range of fair values for investors with different perspectives on the potential outcomes as explored in this article. The discount rate utilized will be 10% chosen based off my desired return expectation.
Scenario 1
Scenario 1 attempts to be a statistically-based model based on the historical performance of Masonite since 2007. The revenue estimates through 2024 are analyst estimates and then increase at the median annualized historical rate of 3.69% per year with a terminal growth rate of 3%. The FCF margins utilize the historical median of 2.69%. These inputs combined with the current net debt and shares outstanding as of Q2 2022 result in an implied value of $14.32 per share. This scenario incorporates a risk component of the 2007 to 2012 declining time period and is a much more cautionary model.
Figure 9. DCF scenario 1 (Author)
Scenario 2
Scenario 2 attempts to incorporate a more optimistic model which utilizes the revenue estimates from the firm’s goals along with the top 95% confidence interval for historical FCF margins of 4.97% and top 95% confidence interval for revenue growth of 7.63% with a terminal value of 3%. If Masonite is able to perform comparably in the top 95th percentile of their historical performance, then this scenario would create a fair implied value. These inputs combined with the current net debt and shares outstanding as of Q2 2022 result in an implied value of $100.40 per share.
Figure 10. DCF scenario 2 (Author)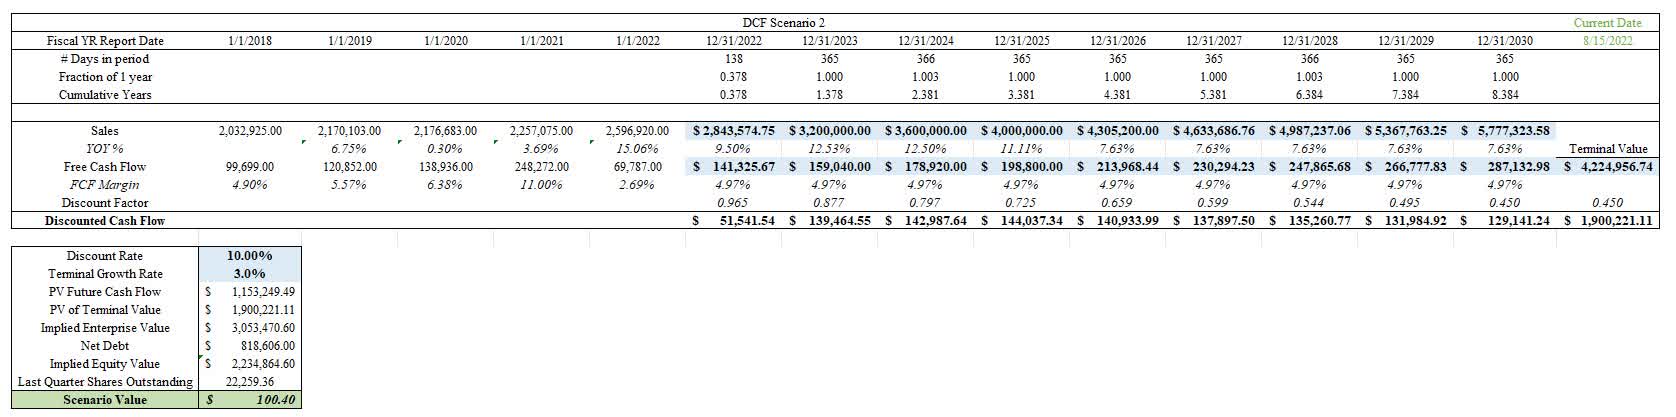
Scenario 3
Scenario 3 attempts to incorporate more current trends into the model (Figure 11). This scenario utilizes the revenue estimates and FCF estimates from analysts through 2024 and then utilizes the median revenue growth rate of 3.69% until 2030 and then 3% in perpetuity. This model utilizes a FCF margin of 4.92% which is the quarterly FCF median since 2012 which removes the negative effect of the 2007-2012 time period into the analysis. These inputs combined with the current net debt and shares outstanding as of Q2 2022 result in an implied value of $61.28 per share. This model considers a more balanced approach but does not factor in a margin of safety for potential housing market declining factors.
Figure 11. DCF Scenario 3 (Author)
Insider Transactions
The insider transactions as cataloged by Dataroma show a varying range of buying and selling since Q4 2020 (Figure 12). I theorize that the insider transaction behaviors send mixed messages to potential investors of Masonite.
Figure 12. Insider transactions (DATAROMA)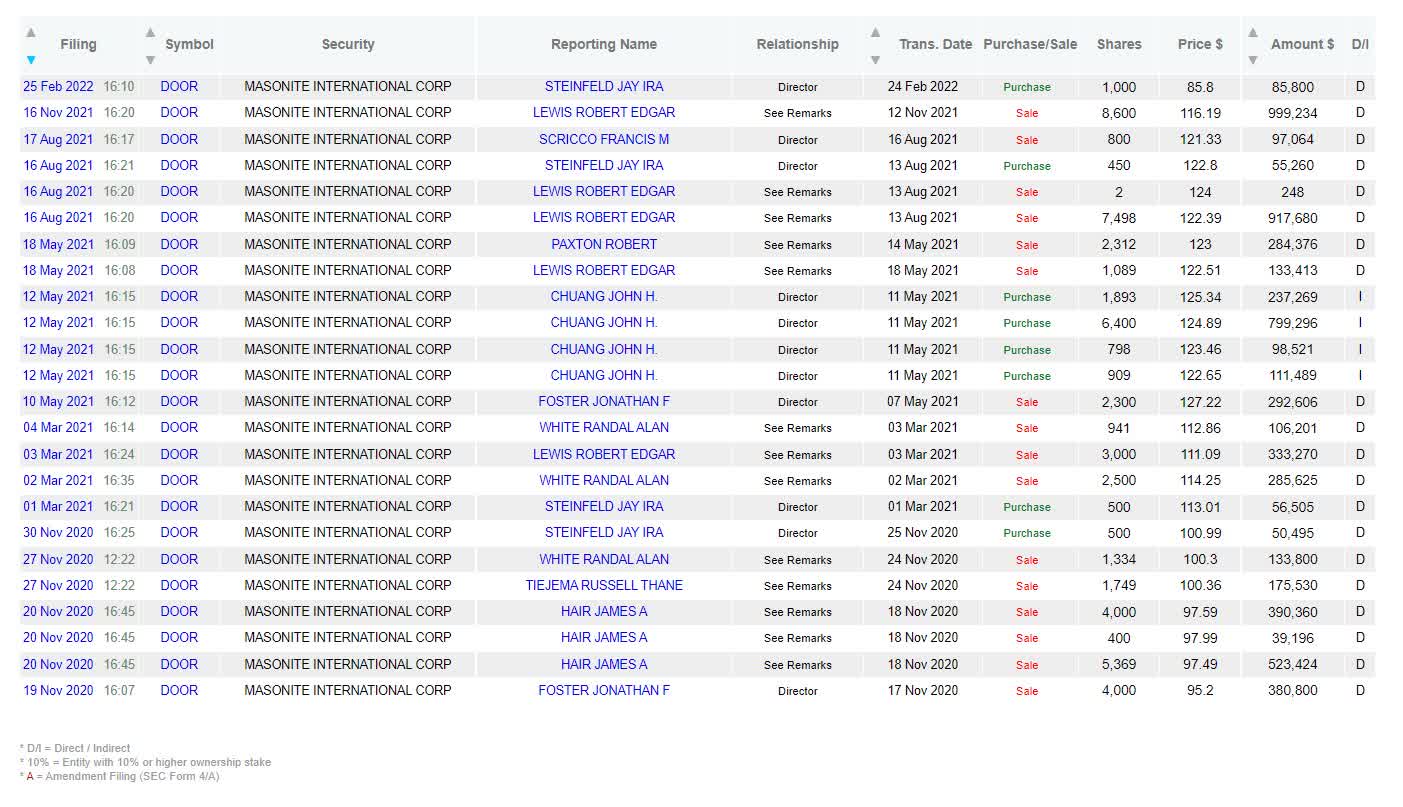
The last quarter of 2020 showed a substantial amount of selling in the $95 to $100 range along with a disproportionate net amount of selling (Figure 13). This was followed by almost a 2:1 selling-purchases ratio throughout 2021 in the $110 to $130 range. 2022 only has seen a single purchase though Masonite price action has been trading around its Q3 & Q4 2022 levels. It seems observable that an overall selling trend has been predominant over the past two years without any significant pattern for purchasing-selling pricing.
Figure 13. Insider transaction amount by year (Author)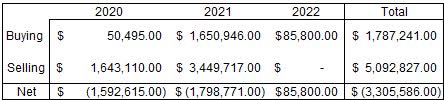
Risk
The analysis added the complexity of historical perspective into the valuation of Masonite. In the event that the HPI decreased, there is a strong correlation with a decrease in Masonite revenue which is heavily reliant on the larger housing market. The valuation of scenario 1 incorporates the statistical relevance of the 2007 to present time period which includes a period of decline followed by a period of growth. Scenario 1 values Masonite as trading substantially above the scenario valuation. Scenario 2 considers a very rational performance on behalf of Masonite and still values the company as currently trading at a high premium. The risks involved with Masonite do not seem to be currently factoring into the current price action.
Conclusion
A consideration of multiple potential outcomes for Masonite is important when developing a thesis for investments. It is also important to understand that historical trends are not necessarily the only consideration for forecasting and that attempting to time the market is not ideal. Therefore, hypothesizing different scenarios and their likelihood is the most logical way to proceed ultimately leading to the “Hold” rating which considers both potential negative and positive outcomes (Figure 14).
Figure 14. Summary (Author)
The current price of Masonite as of this writing was approximately $92 which is likely above the price that a more conservative investor would be willing to establish a position. Masonite insiders seem to trade with inconsistent patterns resulting in net selling overall which does not exude confidence for retail investors. Masonite shows strengthening trends macro and performance trends but the current price does not factor in any potential negative outcomes and is currently on the high end of the optimistic scenario.
Be the first to comment