

studiocasper/E+ via Getty Images
Part I – Introduction
Toronto-based Kinross Gold Corp. (NYSE:KGC) released its fourth-quarter and full-year 2021 results on February 16, 2022.
1 – 4Q21 and full-year 2021 result snapshot
Kinross Gold produced 2,067,549 gold equivalent ounces in 2021, in line with the revised production guidance and 13% lower than 2020 (2,366,648 ounces).
KGC: 4Q and full-year results highlights (Kinross Gold Presentation)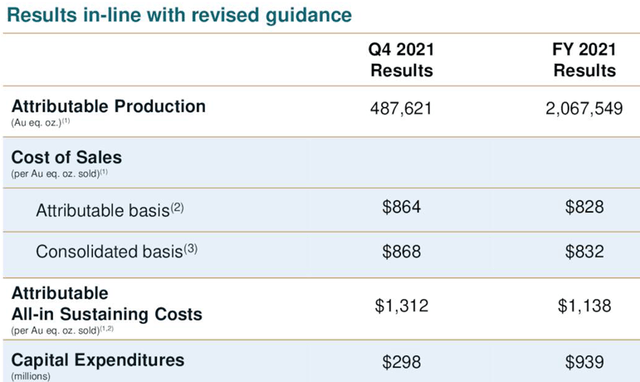
The decline was mainly due to the temporary suspension of milling operations at the Tasiast mine due to a mill fire on June 21, 2021, and proactive mitigation measures on the wall stability issues at Round Mountain in 1Q21. The decrease was partly compensated by increases in production at Fort Knox and Bald Mountain.
The company reported net earnings in 2021 of $221.2 million, or $0.18 per share, compared with $1,342.4 million, or $1.07 per share, in 2020.
For the fourth quarter of 2021, revenues were $879.5 million, with a net loss of $2.7 million or $0.01 per diluted share.
J. Paul Rollinson, President and CEO said in the conference call:
We produced approximately 2.1 million ounces of gold. We reported a net increase of 2.7 million ounces in total reserves. We finalized our agreement with the government of Mauritania, we repaid $500 million of senior notes. We returned $250 million to our shareholders through dividends and share buybacks. We advanced a number of milestones within our project pipeline. And lastly, we announced the addition of a high quality asset to our portfolio with Great Bear.
2 – Stock performance
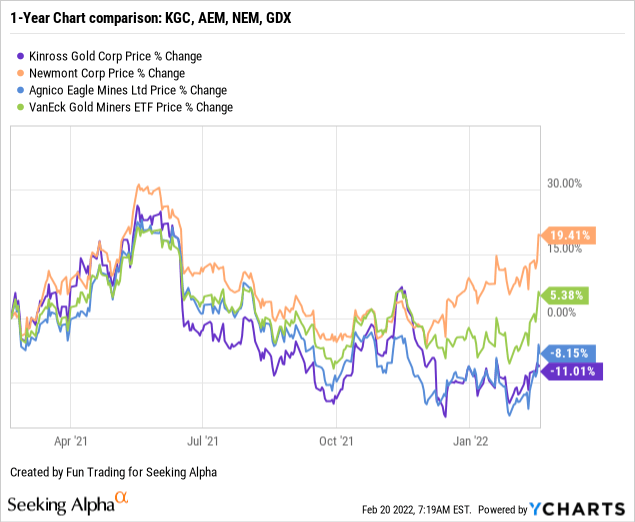
Kinross has underperformed the VanEck Vectors Gold Miners ETF (NYSEARCA:GDX), Newmont Corp. (NYSE:NEM), and Agnico Eagle (NYSE:AEM) on a one-year basis, mainly due to the technical issue at the Tasiast mine. KGC is now down 11% on a one-year basis.
3 – Investment Thesis
The investment thesis has not changed despite this unfortunate incident at Tasiast, and I still recommend accumulating KGC slowly on any weakness and building up a medium position. Future growth is what we should focus on.
One unfortunate characteristic is that KGC has always been a slow-mover that generally drops on lousy news and takes forever to recover. Investors investing in this gold miner need patience, and they know it.
Kinross Gold shows a strong balance sheet even if the debt is increasing.
It is crucial for this type of company to trade short-term LIFO about 40% of your position. It allows you to accumulate on downtrend and profit from any reversal while keeping a core long position that you will keep for a final payday at a much higher price target.
The gold price is going up again and is now $1,900 per ounce, but it is a fragile trend. The market believes that the Fed will not act adequately against the threat of high inflation. However, things are about to change, and the Fed is now ready to hike interest.
Economists at JPMorgan Chase said the Federal Reserve would likely raise interest rates by 25 basis points at each of the future policy meetings until March 2023 in an effort to get soaring inflation under control. That would mean nine consecutive rate increases, to 2.25%, by March next year.
Inflation is a significant concern and could get out of hand, forcing the Fed to act even more drastically. We are talking about 7.50% inflation now. I believe 2.25% a year is vastly insufficient to make any real difference and can be justified only politically. In the end, the Fed will have to be more aggressive. But, the more aggressive, the more negative for gold.
Part II – Kinross Gold – Financials History 4Q21 – The Raw Numbers
| Kinross Gold | 4Q20 | 1Q21 | 2Q21 | 3Q21 | 4Q21 |
| Total Revenues in $ Million | 1,195.1 | 986.5 | 1,000.9 | 862.5 | 879.5 |
| Net Income in $ Million | 783.3 | 149.5 | 119.3 | -44.9 | -2.70 |
| EBITDA $ Million | 1,223.2 | 453.4 | 406.5 | 287.0 | 234.90 |
| EPS diluted in $/share | 0.62 | 0.12 | 0.09 | -0.04 | -0.01 |
| Operating cash flow in $ Million | 681.1 | 279.8 | 388.2 | 269.9 | 197.3 |
| Capital Expenditure in $ Million | 303.2 | 228.1 | 205.4 | 231.0 | 298.0 |
| Free Cash Flow in $ Million | 377.9 | 51.7 | 182.8 | 38.9 | -100.7 |
| Total cash $ Million | 1,210.9 | 1,056.1 | 675.6 | 586.1 | 531.5 |
| Long-term debt in $ Million | 1,924 | 1,925 | 1,427 | 1,429 | 1,630 |
| Shares outstanding (diluted) in Million | 1,269 | 1,269 | 1,270 | 1,261 | 1,255 |
| Quarterly Dividend $/share | 0.03 | 0.03 | 0.03 | 0.03 | 0.03 |
Data Source: Company release and Fun Trading.
* Estimated by Fun Trading
Note: Historical data from 2015 are available for subscribers only.
1 – Gold Production Details For The Fourth Quarter
1.1 Total attributable gold equivalent production
KGC: Chart Gold production history (Fun Trading)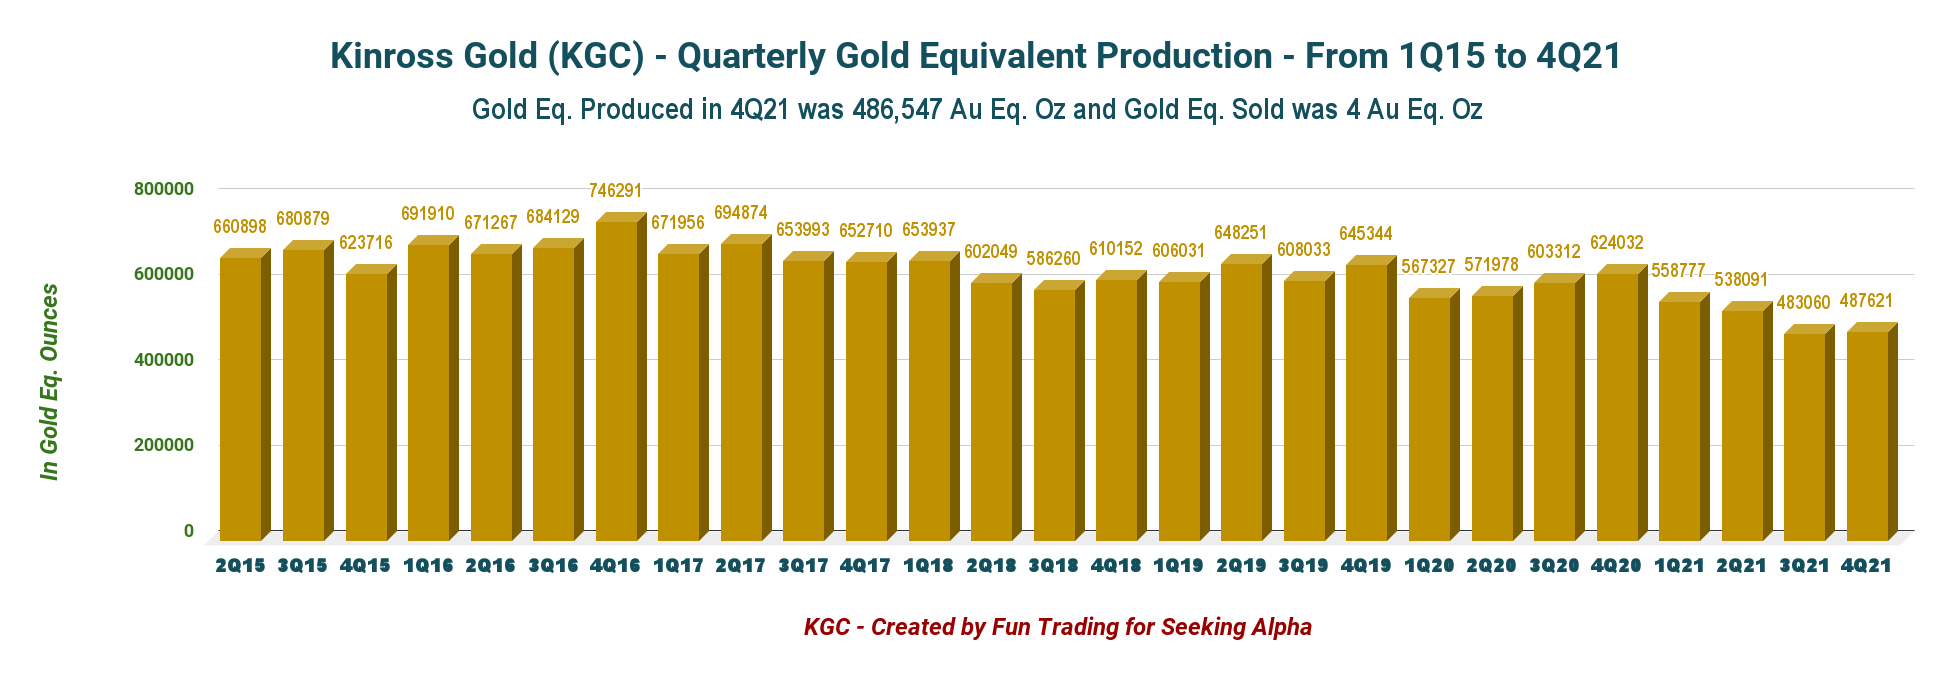
Kinross Gold produced 487,621 attributable Au eq. Oz. in 4Q21, compared with 624,032 Au eq. Oz. in 4Q20.
CEO Paul Rollinson said in the press release:
Looking ahead to 2022, we are well positioned to deliver on our key milestones. The Tasiast mill has periodically reached 21,000 tonnes per day this month, and is on track to reach this level on a sustained basis by the end of this quarter. The La Coipa Restart project is advancing well and is expected to begin producing in the first quarter. The Round Mountain, we have added Phase S to reserves and continue to work through the optimization study.
Round Mountain and Tasiast were the weakest links in 4Q21, as shown in the graph below:
KGC: Chart comparison Production 3Q versus 4Q per mine (Fun Trading)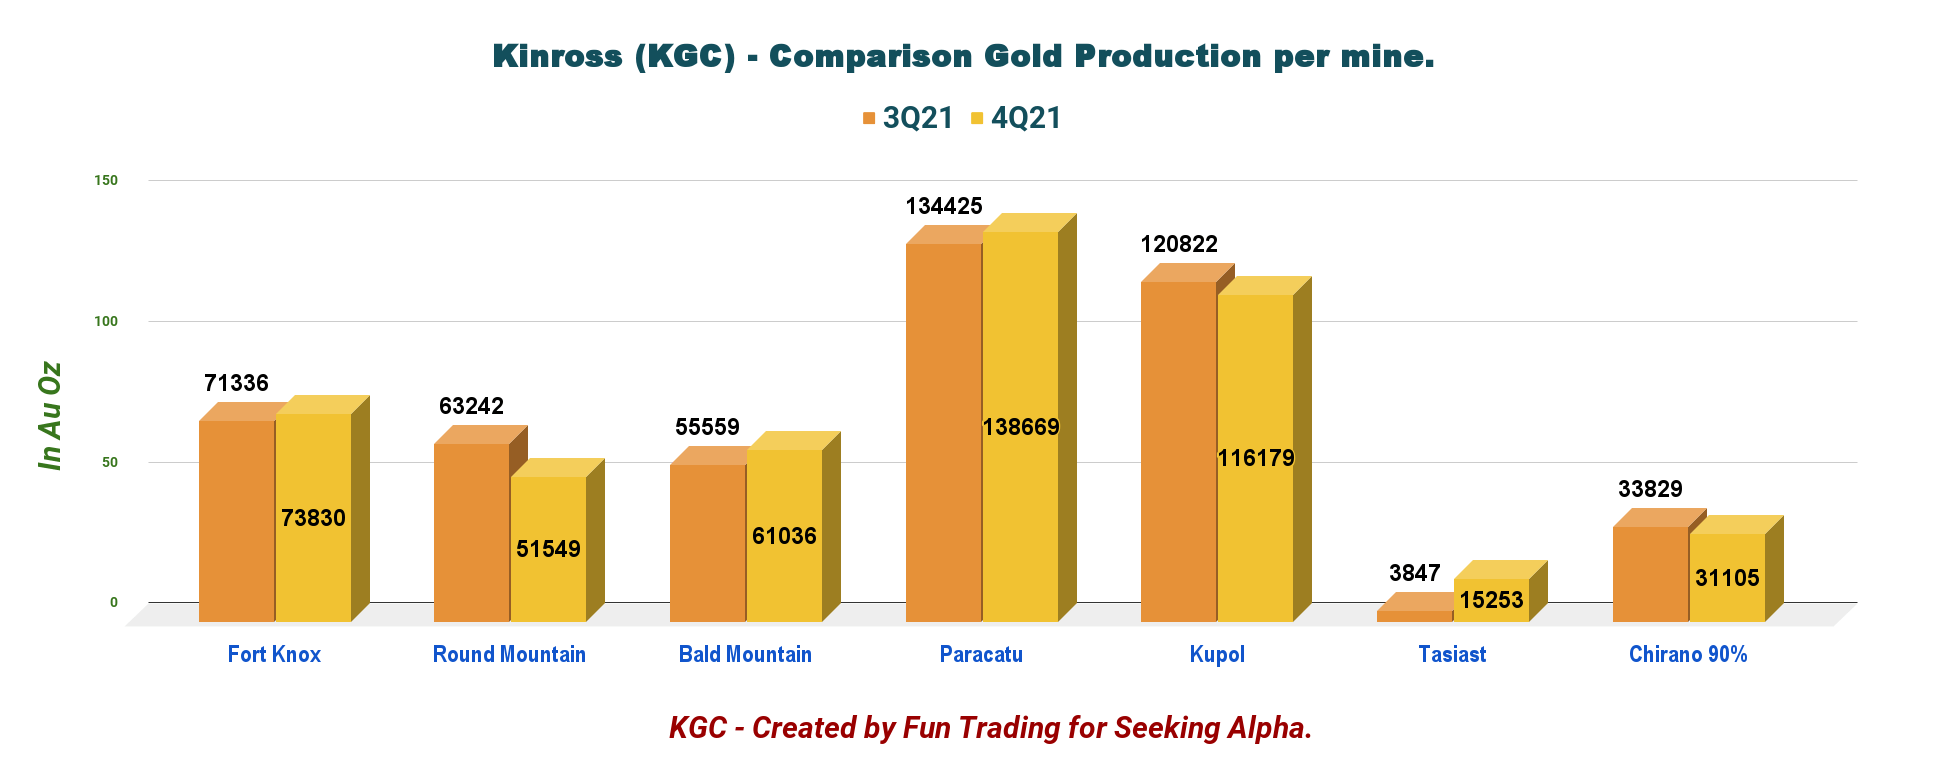
As we can see, Tasiast production is still low.
KGC: Chart production per mine in 4Q (Fun Trading)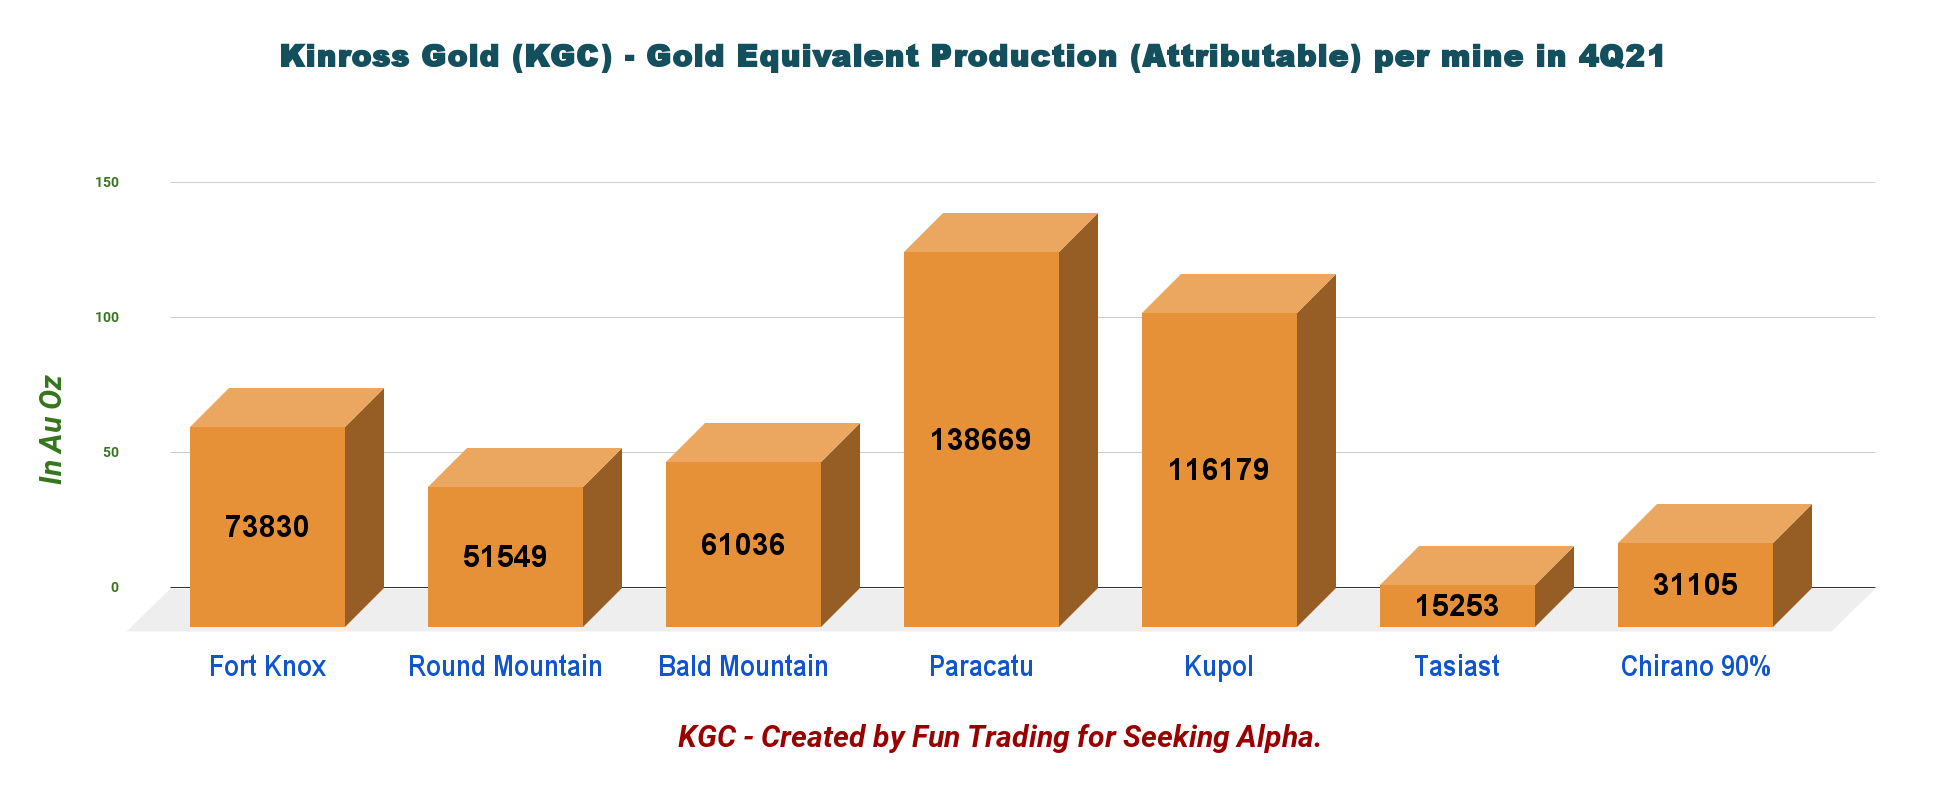
The chart below shows that the AISC is now $1,312 per GEO, up sequentially from $1,069 per ounce. This quarter, the AISC was exceptionally high due to the lower production attributed to Tasiast and Bald Mountain.
KGC: Gold price and AISC (Fun Trading)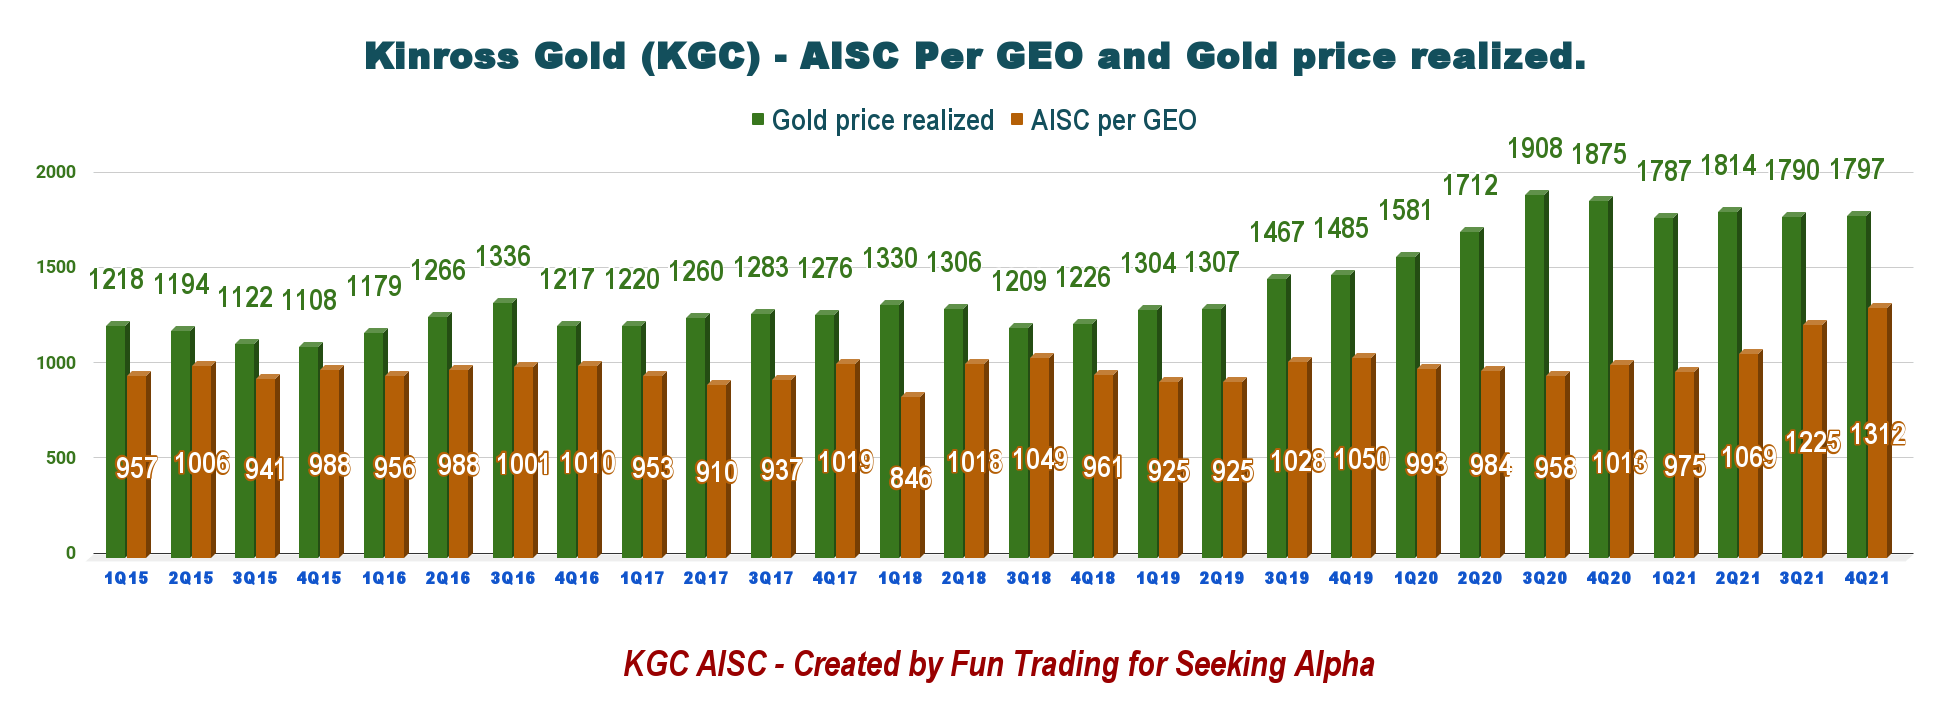
1.2 Proven and probable mineral reserve
Kinross increased proven and probable mineral reserve estimates to 32.6 million Au oz, adding 2.7 million Au oz. in 2021, mainly due to additions at Udinsk and Round Mountain.
1.3 Tasiast is about to deliver again
KGC: Tasiast Presentation (Kinross Gold Presentation)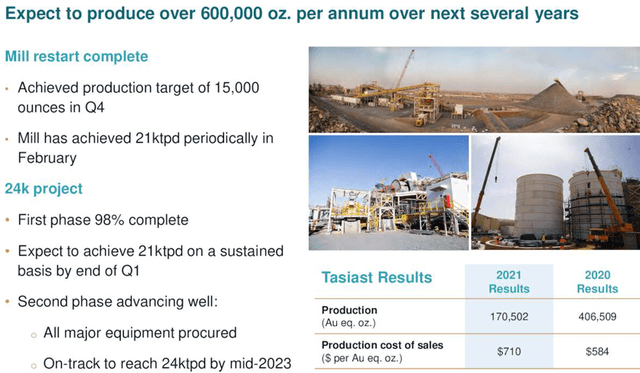
CEO Paul Rollinson said:
We are pleased to report that the Tasiast mill is now operating at sustained throughput levels comparable to the first half of 2021. Our development projects are also advancing well and we have started commissioning at La Coipa. Kinross also successfully added to its mineral reserve estimates, which increased by 2.7 million ounces to 32.6 million gold equivalent ounces at year-end 2021.
2 – Kinross Gold: Financial Analysis
2.1 – Revenues were $879.5 million in 4Q21
KGC: Chart Revenue history (Fun Trading)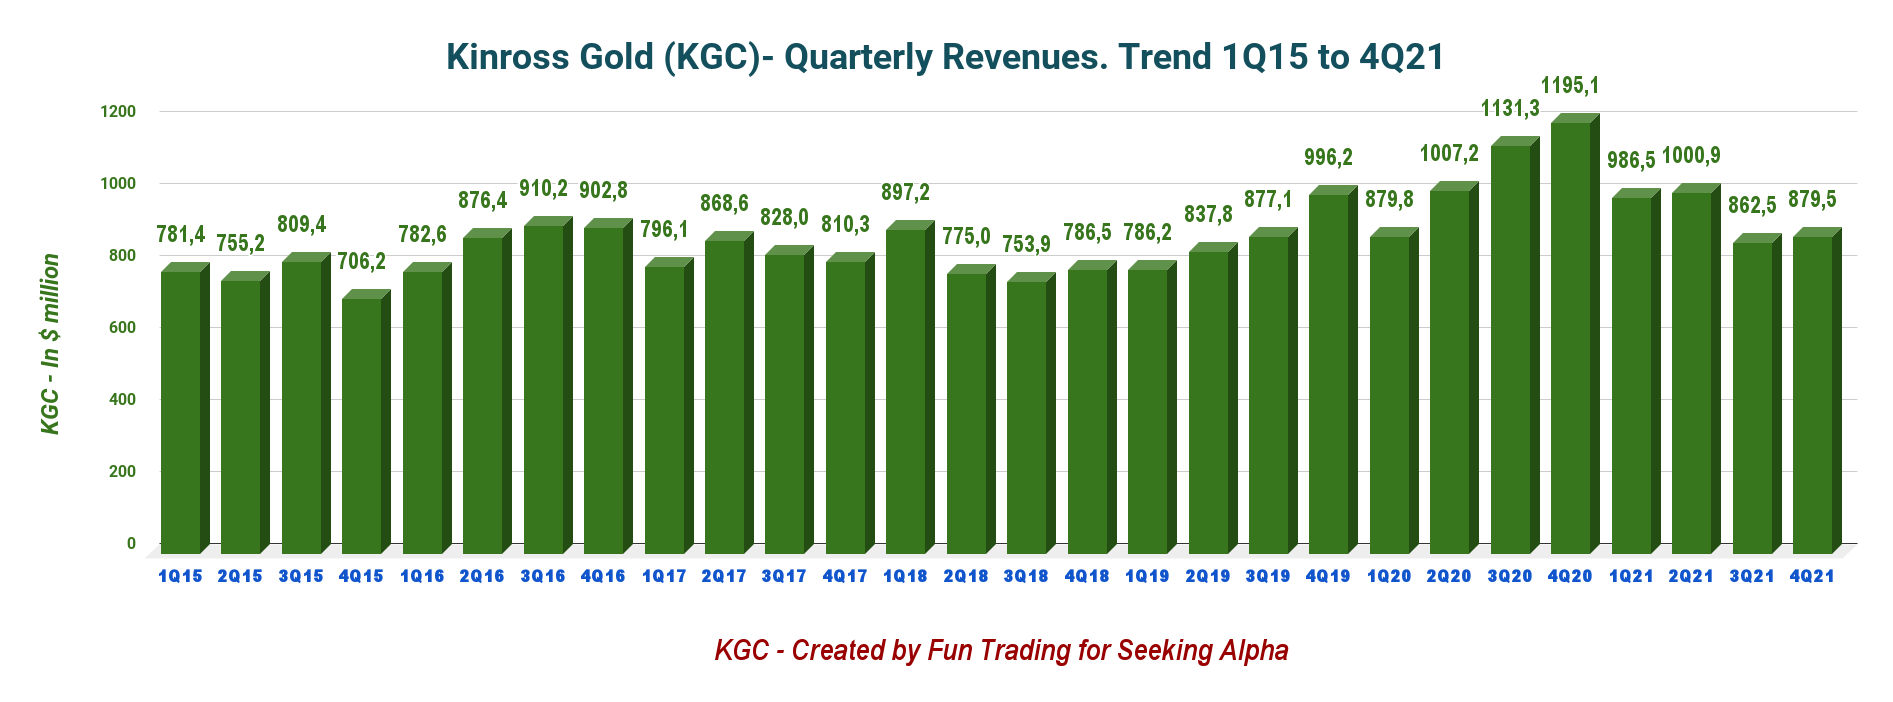
KGC posted a loss of $2.7 million or $0.01 per diluted share in the fourth quarter of 2021 compared to an income of $783.3 million or $0.62 per diluted share in the same quarter a year ago.
The adjusted net earnings were $101.8 million for Q4 2021.
Revenues in 4Q21 decreased 26.4% year-over-year to $879.5 million. As I have explained earlier, the Tasiast mine is the main reason for such low results.
2.2 – Free Cash Flow is a loss of $100.7 million in 4Q21
KGC: Chart Free cash flow history (Fun Trading)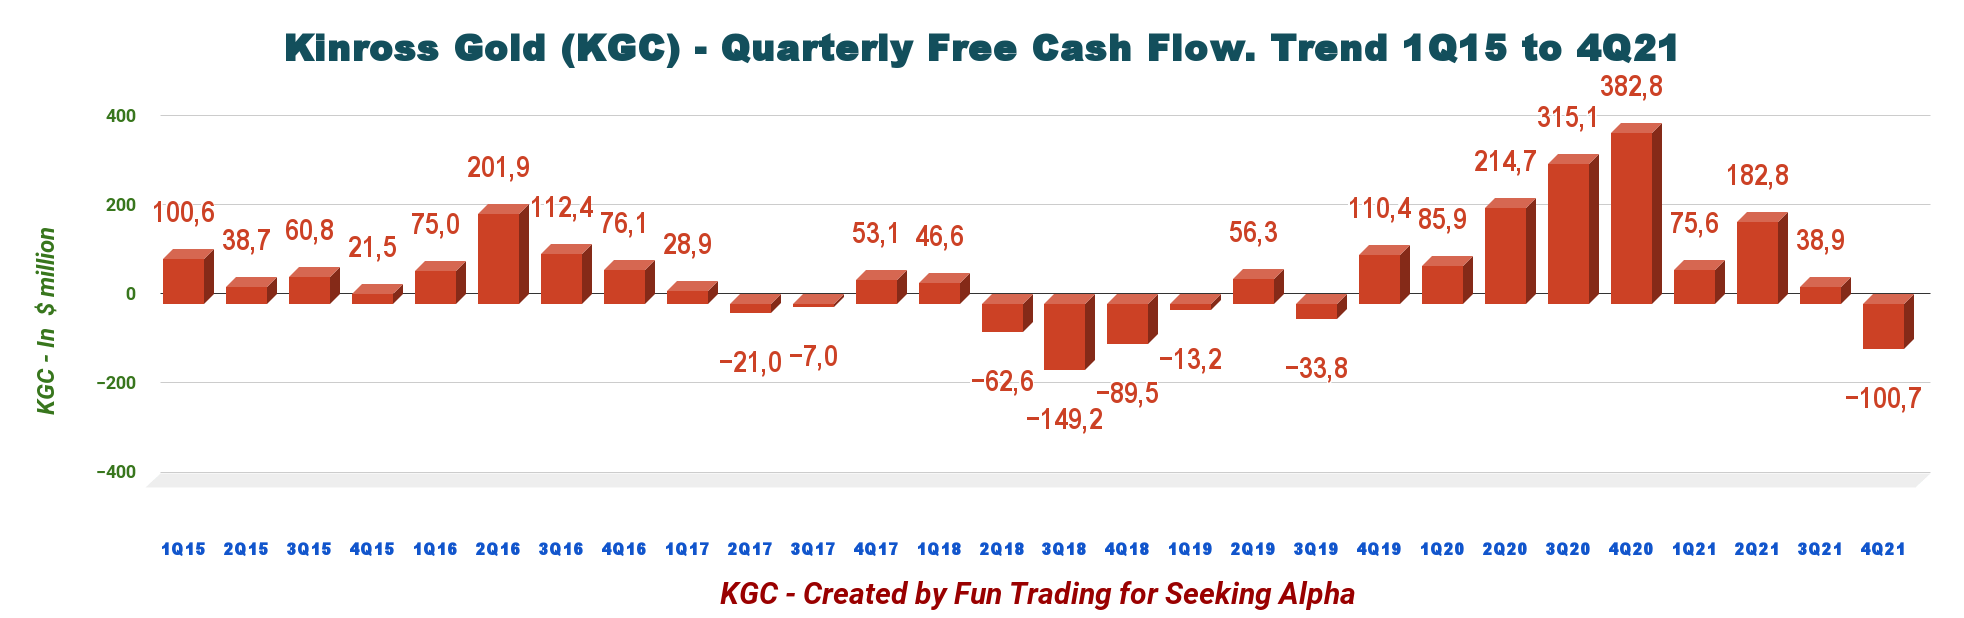
Note: Generic free cash flow is the cash from operations minus CapEx.
Trailing twelve-month free cash flow is $196.6 million. The company had a loss of $100.7 million in 4Q21.
The company pays a quarterly dividend of $0.03 per share or a yield of 2.06%, easily covered by the free cash flow.
Note: Kinross has repurchased and canceled 17.6 million of its common shares for $100.2 million as of December 31, 2021, through its share buyback program. The Company declared a dividend of $0.03 per common share.
2.3 – Net debt and liquidity – Excellent profile but deteriorating sequentially
The net debt jumped sequentially to $1,098.4 million in 4Q21. The company had cash and cash equivalents of $531.5 million, with total liquidity of approximately $1.9 billion, on December 31, 2021.
Note: The Company repaid $500 million in Senior Notes on June 1, 2021.
KGC: Chart Cash versus Debt history (Fun Trading)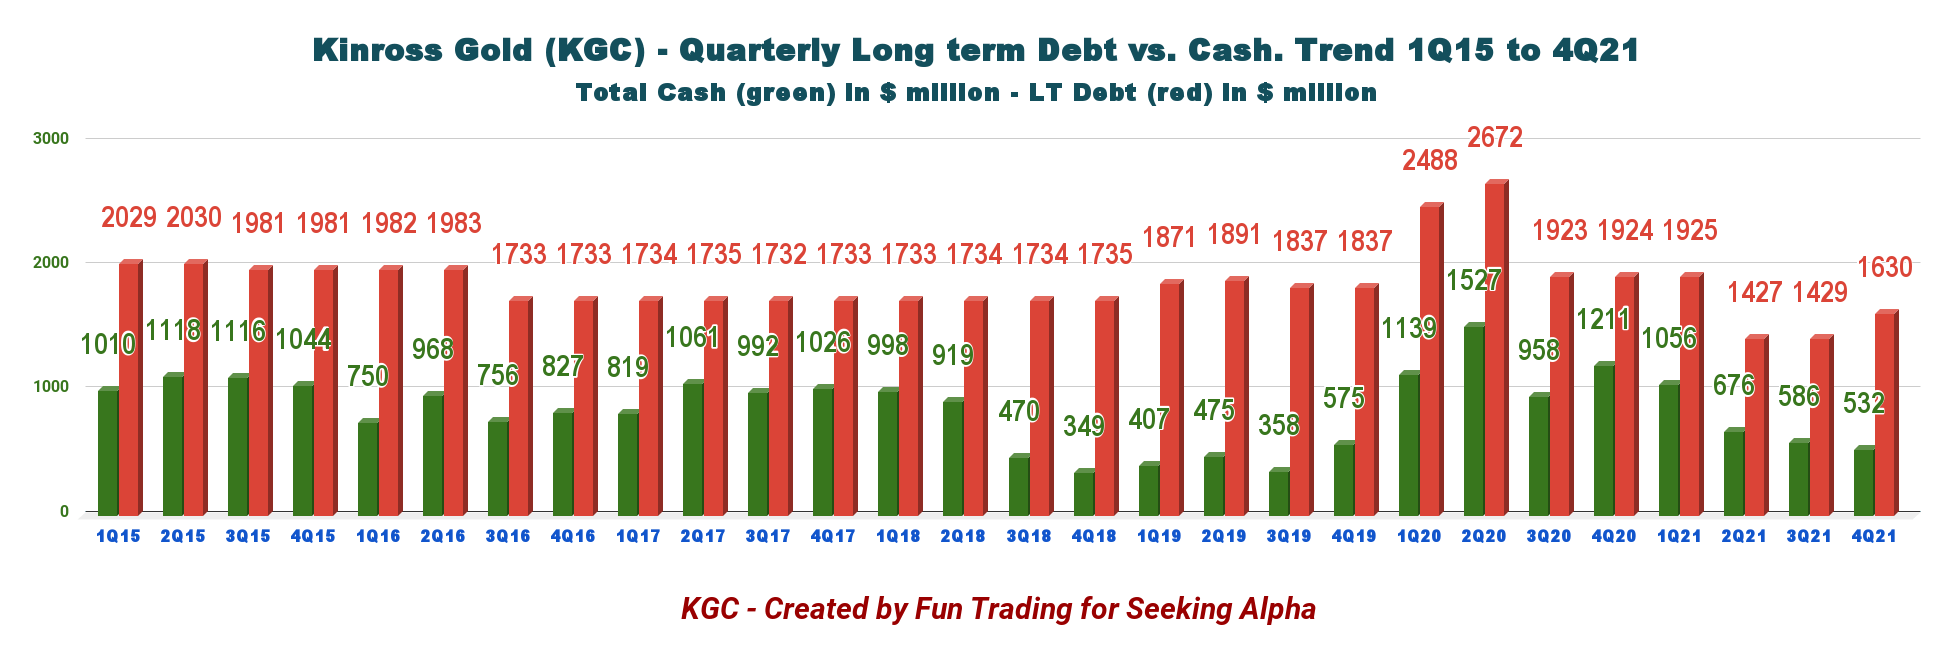
Before spending cash on an elusive buyback program, the company must reduce its debt load. Net debt is increasing, and it is not something that I would like to see in this bullish gold environment.
KGC: Liquidity Presentation (Kinross Gold Presentation)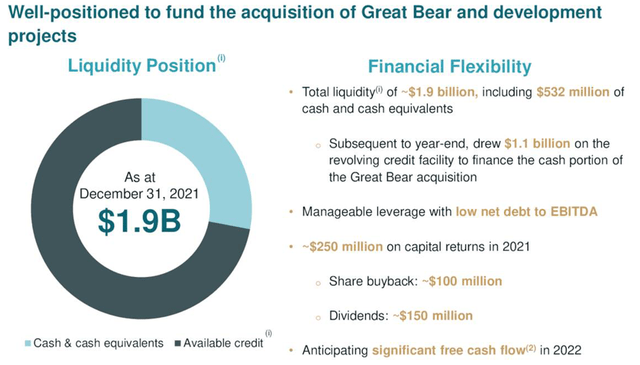
2.4 – 2022-2024 Outlook
Kinross also expects its attributable production to increase 28% year-over-year to 2.65 million Au eq. oz. in 2022, and to further increase to 2.8 million Au eq. oz. in 2023, generating substantial free cash flow growth.
Kinross expects to produce 2.6 million attributable Au eq. oz. in 2024 and an average of at least 2.5 million attributable Au eq. Oz. per year over the remainder of the decade.
KGC: Presentation Outlook (Kinross Gold)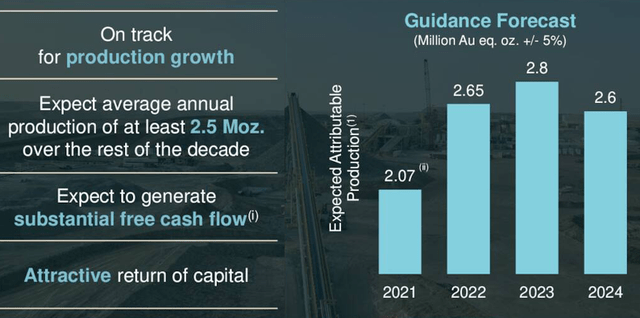
Part III – Technical Analysis and Commentary
KGC: TA Chart (Fun Trading)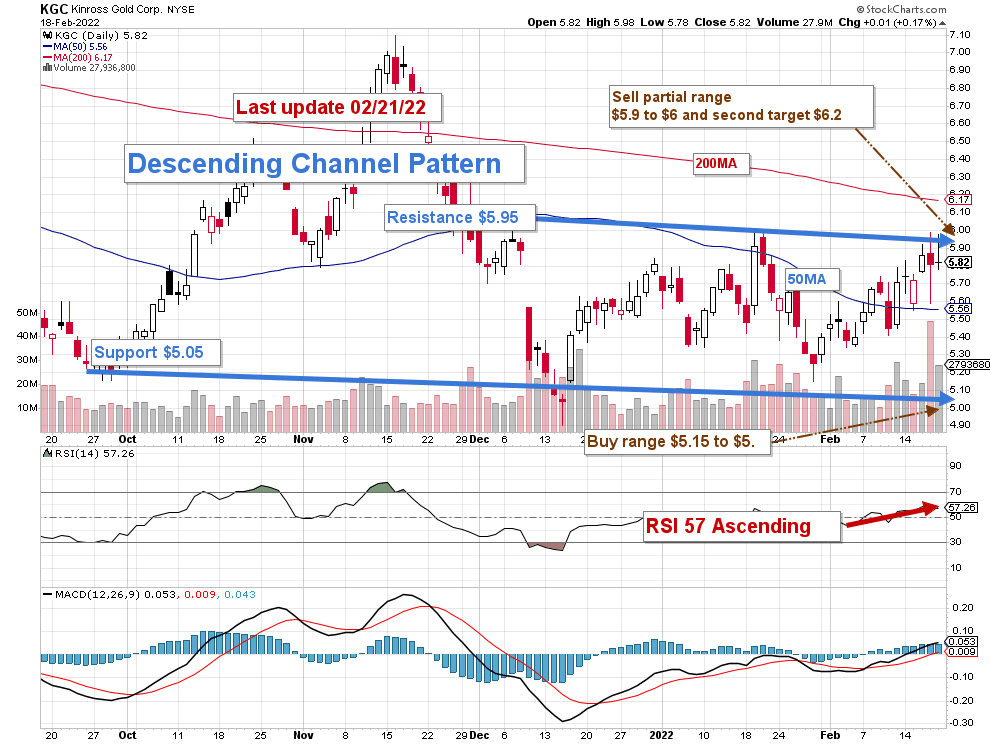
Note: the chart is adjusted for the dividend.
KGC forms a descending channel pattern with resistance at $5.95 and support at $5.05.
I recommend trading short-term LIFO about 30%-40% and keeping a core long-term position for a final target of $7.50-$8.25.
The pattern indicates a persistent bearish sentiment increase despite a recent pattern breakout for gold which may or may not continue depending on the Fed’s action. However, the strong gold reversal ongoing now could help KGC break temporarily, but somehow, I have my doubt.
I suggest selling about 30% of your position between $5.90 and $6.20 and waiting for a clear direction signal. If the gold price continues its ascending trend, KGC could breakout and reach over $7.
If the FED decides to act firmly against inflation by raising the interest rate by 50-point or more in March, I believe the gold price will quickly drop below $1,800 again. In this case, KGC will likely fall between $5 and $4.50, where it is reasonable to accumulate again.
I recommend buying at or below $5.10.
Thus, watch the gold price like a hawk and listen to what Jerome Powell will have to say on March 3.
Warning: The TA chart must be updated frequently to be relevant. It is what I am doing in my stock tracker. The chart above has a possible validity of about a week. Remember, the TA chart is a tool only to help you adopt the right strategy. It is not a way to foresee the future. No one and nothing can.
Author’s note: If you find value in this article and would like to encourage such continued efforts, please click the “Like” button below as a vote of support. Thanks!
Be the first to comment