

da-kuk
KraneShares Bosera MSCI China A 50 Connect Index ETF (NYSEARCA:KBA) is an exchange-traded fund that provides investors with exposure to 50 of the largest equity securities in China’s mainland markets. The fund’s benchmark index is the MSCI China A 50 Connect Index. The expense ratio of the fund, as reported by KraneShares, is 0.56%. That is relatively expensive, but not surprisingly high given its geographical focus on China. Net assets under management were $580 million as of December 9, 2022, making the fund relatively popular given its specificity.
Net fund flows into KBA have been positive over the past year, albeit subject to change, at +$101 million.
ETFDB.com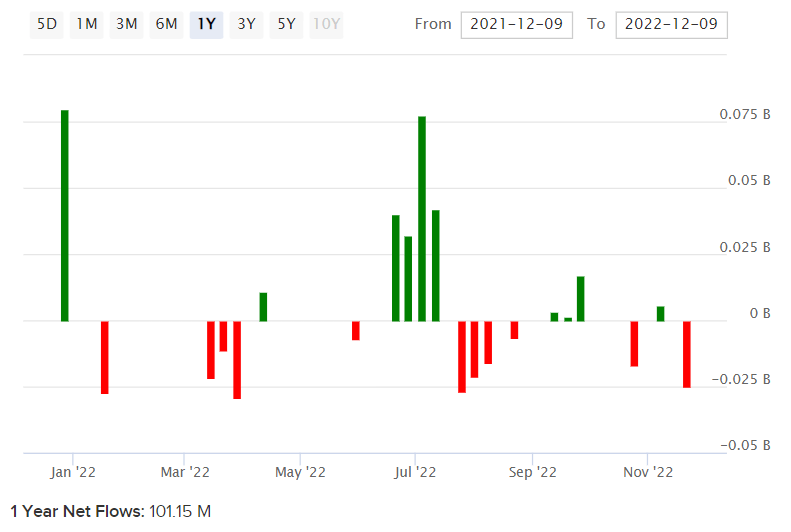
Meanwhile, KBA shares have fallen in line with broader equity markets. Chinese equities are generally viewed as riskier than Western equity markets given perceived political risk, and the fact that China is still considered by many as an emerging market. The chart below reveals KBA’s poor performance in general since the fund’s inception in March 2014.
TradingView.com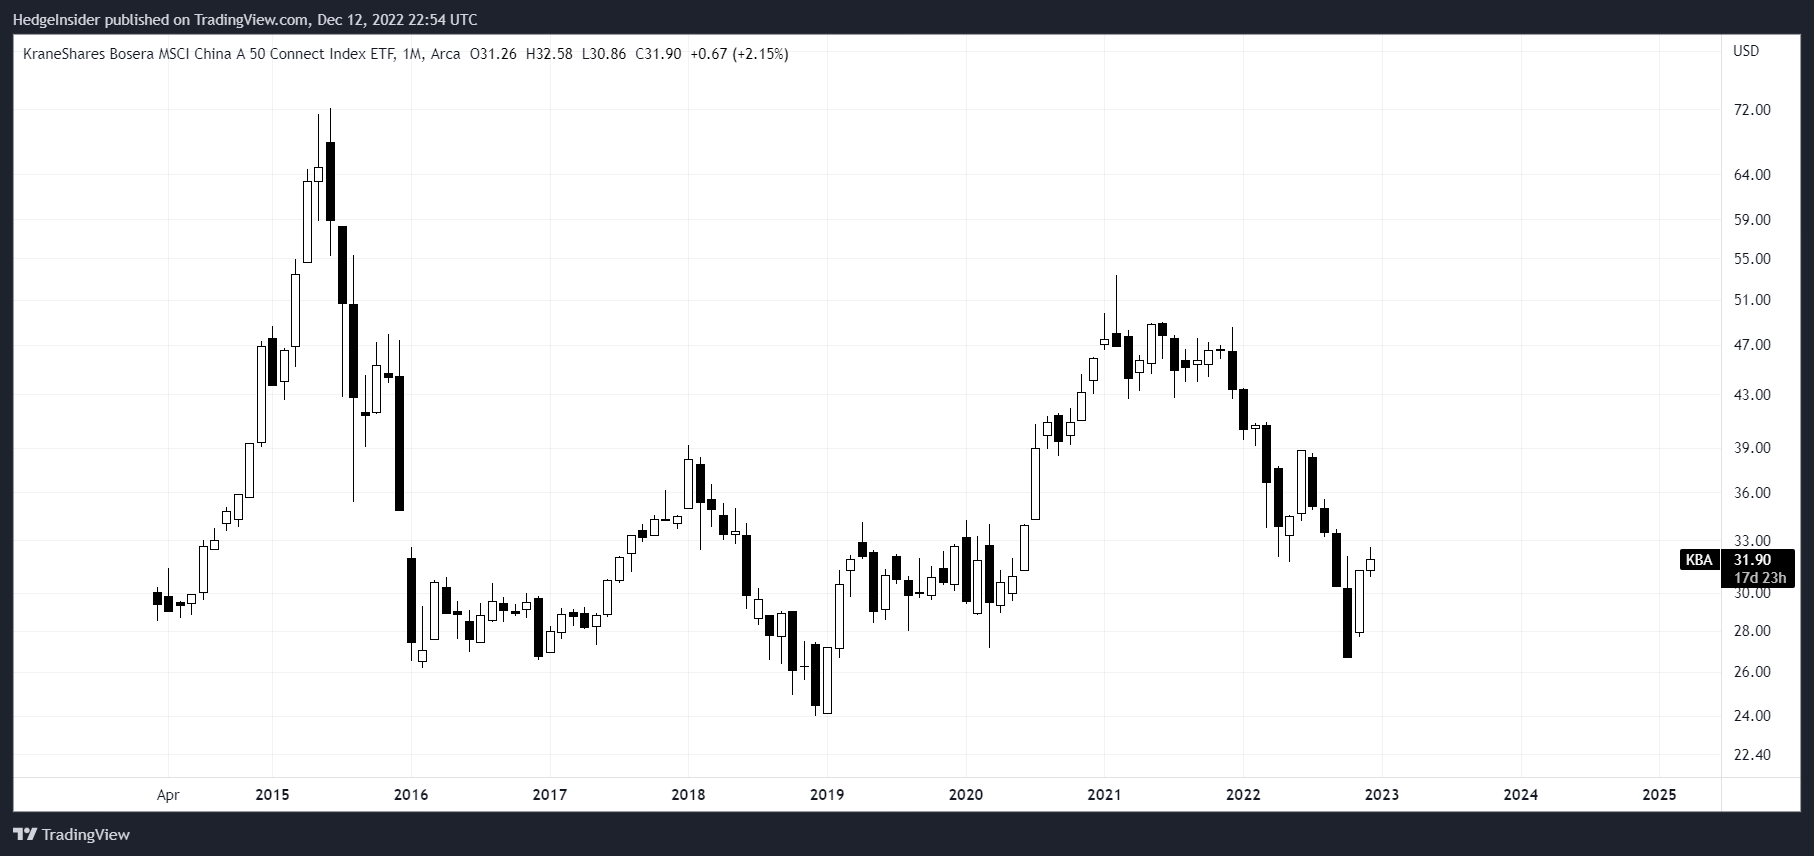
Simply to return to the fund’s 2021 share price highs, KBA would need to rise by approximately two-thirds (or 67%) at the time of writing.
As a U.S. investor, one might at least briefly wish to compare the fund’s share price with the S&P 500 U.S. equity index level (a common benchmark). This comparison (see below) illustrates KBA’s long-term under-performance. Nevertheless, under-performance is not set in stone; history may not repeat.
TradingView.com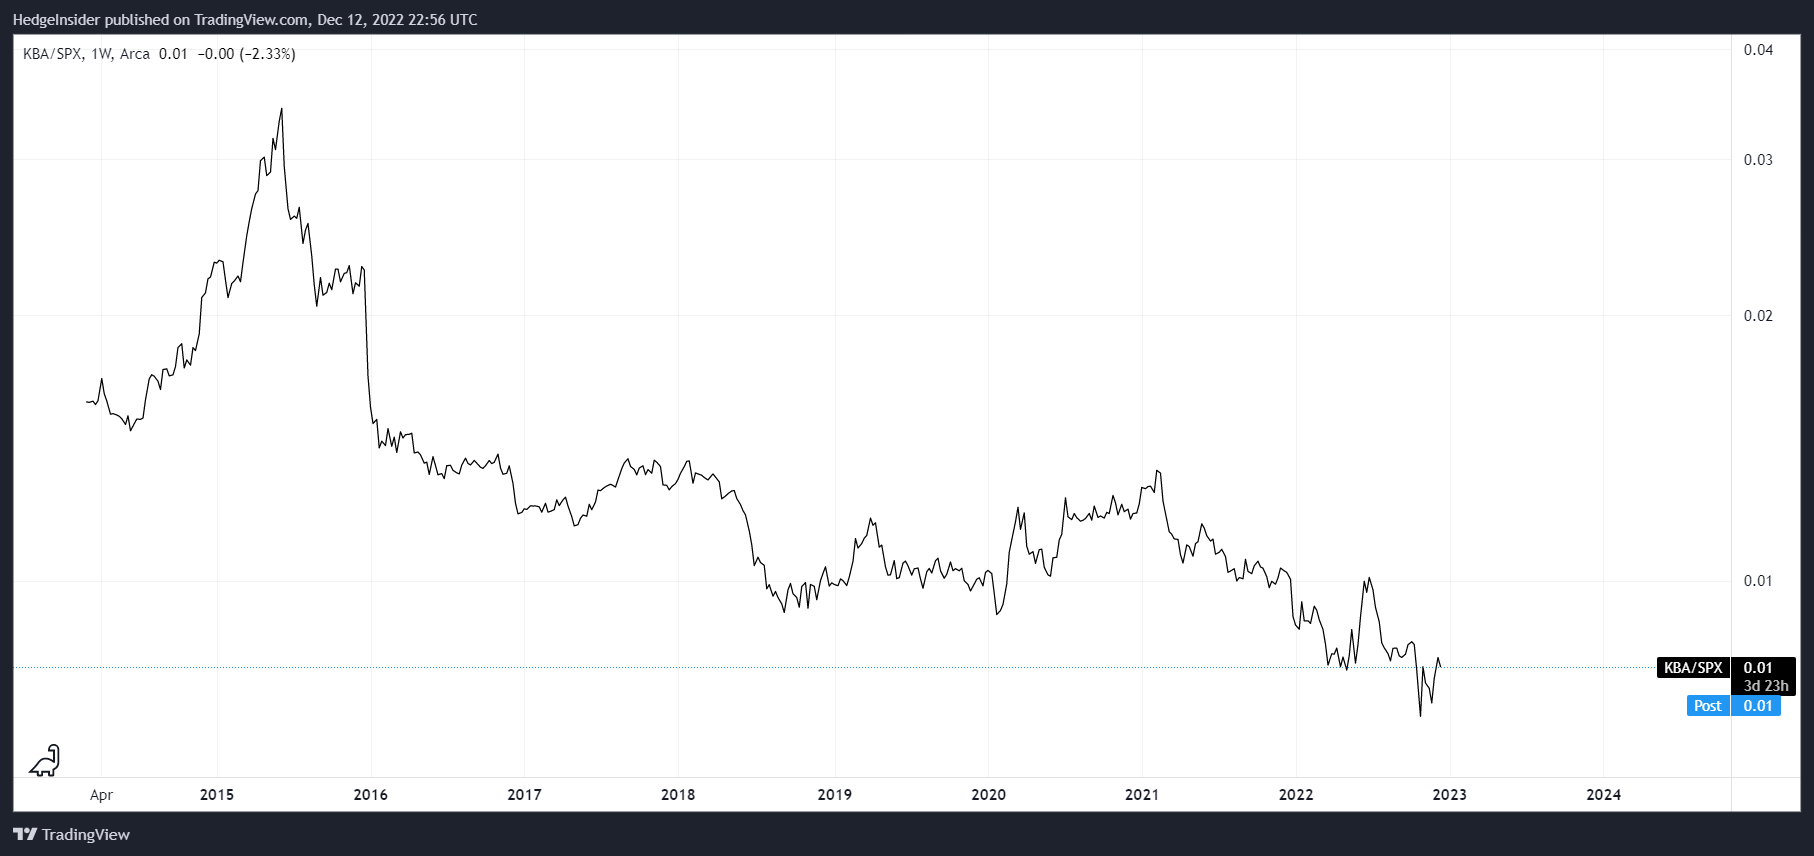
Personally, I would think the biggest risk to be political. China is run in a quasi-communistic fashion, and the risk will always be that the country becomes more communist (read: less capitalist) with harsher regulatory standards, with larger companies in China (which KBA invests in) potentially finding themselves disproportionately exposed to these harsher controls. You also have the risk of war and geopolitical tensions with Taiwan; however, risks of war are more abstract and contentious. One could argue it is not probable that China will go to war with Taiwan, rather the mere thought of its possibility is likely to hold down Chinese equity valuations. That is, together with broader political risks.
On the other hand, as Chinese equities are viewed as riskier, usually it is during bull markets that even political risks melt away somewhat, as capital flows internationally seek higher yield. So, whatever equity risk premiums are today (when the world is facing a generally recessionary phase; see below), they are likely to contract into the next global equity bull market. Thus, Chinese equity valuations might well improve (“as the tide lifts all boats”).
Fidelity.com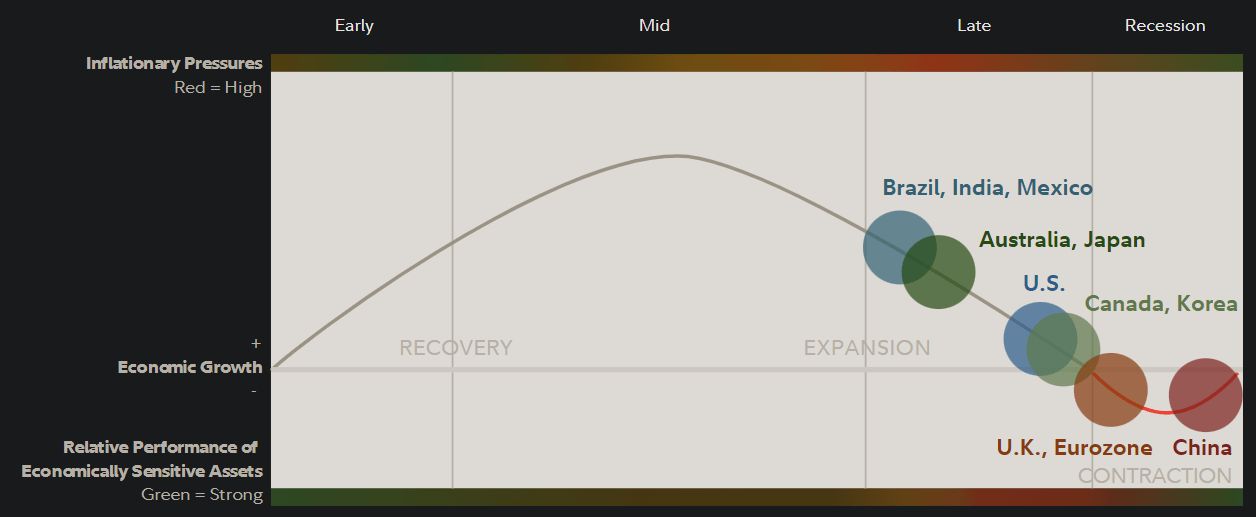
The most recent factsheet for KBA’s benchmark can be used a proxy for KBA’s current position, which reveals trailing and forward price/earnings ratios of 12.93x and 11.63x, respectively, and a price/book ratio of 2.06x (as of November 30, 2022). The factsheet also includes an indicative dividend yield of 2.28%. These numbers collectively imply a forward return on equity of 17.71% (which is strong), and a distribution rate of profits into dividends of circa 30%. Assuming a Chinese 10-year yield 2.938% (the current yield at the time of writing), I estimate a forward IRR for KBA of approximately 16%.
Author’s Calculations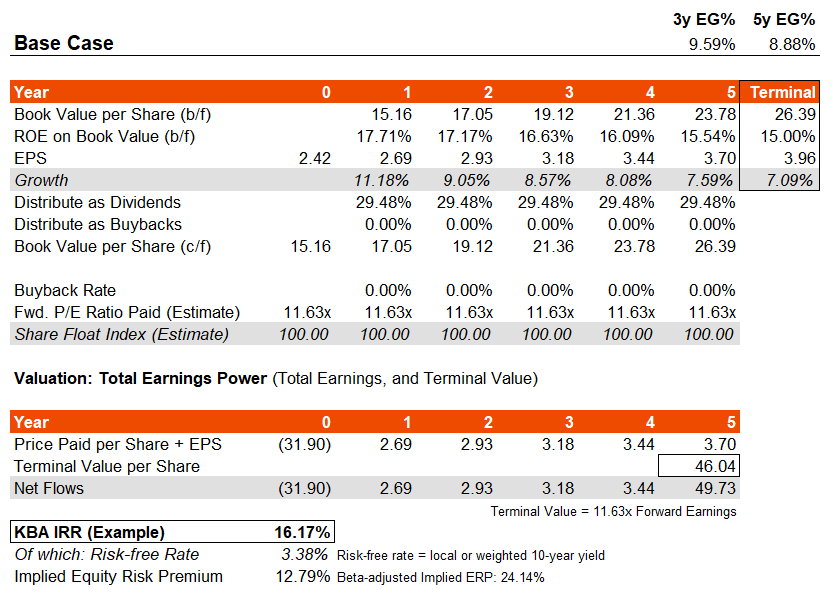
That assumes that the return on equity will gradually fall to 15% by year six, and the forward price/earnings ratio will hold constant. My three- to five-year earnings growth assumption in this view is approximately 9-10% (see top-right of the chart above), which is below the prevailing consensus estimate from Morningstar currently available for KBA of 12.71%.
The beta-adjusted ERP is higher because the five-year historical beta of KBA is low (almost 0.5x). This does not reflect the real risk of investing in the fund or Chinese equities. Actually, a country risk premium estimate from Professor Damodaran suggests Chinese equities should carry elevated ERPs of at least 70 basis points over mature markets like the United States (which itself might carry an ERP of circa 4.2-5.5%, depending on the market regime). If we assume that China deserves an ERP of 5.5% plus 0.70%, that takes us to 6.2%, and if we add in the 10-year of 3.38% (as a risk-free rate proxy), that takes us to a cost of equity of 9.58%. You could argue that the country’s risk has increased further, and deserves a higher country risk premium. However, it would seem to me that KBA is definitely undervalued.
With an IRR of over 16% (including all underlying earnings power), you could argue that 60% upside is possible on valuation alone (if the market were to adjust). Sharp upside might be possible into the next business cycle. However, Russian equities contemporarily showed us the power of political risk once it is realized. Under no circumstances would I recommend Chinese equities for a large position; however, I think they are attractively valued if one were to invest as part of a larger portfolio. Frankly, I would not recommend a position more than 5% of one’s portfolio. Still, given the cheapness of the valuation, I think investors in KBA will probably do well in the next business/market cycle.
Be the first to comment