


Daniel Balakov
Author’s note: This article was released to CEF/ETF Income Laboratory members on September 26th.
A reader brought to my attention the Invesco S&P 500 Equal Weight Energy ETF (NYSEARCA:RYE), a, well, S&P 500 equal weight energy index ETF.
RYE provides investors with diversified exposure to the U.S. energy industry, and is a reasonable investment opportunity for energy bulls. RYE does not significantly differ from the Energy Select Sector SPDR ETF (XLE), the industry benchmark, in most areas, including holdings and performance. RYE is somewhat more expensive, with a 0.40% expense ratio, versus 0.11% for XLE. As RYE does not significantly differ from XLE, but is quite a bit more expensive, I would not be investing in the fund at the present time.
RYE – Basics
- Investment Manager: Invesco
- Underlying Index: S&P 500 Equal Weight Energy Plus Index
- Dividend Yield: 4.06%
- Expense Ratio: 0.40%
- Total Returns CAGR 10Y: 1.71%
RYE – Quick Overview
RYE is an S&P 500 equal weight energy index ETF, tracking the S&P 500 Equal Weight Energy Plus Index. The index invests in the largest 22 U.S. energy companies or in all S&P 500 energy components, whichever group is largest. As with most indexes, there is a basic set of inclusion criteria, centered on liquidity, size, and the like, and rules and caps meant to ensure diversification while minimizing turnover. It seems like a sensible index, and specifically structured to ensure some diversification in a relatively undiversified industry.
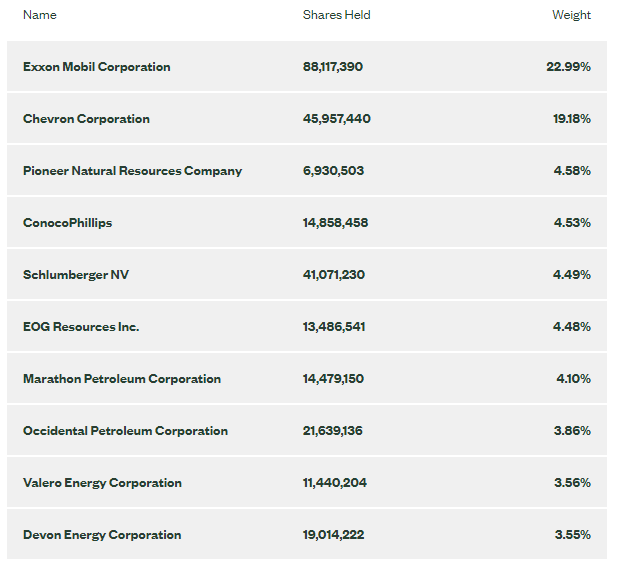
RYE’s holdings include well-known energy titans like Exxon (XOM) and Chevron (CVX), as well as smaller companies, including Targa Resources Corp. (TRGP), and APA Corporation (APA). RYE focuses on large-caps, with smaller investments in mid-caps, and no current investments in small-caps. Allocations are as follows.
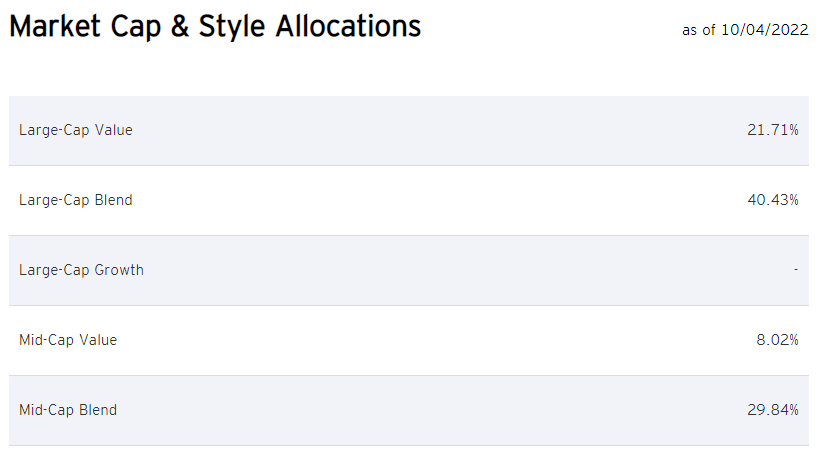
RYE
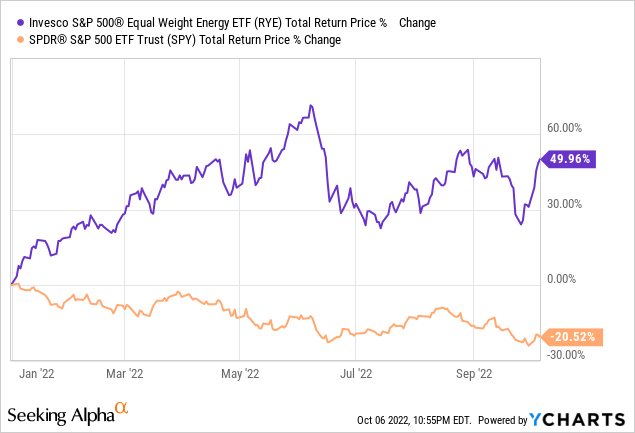
RYE provides investors with diversified exposure to U.S. energy stocks. These stocks have benefitted from rising oil prices, significantly outperforming YTD.
Oil prices remain high, which should boost growth further. As per J.P. Morgan, U.S. energy stocks are expected to grow their earnings by 28.7% in the next twelve months, higher than all industries, and almost three times the S&P 500 growth average of 9.6%.
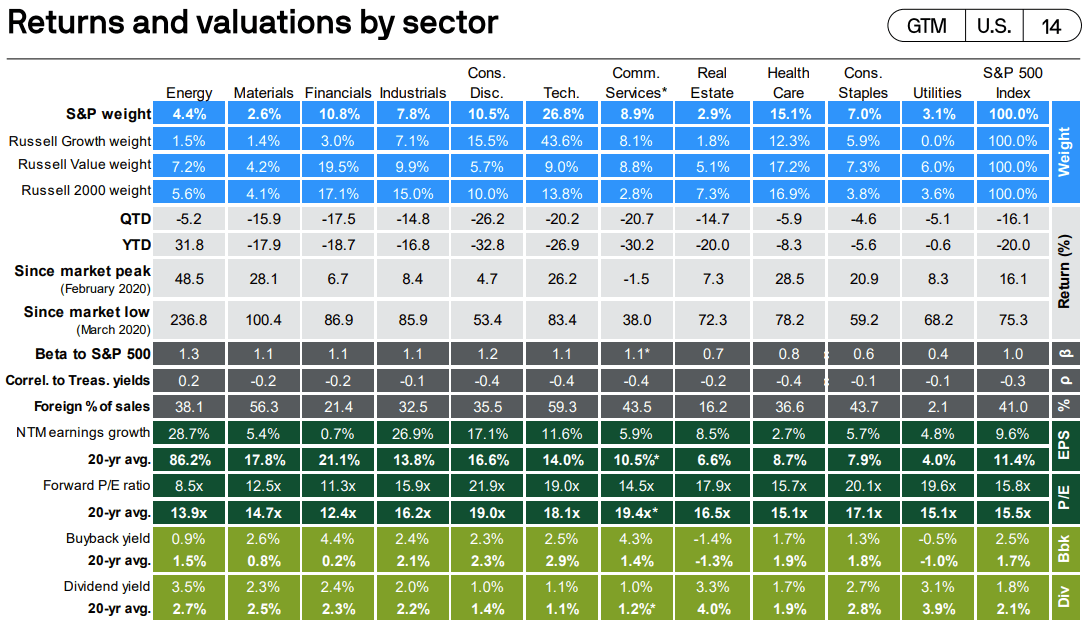
J.P. Morgan Guide to the Markets
Even as growth skyrockets, valuations remain soft. As per J.P. Morgan, energy is the most cheaply valued industry in U.S. equity markets, and by quite a large margin. RYE itself sports a PE ratio of 8.2x and a PB ratio of 2.6x, both lower figures than those of the S&P 500.
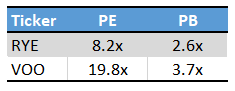
Fund Filings – Chart by author
RYE’s investment thesis is quite simple: the fund offers investors diversified exposure to the U.S. energy industry, which is cheaply valued, growing fast, and has outperformed YTD. Although it is a strong investment thesis, several funds offer investors a similar value proposition, including XLE. Although RYE’s investment thesis seems clear and strong enough, it does not seem like the fund offers any value or benefits relative to XLE, while costing quite a bit more. Under these conditions, an investment in RYE is difficult to justify.
Let’s compare these two funds in more depth.
RYE versus XLE – Holdings
RYE and XLE both offer investors diversified exposure to the U.S. energy industry.
RYE currently invests in the largest 23 U.S. energy companies.
XLE invests in all S&P 500 energy components, currently 21 companies in total.
RYE currently invests in two more companies than XLE. RYE’s index construction ensures that the fund will always have an equal or larger number of holdings than XLE. As such, RYE is a slightly more diversified fund than XLE, but the difference is very small, any things considered. Both funds have almost completely overlapping holdings, with few differences.
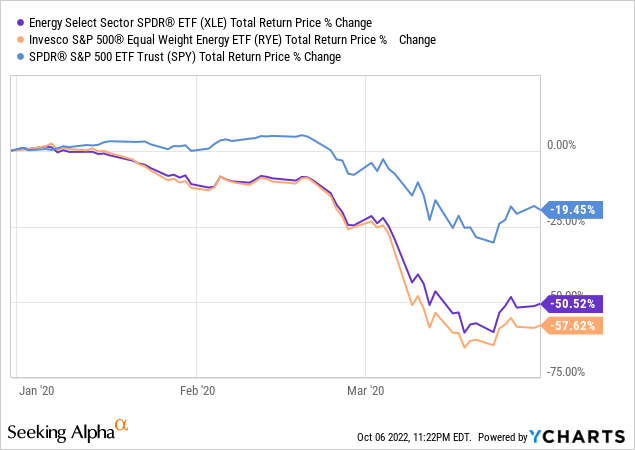
XLE
Exxon and Chevron are relatively strong, resilient energy companies, and so tend to outperform the industry during downturns and recessions, as should XLE. The fund outperformed relative to RYE during 1Q2020, the most recent downturns, as expected. Both funds significantly underperformed relative to the S&P 500, however.
Besides the above, there are few differences between the holdings of RYE and XLE. Both funds offer diversified exposure to U.S. energy stocks, hold more or less the same basket of stocks, and have broadly similar security weights in their portfolios.
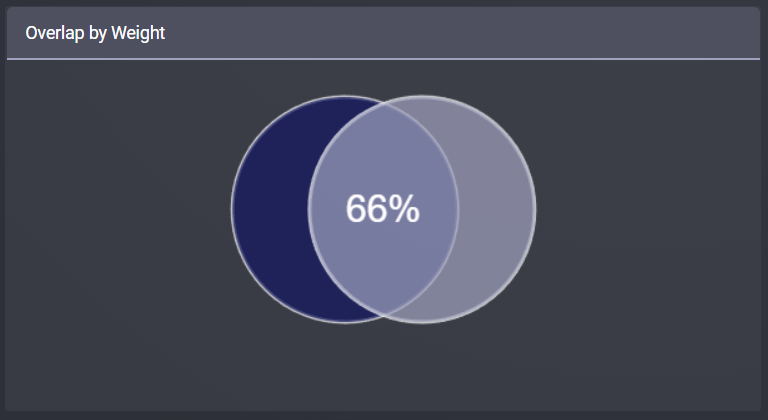
Etfrc.com
Although weights do differ in some cases, these differences are mostly of little consequence to the fund and their investors. Energy stocks are highly correlated, and all are strongly dependent on energy prices, so all energy portfolios and securities perform similarly.
RYE versus XLE – Performance
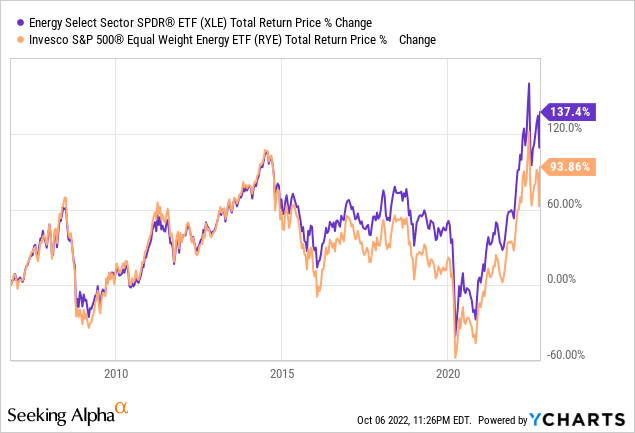
RYE and XLE are very similar funds, with similar strategies, portfolios, holdings, and weights. Performance should be quite similar too, as is generally the case. Both funds have, for instance, performed almost identically for the past five years. The graph is striking.
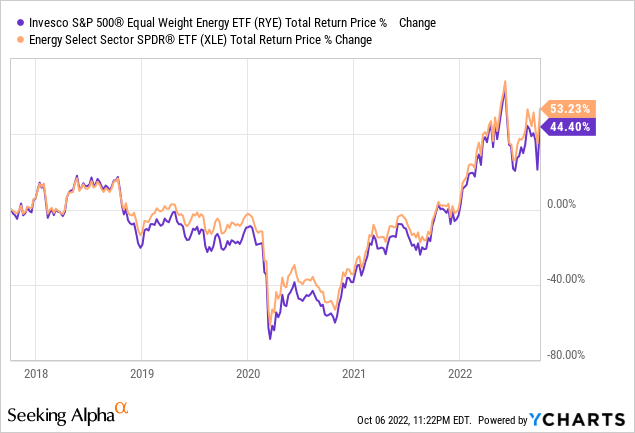
There have been, however, a couple periods of time during which the performance between these two funds moderately differs. As an example, XLE outperformed from early 2017 to early 2020, as Chevron significantly outperformed the market during the same.
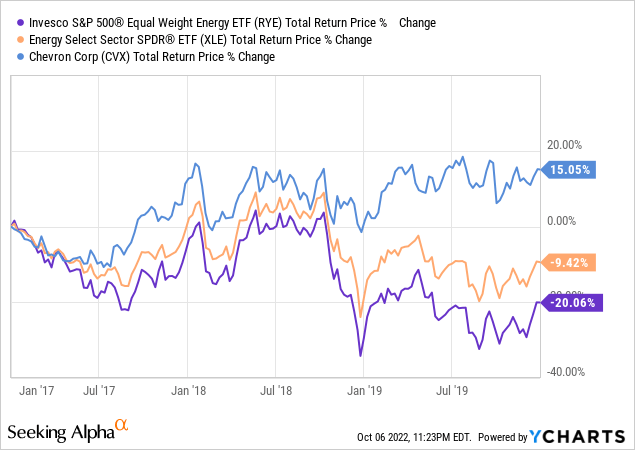
XLE has moderately outperformed relative to RYE since inception but, from what I’ve seen, outperformance is concentrated in a couple time periods. Meaning, XLE does not consistently outperform relative to RYE.
RYE and XLE have broadly similar performance track-records, although XLE’s is a bit stronger in this regard.
RYE versus XLE – Dividend Yield and Growth
RYE’s 4.1% dividend yield is slightly higher than XLE’s 3.8% yield. XLE yields a bit less due to being overweight Exxon and Chevron, both of which sport below-average yields. RYE’s higher dividend yield is a relatively small benefit for the fund and its shareholders, but a benefit nonetheless.
Both funds have reasonably strong dividend growth track-records, with CAGR of almost 10% for the past decade. Growth is accelerating, with both funds seeing +40% dividend growth these past twelve months. RYE’s dividends jumped over 30% last quarter alone, a significant rate of growth, but one which could simply be due to normal ETF dividend volatility. RYE’s dividend growth track-record is stronger if the latest hikes are sustainable, lower if not / if these were due to volatility.
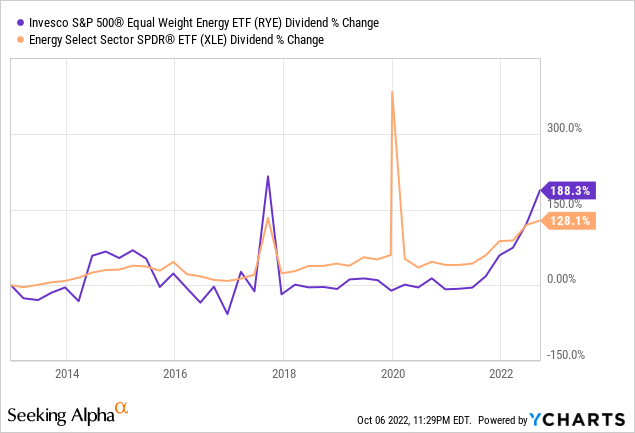
In any case, both funds have similar yields, and similar dividend growth track-records.
RYE versus XLE – Expense Ratio
RYE is a relatively expensive fund, with a 0.40% expense ratio. Although it is not an incredibly high expense ratio on an absolute basis, it is higher than average for a simple index equity fund, and higher than XLE’s 0.11% expense ratio.
RYE’s high expense ratio directly reduces shareholders returns, and is a negative for the fund and its shareholders.
In my opinion, RYE’s high expense ratio acts as something of a tiebreaker between RYE and XLE. Both funds are incredibly similar, with broadly similar strategies, portfolios, holdings, and weights. There are simply not that many differences between the funds, and what differences do exist do not make one fund clearly superior to the other. As the two funds are very similar, I think choosing the cheapest one to be the most sensible option, and that means choosing XLE over RYE.
Conclusion
RYE offers investors diversified exposure to the U.S. energy industry. Although there is nothing inherently wrong with the fund, it does not significantly differ from XLE on most important metrics, but is quite a bit more expensive. As such, I would not be investing in the fund at the present time.
Be the first to comment