

A&J Fotos/iStock via Getty Images
Introduction
My first Seeking Alpha note on Johnson Outdoors Inc (NASDAQ:JOUT) was published in late November 2022. Roll forward to early January 2023, and JOUT’s price has subsequently increased by a very healthy ~23%. I refer readers unfamiliar with JOUT to my November 2022 article for detailed background information regarding the company, along with analysis that resulted in a BUY rating based on a price of around $55 per share. In this note, I discuss interesting issues raised in JOUT’s 4Q22 results materials and consider whether or not the stock is still deserving of a BUY rating having rallied to $67.85 (NASDAQ close 06 January 2023).
Longer-term Trends – Operating Margins & Sales Growth
In Table 1, I set out the average sales growth rate per annum over the 3-, 10-, and 15-year periods to FY22. At the total group level, longer-term sales growth rates of around 4% pa to 6% pa are solid but not overly exciting (particularly for a small-cap stock). The Covid-boom effect is apparent in the 3-years column. It should be noted that the Covid-boom period has also dragged up the average growth rates for the 10-years and 15-years metrics. If group sales had grown by 6% pa in the three years to FY22, then the longer-term growth rates would have been 3% pa (15-years average) to 5% pa (10-years average); we might therefore conclude that the Covid-boom effect has added ~1% pa to JOUT’s longer-term sales growth metrics as measured at FY22.
Table 1:
Source: Created by author using data from JOUT quarterly reports.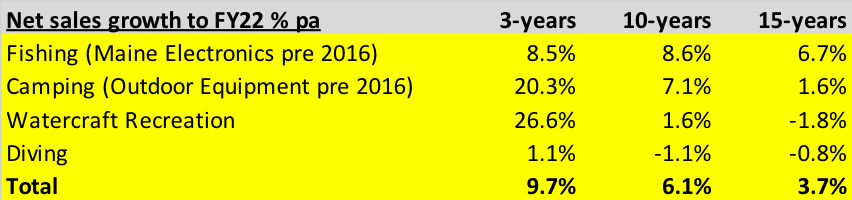
Whilst JOUT’s sales growth track record isn’t all that impressive, it is important to look beyond the top line. At the operating profit level, JOUT has delivered longer-term growth rates of ~8% pa on a 15-years average basis and ~12% pa on a 10-years average basis. Operating profit margin expansion has been facilitated by lower expense rates (as a % of net sales) for administration, IT and marketing/selling costs. In terms of providing support to the sustainability of earnings, it is comforting that JOUT hasn’t reduced research and development expenditure (as a % of net sales) in order to drive margin expansion.
Gross Profit Margin Boosted By Covid
Chart 1 plots JOUT’s quarterly gross profit margin and operating profit margin over the last three years. To provide context to this shorter-term data, in the decade to FY19 JOUT produced an average gross profit margin of 41.2% and an average operating profit margin of 6.5%.
Chart 1:
Source: Created by author using data from JOUT quarterly reports.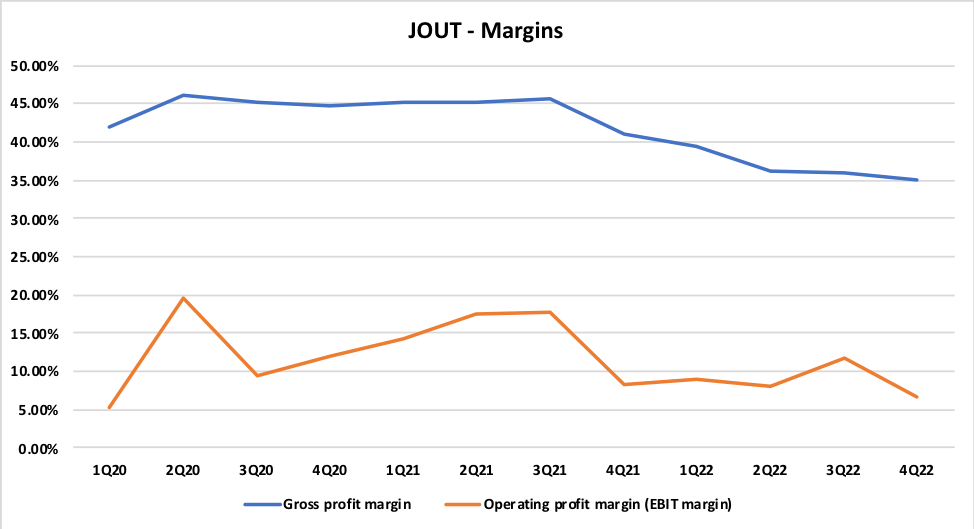
In the 4Q22 Q&A session, management were asked whether or not the company could get back to the 45% gross profit margin level achieved during the Covid-boom period. CEO Helen Johnson-Leipold’s response suggests that a return to consistent 45% gross profit margins is rather unlikely:
Well, those were very different times. Obviously, we will keep that as a goal to get back there. I think right now, we’re dealing with significant cost increases on raw materials, and we’re assuming those will come down. We don’t know how much they will come down. But we do — we are going to work hard on getting our margins back up, whether it goes all the way up is yet to be seen.
Source: JOUT 4Q22 Transcript, Seeking Alpha, page 6.
Inventories
Balance sheet inventory levels averaged ~16.3% of net sales for the five-year period ending FY20. In FY21, this metric spiked to 22.2% of net sales. Things got even worse in FY22, with balance sheet inventory hitting 33.4% of net sales. In dollar terms, inventory levels have increased from ~$95m at FY19 to ~$250m at FY22.
Supply-chain and logistical disruptions have been common themes across many market segments over the last few years, and JOUT has not been immune to these operational challenges. The company says that sourcing of electronic components used in the manufacturing of fishing equipment has been particularly problematic. JOUT has increased levels of inventory and raw materials in a bid to be able to manufacture and deliver sufficient product to meet customer demand, but bottle-necks on certain components continue to cause delivery delays.
Chart 2:
Source: Created by author using data from JOUT quarterly reports.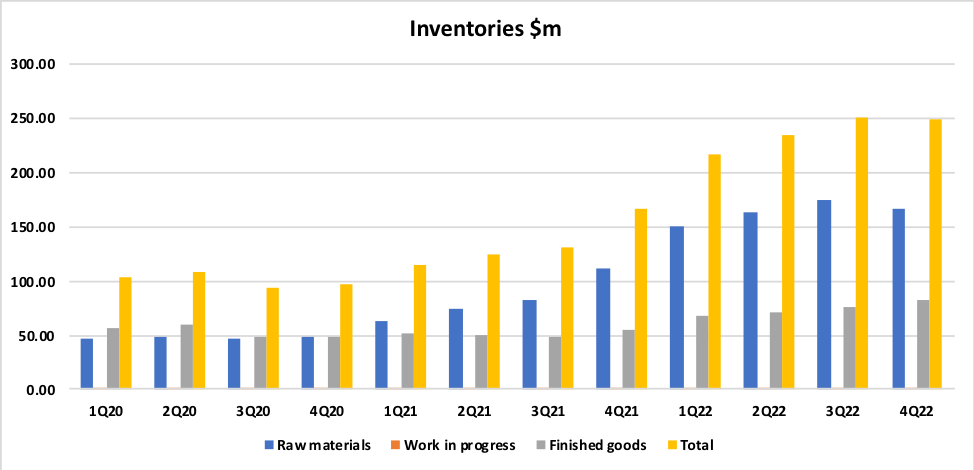
JOUT’s commentary regarding supply-chain and logistical disruptions seems reasonable enough, however it is also entirely feasible that the company’s supply chain and inventory build difficulties (which appear to mainly relate to Fishing) have been due to poor execution and a lack of proper risk management.
Has JOUT been overly reliant on a small number of suppliers? Page 13 of the JOUT FY22 10-K includes a reference to the company having concentrated sourcing with a limited number of vendors – so this appears to be an obvious issue to explore.
The primary raw materials we use in manufacturing our products are metals, resins, electronic components, and packaging materials. These materials are generally available from a number of suppliers, but traditionally we have chosen to concentrate our sourcing with a limited number of vendors for each commodity or purchased component. Under normal circumstances, we believe our sources of raw materials are reliable and adequate for our needs.
Source: JOUT FY22 10-K, page 13.
Other relevant issues to consider include:
- JOUT might have entered into contractual agreements with a small number of second-tier suppliers that are less able to deal with supply chain pressures.
- JOUT may have signed contracts that prevent the group from sourcing materials from other suppliers.
- JOUT’s competitors could have been more nimble/proactive regarding the impact of COVID-19 and might have locked in supply volumes, squeezing JOUT out.
- JOUT might have hit the panic button and purchased high volumes of inventory at high prices.
I would normally expect sell-side analysts and/or institutional investors to dig into such issues in the results Q&A session, firing questions at management in an attempt to identify whether or not the negative outcomes have been due to bad luck or bad management. Unfortunately, in the case of JOUT there is typically only one analyst who asks questions in the Q&A sessions, and management are not being challenged to provide the level of detail that I think is needed in order to arrive at a considered view of the bad luck versus poor execution conundrum.
Small Caps – Prudent To Tread Cautiously
The above discussion highlights an issue that I feel is relevant to the investment case for JOUT. Small-cap stocks often fly under the radar. As a result, some high-quality small companies don’t attract the attention that they deserve, and investors can pick up genuine bargains due to companies simply not being under the spotlight. On the other hand, the lack of external scrutiny (from both sell-side and buy-side analysts) can allow listed small-cap stocks to ‘get away with’ things that would be severely penalised by the market in the large-cap space (corporate governance issues being an obvious example).
The level of disclosure provided by JOUT isn’t exactly comprehensive. There is typically no results presentation pack and the market result release announcement is usually no more than three pages in length. At the time of writing (07 January 2023), the ‘financials’ section of the JOUT investor relations website has a link to the ‘latest annual report’ which dates back to 2019.
My view is that JOUT is not being held accountable by external parties in the manner that I would typically expect to see for a listed stock. This is perhaps not surprising given that the Johnson family and related entities own ~75% of the voting stock.
I have not had direct interaction with JOUT’s management or board members, and I therefore have no insight regarding the quality of the company’s key decision-makers. Without such interaction, the combination of rather limited investor relations materials and a lack of external scrutiny leads me to conclude that a margin of safety (or value buffer) is required when considering the investment appeal of JOUT.
Valuation Analysis – Normalized Earnings Approach
For manufacturing and retail stocks, my preferred valuation metric is EV/EBIT. Table 2 sets out my calculation of AEV/EBIT, where AEV is the adjusted enterprise value, and EBIT is my normalized EBIT.
To arrive at AEV, I have allowed for dividends and profits post balance date. I have not made an adjustment for excess inventory levels (which have potential to normalize downwards and boost cash levels).
Table 2:
Source: Created by author using data from JOUT quarterly reports.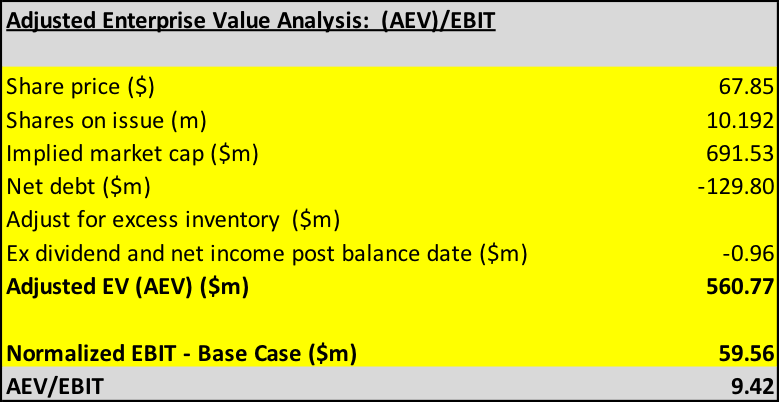
For a small-cap manufacturer of consumer goods such as JOUT, I would typically regard an EV/EBIT multiple in the range of 9x to 11x as representing around fair value. Based on a current share price of $67.85, my analysis points to JOUT trading on a EV/EBIT multiple of ~9.4x.
Summary & Conclusion
- JOUT’s balance sheet remains strong, with no debt and cash of ~$130m as at 4Q22.
- A downward normalization of high inventory levels can be expected to lift cash levels materially, however it is difficult to feel confident about this upside potential given the extent of information available.
- Ongoing supply chain disruptions and the potential for a recessionary-linked downturn in demand for consumer discretionary goods imply that the near-term outlook for JOUT is challenging.
- JOUT has sufficient balance sheet capacity to manage through an economic downturn.
- JOUT’s share price has bounced by ~23% since my BUY call on the stock in late November 2022.
- Given share price strength, and based on a normalized earnings valuation framework, JOUT is no longer in bargain territory. I downgrade JOUT to HOLD (at around $68 per share).
Be the first to comment