

Shahid Jamil
Chart created by writer from C Trader
At the time of writing the last Apple (NASDAQ:AAPL) article the bullish wave one this stock was attempting to form was described as enormous, even giving visual signals it may out do it’s previous high of $185 in the wave one alone, then the Jackson hole speech was released and since digesting the severity of the situation, bullish movement has simply evaporated.
Apple was in fact leading the major equities in terms of pace going higher and a new product range release earlier this month hasn’t so far saved this stock from heading towards the doors of a lower low. It’s not over yet, but it nearly is.
At the time of writing, Apple is technically still in a bullish wave pattern having formed what can be perceived as a wave one $129-$176 but it is how far the perceived wave two is retracing into the wave one since the Jackson hole speech that is concerning. A very deep retrace into a wave one certainly on a macro level suggests there is insufficient appetite to carry the stock above the rejection wave one and two and onto the next price region.
We can see on the monthly chart below that the Fibonacci retrace level of 23% has been taken out with virtually no buying wick formation at the bottom with this latest monthly candle now closed. If Apple is to stay in this bullish wave pattern it will need to at least, retrace slightly lower to form a buying wick full of enough orders that could challenge the perceived wave one high of $176.
Apple monthly (Apple )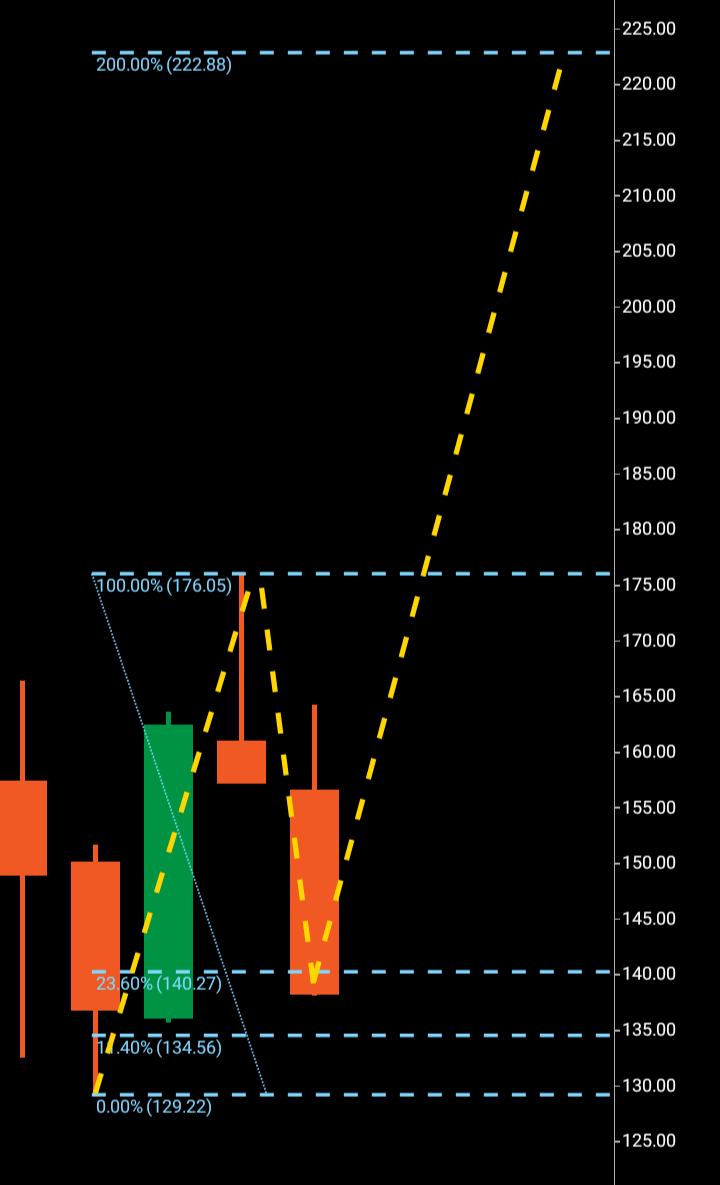
Technically, $134 is the next stop with a break of $129 rendering this potential bullish structure a complete fail.
We can also see in the monthly chart above the outlined wave structure, initially August’s candle was going north at a rate of knots and was only $10 away from taking out it’s previous high of $185 before settling in bearish rejection form around the $150 region. Septembers candle originally formed a bottom outside that region before trying to push upwards to create the wave three, investor appetite just wasn’t there before this week’s bad news saw a bearish continuation into the low Fibonacci retraces of the structure.
Although price is hanging over a major support region there is something about the structure that suggests if it is to break through, it won’t do it immediately. It is possible that a bullish candle forms over the coming month that leads the path to an additional breakthrough lower and there is of course, a possibility a bullish candle forms that leads to a breakout higher.
Now we can move to the weekly structure to examine the internals of the monthly as there are some interesting areas of confluence with a bearish wave one/two created and where the weekly third wave may land.
Apple weekly (C Trader )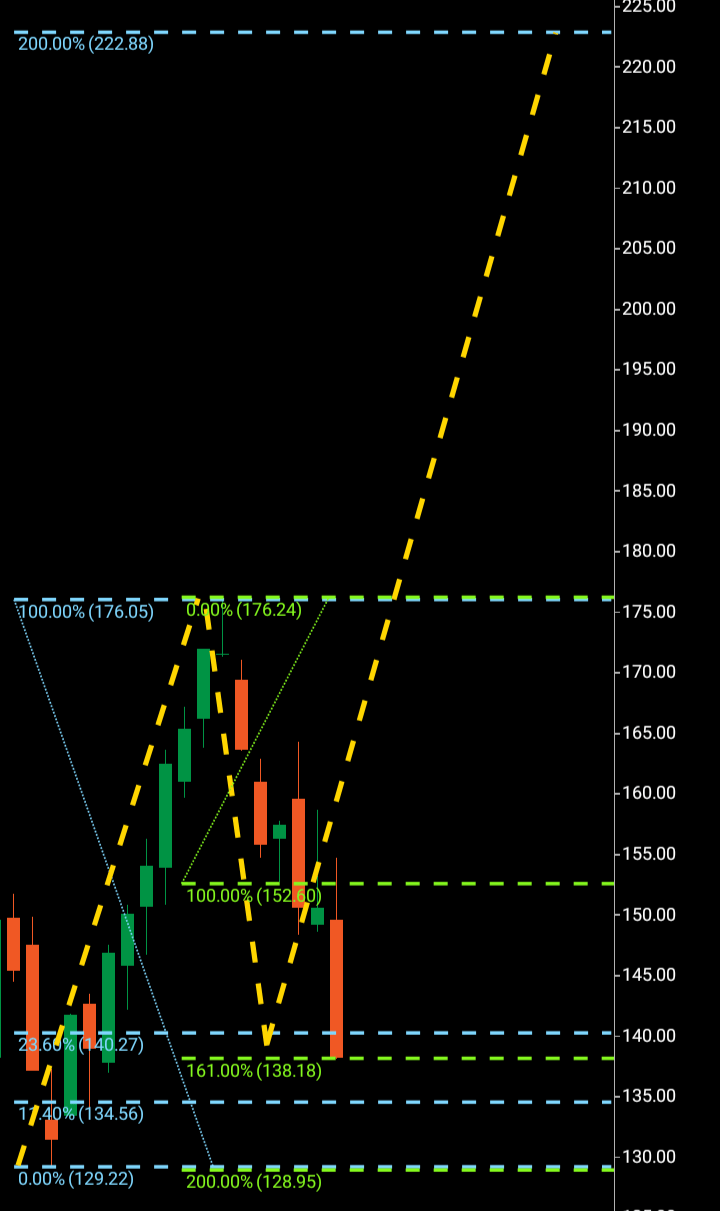
We can see the original weekly wave one two $176-$152 – $152-$165 with the Fibonacci 161 from the following third wave break through of $151 just being achieved with the target for this weekly third wave at major support $129.
The coming weeks will make for interesting viewing as there is technically now a major resistance and major support region outlined with Apple clearly lingering around the latter. Until $129 is clearly broken Apple remains in a bullish wave structure with $176 its resistance. I suggest holding this stock until a major resistance is broken above.
About the Three Wave Theory
The three wave theory was designed to be able to identify exact probable price action of a financial instrument. A financial market cannot navigate it’s way significantly higher or lower without making waves. Waves are essentially a mismatch between buyers and sellers and print a picture of a probable direction and target for a financial instrument. When waves one and two have been formed, it is the point of higher high/lower low that gives the technical indication of the future direction. A wave one will continue from a low to a high point before it finds significant enough rejection to then form the wave two. When a third wave breaks into a higher high/lower low the only probable numerical target bearing available on a financial chart is the equivalent of the wave one low to high point. It is highly probable that the wave three will look to numerically replicate wave one before it makes it’s future directional decision. It may continue past its third wave target but it is only the wave one evidence that a price was able to continue before rejection that is available to look to as a probable target for a third wave.
Be the first to comment