

syahrir maulana
I first turned bearish on the iShares Russell 2000 ETF (NYSEARCA:IWM) back in February 2021, arguing that the Russell 2000 faced a potential 50% decline from its bubble peak (see ‘IWM: Warning Signs From March 2000‘). Despite being down 26% from its November 2021 highs, IWM is far from a bargain. I am no longer short the ETF as I believe that being long U.S. Treasuries is a better risk-reward play for benefitting from economic weakness, I still think there is more downside to come. While the fund’s prospectus states a trailing P/E ratio of just 12.5x, this excludes all the companies with negative earnings. When these companies are included, the P/E ratio rises to a shocking 93x. Even if we use a price-to-peak earnings measure, which generously assumes a return to the level of earnings seen in 2019, the figure still sits at 40x.
The IWM ETF
IWM tracks a market-cap-weighted index of U.S. small-cap stocks. The index selects stocks ranked 1,001-3,000 by market cap. The fund tracks the popular Russell 2000 index, and its broad basket makes it one of the most diversified funds in the segment. The ETF is extremely well diversified in terms of exposure to individual stocks, with no stock making up more than 0.5% of the index. It is also fairly well diversified in terms of sector exposure, with financials making up the largest weighting at 17%. However, the fund’s relatively high weighting towards micro-cap stocks makes the ETF particularly risky. The current dividend yield of 1.4% offers nowhere near enough protection for such risk, particularly in the context of elevated real interest rates and a weakening economy.
Valuation Metrics Range From Expensive To Extreme
The Russell 2000 trades at a staggeringly high PE ratio of 93x when loss-making companies are included in the calculation, making the index extremely expensive relative to both its own history and the broader market. The growth sector of the market largely explains these extreme valuations, with the Russell 2000 Growth Index trading at a P/E ratio of 2900x thanks to almost non-existent earnings. The value sector, however, is by no means cheap, with a PE ratio of 47x according to Bloomberg data. Even if we look at more favorable valuation metrics such as the price-to-peak earnings ratio, the figure sits at 40x, which is still above its 2000 and 2007 peaks.
Bloomberg, Author’s calculations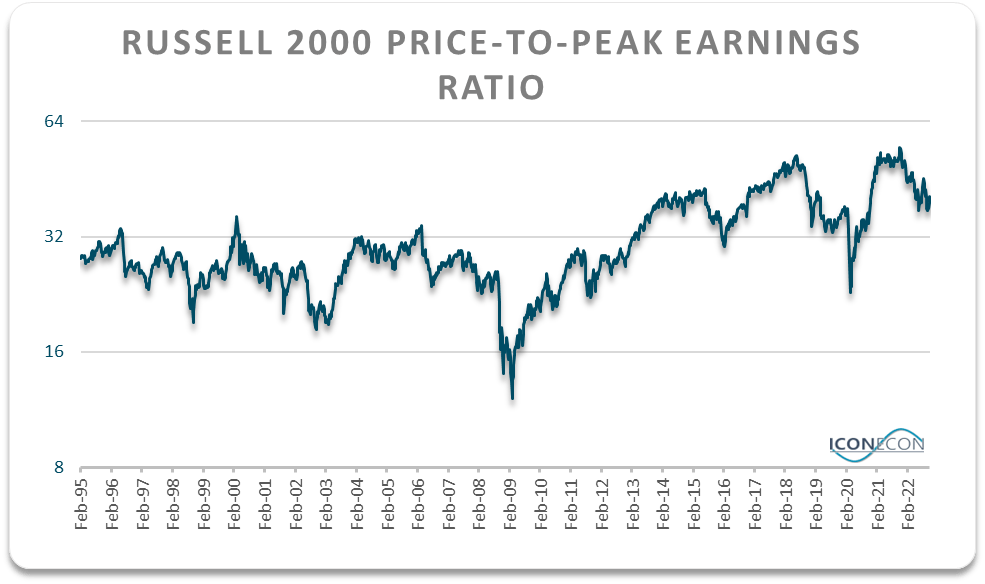
Other valuation metrics such as the EV/EBITDA ratio and the price-to-sales ratio also show that the market is overvalued. The EV/EBITDA ratio, at 14.1x, is above those major bull market peaks. Meanwhile, the P/S ratio remains in the top 20% of valuations going back to 1995. One valuation metric that has improved significantly is the dividend yield, which is actually higher than its long-term average, but at just 1.6% it is still below the expected real return on 30-year U.S. Treasury bonds.
Russell 2000 Dividend Yield Vs 30-Year Real Yields (Bloomberg)
Small-Cap Stocks Are Highly Sensitive To Recessions
Small cap stocks tend to outperform during bull markets but underperform in bear markets as their lower profit margins leave them susceptible to slowing sales and weaker balance sheets mean higher default risk. This is reflected in the market beta figure of 1.14x in the IWM’s prospectus. The current macroeconomic climate is particularly problematic for small cap stocks, with leading indicators pointing towards a deepening recession. I have noted the negative print in the Conference Board’s Leading Economic Indicator in recent articles as strong evidence that U.S. real GDP will shrink in year-on-year terms over the coming quarters. The LEI has a near-perfect track record of forecasting such transactions.
LEI Vs Real GDP Growth (Conference Board, Bloomberg)
At this point, a further contraction in real GDP may be widely expected, but there are growing risks of a financial crisis as soaring real interest rates bump up against high debt levels across the entire economy. The last time we saw the Fed hike into a recession was in the early 1980s and this led to major weakness in equity prices even though debt levels were just a fraction of where they are today.
I think there is a strong argument to be made at present that real borrowing costs are the highest they have ever been when measured from a forward-looking perspective. The 10-year inflation-linked bond is currently 1.5% and I believe real GDP growth is likely to be close to zero over the next decade. To see why, consider that U.S. real GDP has averaged 1.9% since the growth boom ended in 2000. 0.7% of this growth can be attributed to the rise in the working-age population, which has now peaked, meaning that even if growth per worker was to come in in line with the rate seen over the past two decades, we should only expect real GDP growth of 1.2%. Meanwhile, trend productivity growth sits at 1.0%, and should be expected to continue its long-term decline as economic freedom continues to deteriorate amid rising electoral demand for socialism. With this in mind, all that it would take for real GDP to come in below zero over the next decade would be for the unemployment rate to rise from its current low level of 3.5% to 4.0%.
Summary
The IWM remains far too expensive even after a 26% decline from its peak. Not only are valuations extreme, but the outlook for earnings continues to deteriorate amid the rise in real borrowing costs and weakening economic activity. Small cap stocks are highly susceptible to recessions and financial crises, and the risk of such an event is rising.
Be the first to comment