

Gold (XAU/USD) Analysis, Price and Chart
- Multi-week bullish channel under threat
- A consolidated break higher could open the way to $1,960/oz.
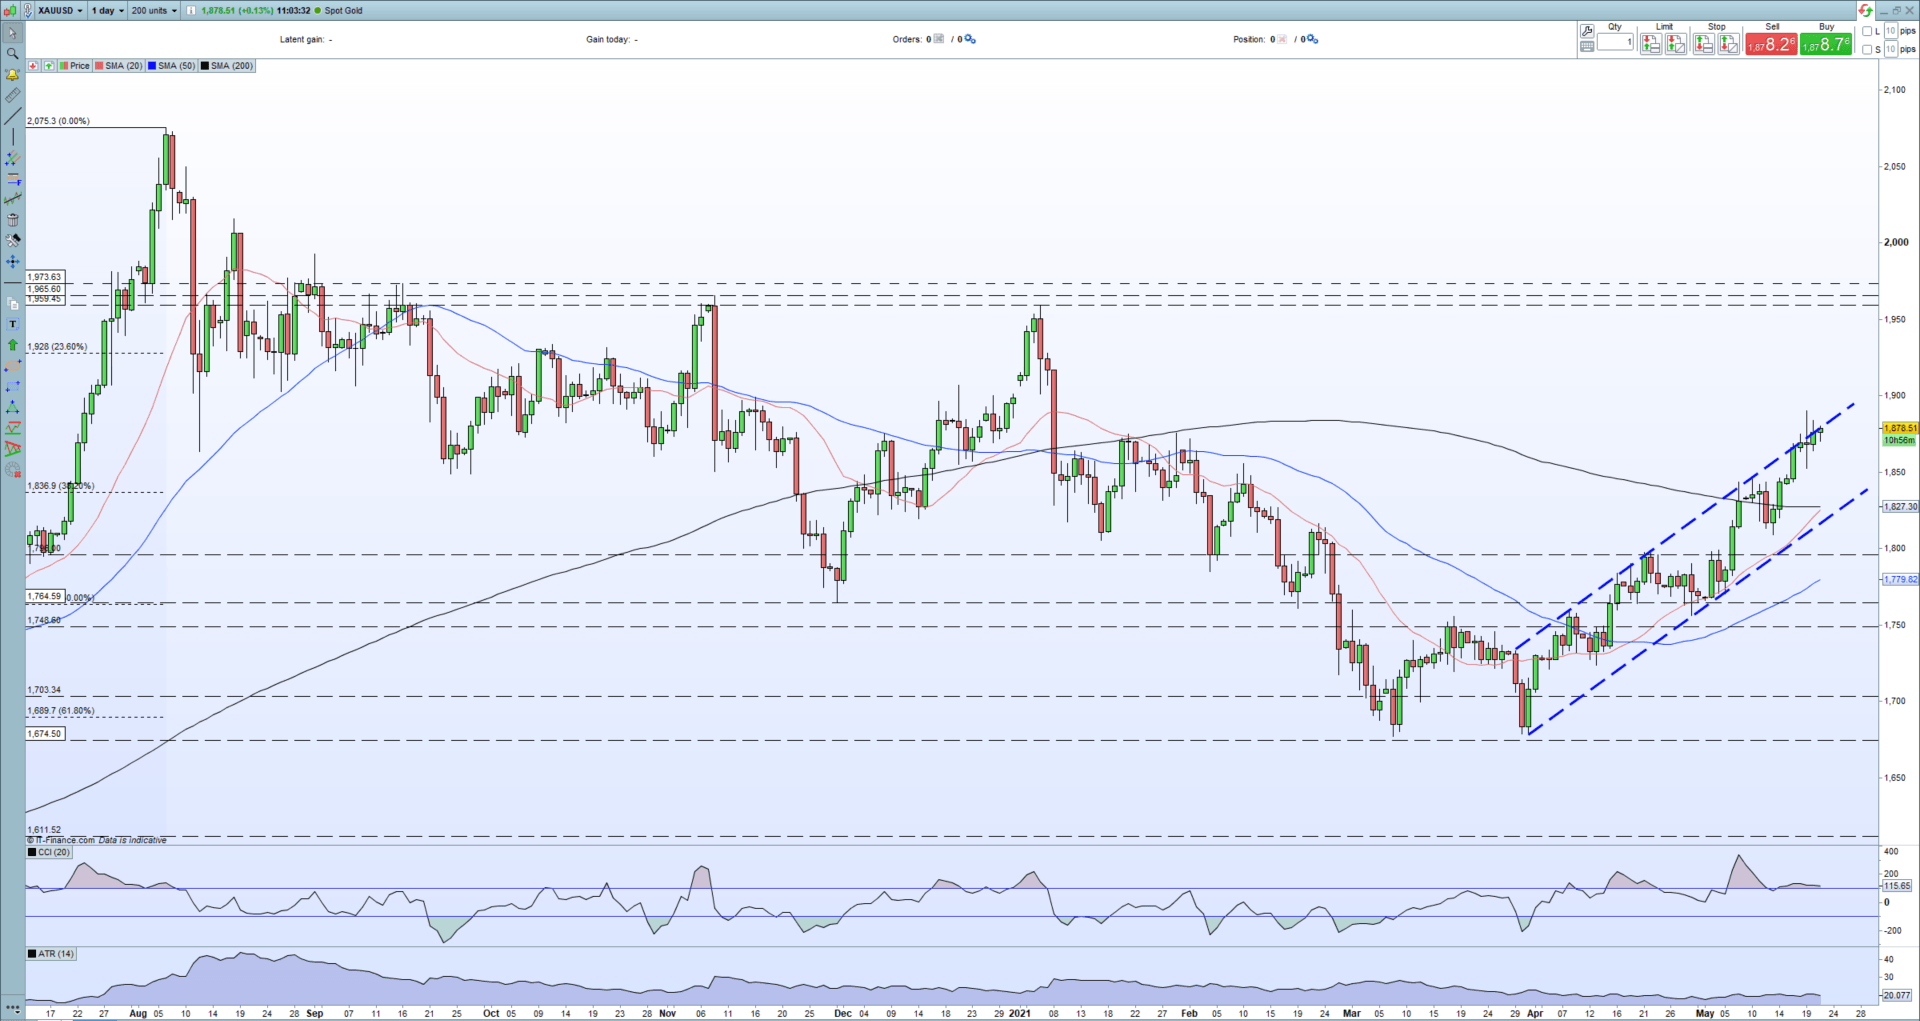
The technical outlook for gold remains positive for the coming, especially if the precious metal can make a confirmed breakout from the multi-week bullish channel. Gold has risen by more than $200/oz off the March 31 low with any sell-off bought back, keeping it within a well-defined bullish channel. The topside of this channel is under threat again and a break and open above here would leave the psychological $1,900/oz level as the next target. Above here, the 23.6% Fibonacci retracement of the March-August 2020 rally at $1,928/oz. comes into view with little technical resistance then seen before a cluster of three swing highs between $1,960/oz. and $1,974/oz come into play.
The three simple moving averages are also turning positive with the 20-dsma looking to move above the 200-dsma, while the 50-dsma is also turning higher.
Moving Average (MA) Explained for Traders
Gold Daily Price Chart (July 2020 – May 21, 2021)
Client sentiment data show 75.04% of traders are net-long with the ratio of traders long to short at 3.01 to 1. We typically take a contrarian view to crowd sentiment, and the fact traders are net-long suggests Gold prices may continue to fall.Yet traders are less net-long than yesterday and compared with last week.
Recent changes in sentiment warn that the current Gold price trend may soon reverse higher despite the fact traders remain net-long.
What is Market Sentiment and How Does it Work?
What is your view on Gold – are you bullish or bearish?? You can let us know via the form at the end of this piece or you can contact the author via Twitter @nickcawley1.
Be the first to comment