

da-kuk
The iShares GSCI Commodity Dynamic Roll Strategy ETF (NASDAQ:COMT) is an ETF that offers exposure to a basket of commodities that encompass a plethora of sub-segments such as energy, metals, agriculture, and livestock. Over the years, COMT has proven to be a fairly useful product for those seeking to play the commodities market whilst reducing rolling risk. COMT does so by using a dynamic contract rolling strategy, which mitigates the impact of rolling into contango-like situations. Nonetheless, since its inception, COMT has managed to outperform the Bloomberg Commodity Index by almost 2x. Should one continue to hold this long-term alpha generator? Well, to answer that you need to consider some of the underlying conditions in the ETF’s focus markets, which frankly, don’t point to a particularly great outlook ahead.
YCharts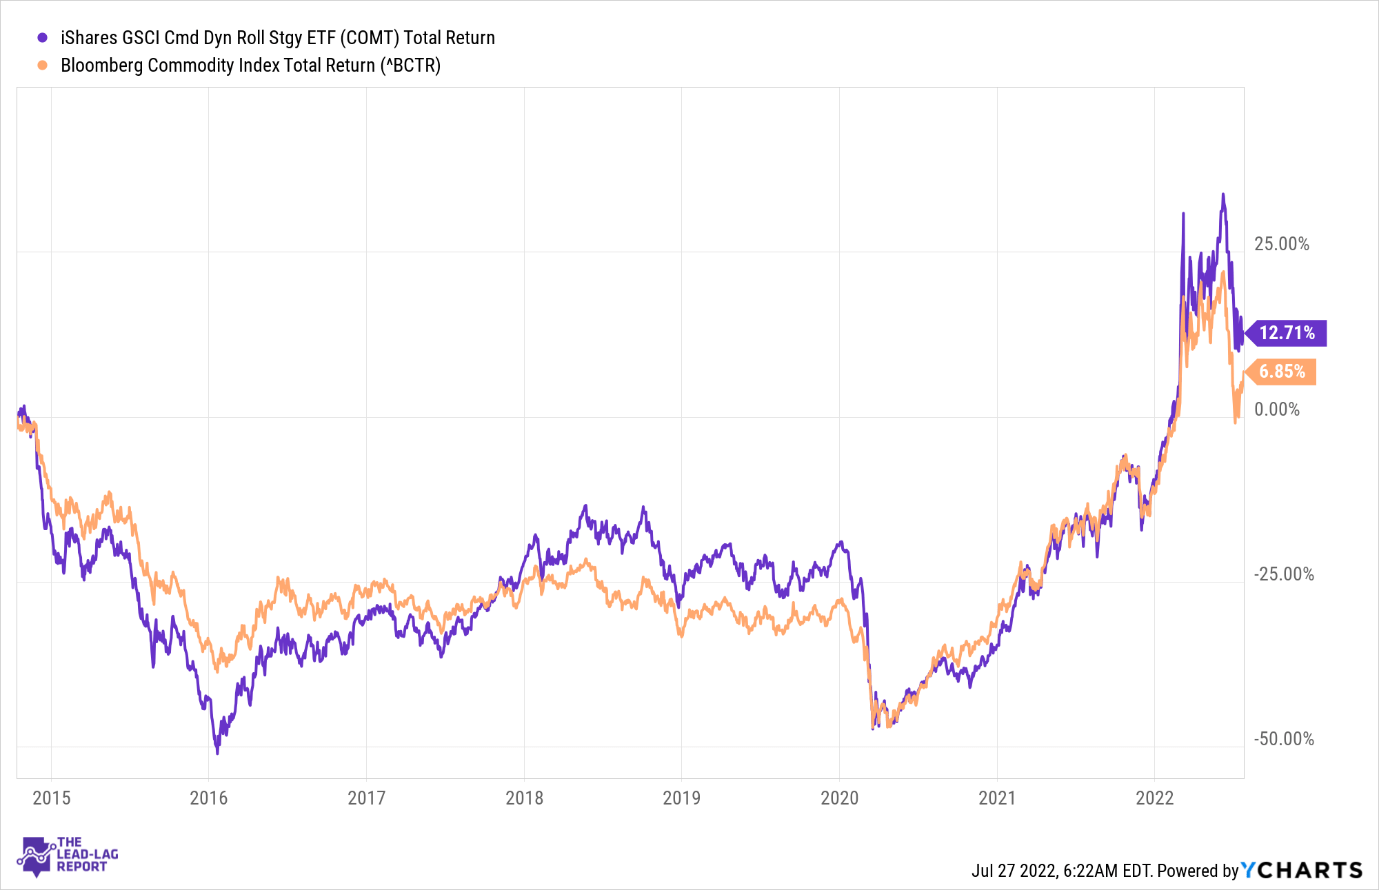
Conditions in the commodities market
Twitter
Anyone who’s followed the commentary of The Lead-Lag Report across various investor portals since the fag end of last year would note that I’ve been stating that the real pernicious risk for the financial markets, is deflation, and not so much inflation. We may not be there as yet but the dominoes certainly appear to be falling. With the potential prospect of deflation, commodities are the last place you want to park your funds in. In fact, you’d be interested to know that COMT itself is down by 7% over the past month, and there are a few reasons for this.
Firstly, consider the aggressive rate at which central banks across the world have been tightening monetary conditions and lifting rates. The effects of this are bound to be very damaging for economic growth; indeed S&P Global has now pegged the probability of global recession at 40-50%, whilst some major developed nations such as Germany, will almost certainly face recessionary conditions. With a weak economic outlook on the agenda, demand conditions for commodities will flatten out.
Then, as noted in a recent Twitter Spaced discussion on The Lead-Lag Report account, more stringent monetary conditions also dampen the liquidity narrative, and when money becomes dearer, the commodity space remains one of the least appealing magnets for fund flows.
Also consider that within the developed markets rate hiking continuum, the US Fed has proven to be one of the most aggressive amongst its peers, lifting rates by 150bps since March, and another 75-100bps in July, and potentially more, further in the year. In effect, the Fed funds rate will likely be over 3% as we enter 2023. This aggressive spree by the US Fed has most certainly boosted the allure of the dollar, the currency in which all these commodities are priced. I’m digressing here, but as noted in last week’s macro section of The Lead-Lag Report, you also have to consider that some notable commodity producers and exporting nations (such as Brazil) have also run up significant external debt and remain vulnerable to default risk given the dollar’s red-hot trajectory.
Another significant headwind to consider is what’s happening with the world’s largest commodity consumer-China. The recent lockdowns and the ongoing property crisis have severely upended demand for a range of commodities. The Chinese real estate sector accounts for 33% of the nation’s total steel and iron ore demand and the government’s crackdown on excessive debt there will cripple demand for iron ore and push the global iron ore market into a surplus position OF 67million tons in H2, after having witnessed a deficit of 56 million tons in H1022.
The reduced appetite isn’t just limited to industrial metals, consider something like palm oil where import volumes in June came in at only 70000 tonnes, representing a whopping annual decline of 81%; incidentally, this is the weakest reading in 18 years!
Bloomberg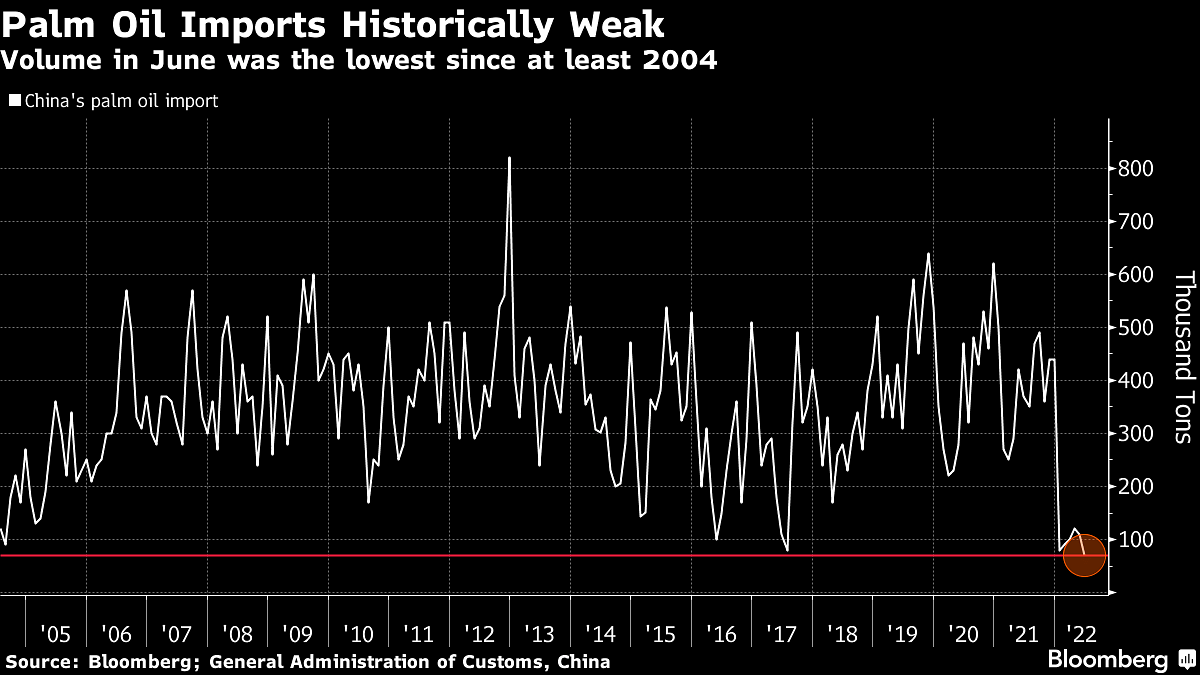
As flagged in The Lead-Lag Report, cotton futures have also been increasingly sensitive to the lockdown effects in China as it is the largest producer, consumer and exporter of textiles. As things stand, this commodity is down by more than 20%
Twitter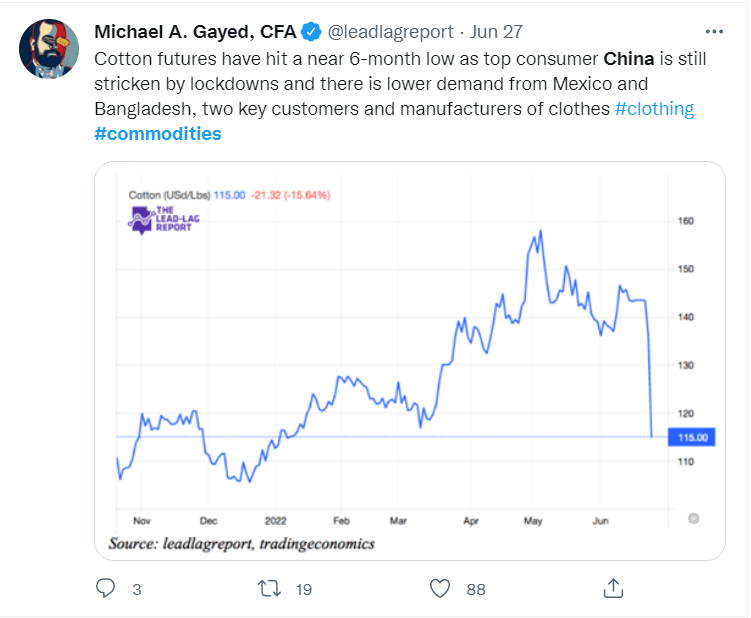
Finally, also consider the energy markets, which interestingly carries the largest weight in COMT, by far (exposure of COMT to the energy sector is 65%). The stop-start impact from the lockdowns has reduced transportation trends there, so much so that the country looks on course to curtail its crude imports for a second successive year.
Bloomberg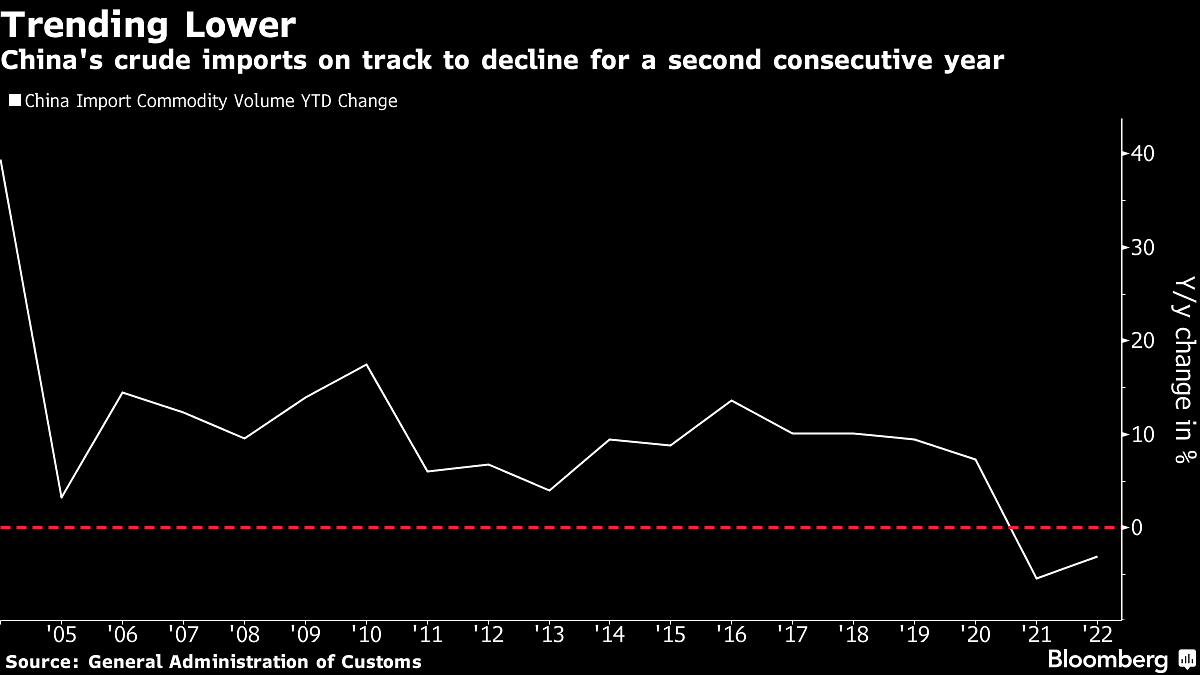
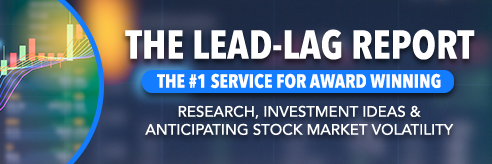
It also appears that The Red Dragon has become more independent when it comes to LNG, as higher domestic production and increased supply from pipelines there should dampen the need for sizeable LNG imports. According to Bloomberg, seaborne cargoes of LNG are poised to decline by 15%!
Bloomberg
Conclusion
As noted in this article, conditions for the commodity space aren’t in the best of health. What also dampens COMT’s investment case is its risk profile; its annualized volatility works out to around 29%, which is a good 1000bps higher than the asset class median. Besides, as flagged in The Lead-Lag Report, three of my inter-market signals point to risk-off conditions, and the fourth one, a long-term treasury focused signal could follow suit soon enough. You’d be interested to know that these signals have a good track record in flagging major downturns when all of them pivot at the same time. Tread cautiously.
 Anticipate Crashes, Corrections, and Bear Markets
Sometimes, you might not realize your biggest portfolio risks until it’s too late.
That’s why it’s important to pay attention to the right market data, analysis, and insights on a daily basis. Being a passive investor puts you at unnecessary risk. When you stay informed on key signals and indicators, you’ll take control of your financial future.
My award-winning market research gives you everything you need to know each day, so you can be ready to act when it matters most.
Click here to gain access and try the Lead-Lag Report FREE for 14 days.
Be the first to comment