

CatLane
By Tracy Chen, CFA, CAIA
Housing markets in many developed countries, including the U.K., New Zealand, Canada, Australia, Sweden, and the U.S., have had a spectacular run. Fueled by easy monetary policies and fiscal stimulus post-COVID, these markets have recorded double-digit appreciation rates. Now, many fear a reckoning akin to the Global Financial Crisis (GFC) may be coming, particularly in the U.S. as the Federal Reserve (FED) aggressively targets out-of-control inflation. New Zealand, Canada, Australia, and Sweden are starting to see housing price declines. Given the importance of housing to the U.S. economy due to its multiplier effect, is the U.S. housing market headed for a slowdown or a meltdown?
Mortgage rates in the U.S. have almost doubled, rising by roughly 300 basis points since their low in February 2021. Meanwhile, housing affordability has worsened due to double-digit price appreciation and higher monthly principal and interest payments, which have increased by approximately 50% since the beginning of 2022. As a result, U.S. housing activities have slowed sharply, including pending, new, and existing home sales, and market sentiment has become increasingly pessimistic. Will housing prices turn drastically negative soon? Conventional wisdom holds that the housing market, given its interest rate sensitivity, will be the first to go as the Fed tightens. We believe that view is not a foregone conclusion, and the truth is probably subtler. The current U.S. housing market is strikingly different from the one leading up to the GFC. We do expect housing price appreciation to moderate, but also contend that it can remain positive in 2022, with no foreseeable price collapse. We examine the differentiated factors, including unique supply and demand conditions, that currently still support housing prices and should prevent any softening from becoming a full-blown collapse.
Supply and Demand Influences on Housing Prices
In most housing price models, there are multiple variables that need to be calibrated, including housing supply; demand; mortgage rates; the structure of mortgage products and their respective interest-rate sensitivities; mortgage credit growth; bank lending standards; the financial health of households from savings to leverage; labor market conditions; housing price levels relative to other countries; economic cycles; other macroeconomic conditions; and more. Some factors, like affordability, housing activities, and mortgage rates, do show a directional, causal relationship to housing prices. However, a direct regression analysis indicates they are not significant on their own in forecasting housing prices. Therefore, drawing conclusions on housing prices simply by looking at affordability, housing sales, and mortgage rates is too simplistic. Instead, we will assess the direct supply and demand factors and other key drivers of housing prices in a holistic approach.
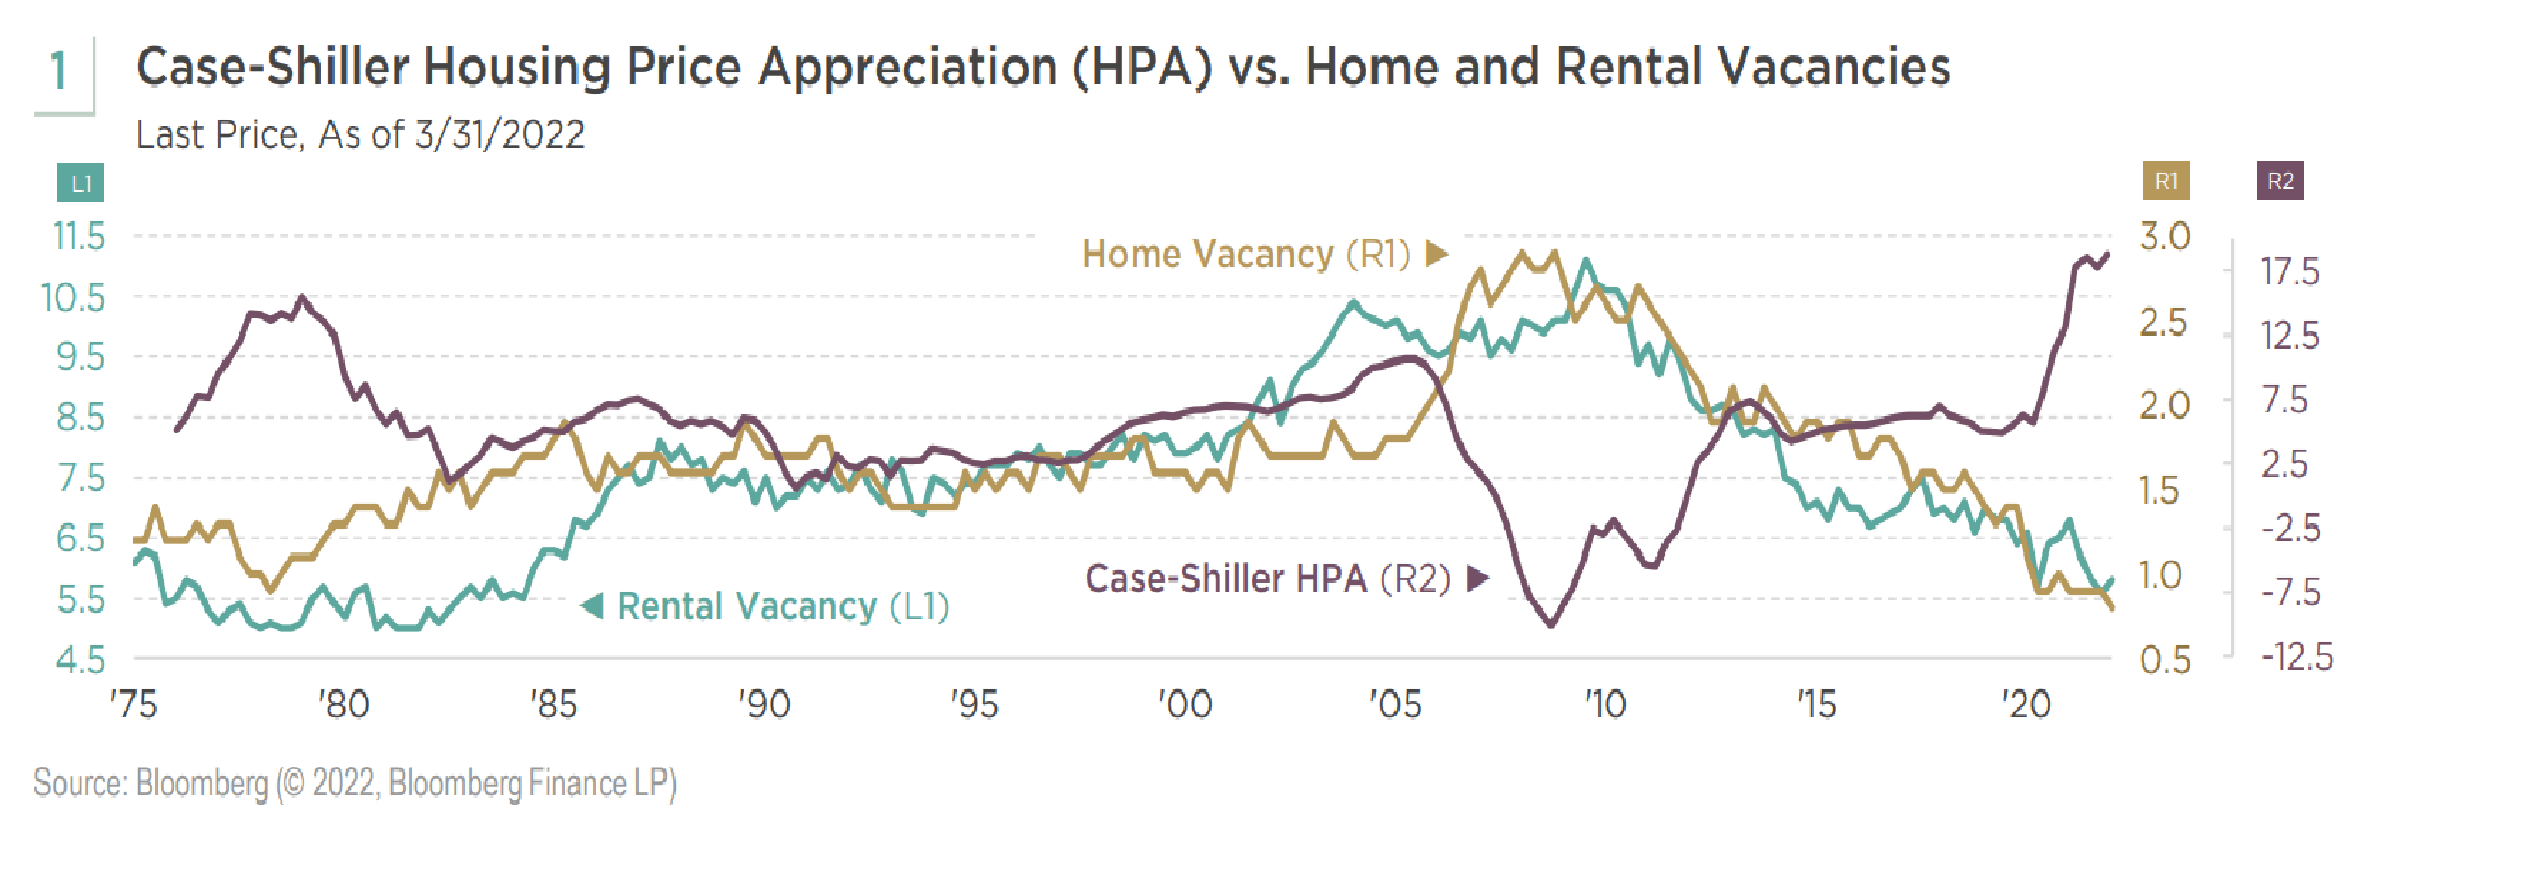
On an overall basis, we expect both supply factors, driven by an ongoing shortage of supply, and demand influences, buoyed by strong demographic trends, to continue to support the U.S. market. Since the GFC, there has been an underbuilding of homes, due in part to the tight labor market and lumber and land regulations. The result has been a very tight housing supply, and vacancy rates of both homes and rentals are at historical lows (see FIGURE 1).
From an overall demand perspective, the coming of home-buying age of millennials suggests strong household formation and demand for houses will continue. With working from home the new norm and rentals no longer cheap, homes have become both sanctuaries and office spaces with larger utility value. These demographics imply structural demand for housing remains robust even if cyclical forces weigh on home sales. Now, let us quantify the three types of supply and their corresponding demand: new homes, existing supply, and shadow supply, or foreclosures:
1. New Homes: Large Construction Pipeline Unlikely to Relieve Supply Pressures
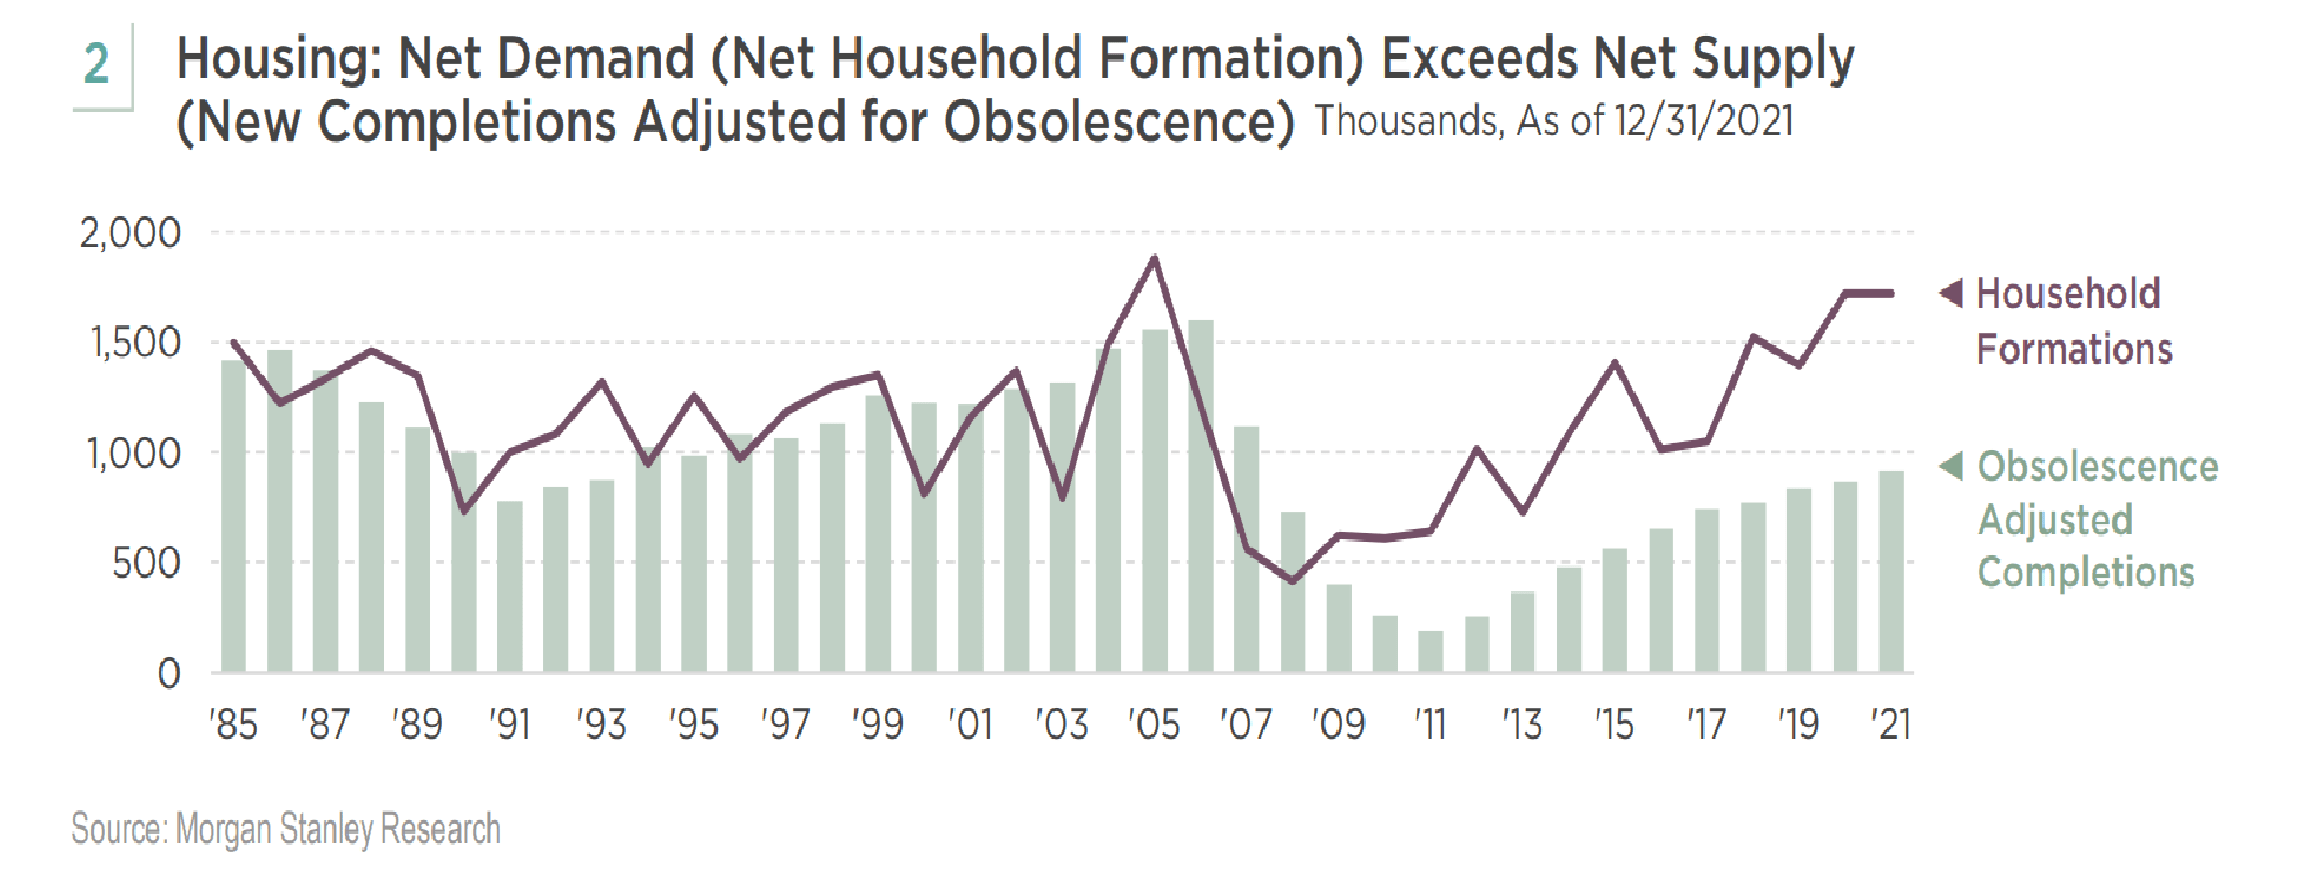
Calibrating supply and demand for new homes, the net demand for new homes has been significantly exceeding net supply since 2011 (see FIGURE 2). This trend further proves the underbuilding of houses since the GFC. We calculate that the current shortage of new homes in the U.S. is over 6 million. Our number agrees with the 6.8 million new housing shortage estimated by the National Association of Realtors in 2021.
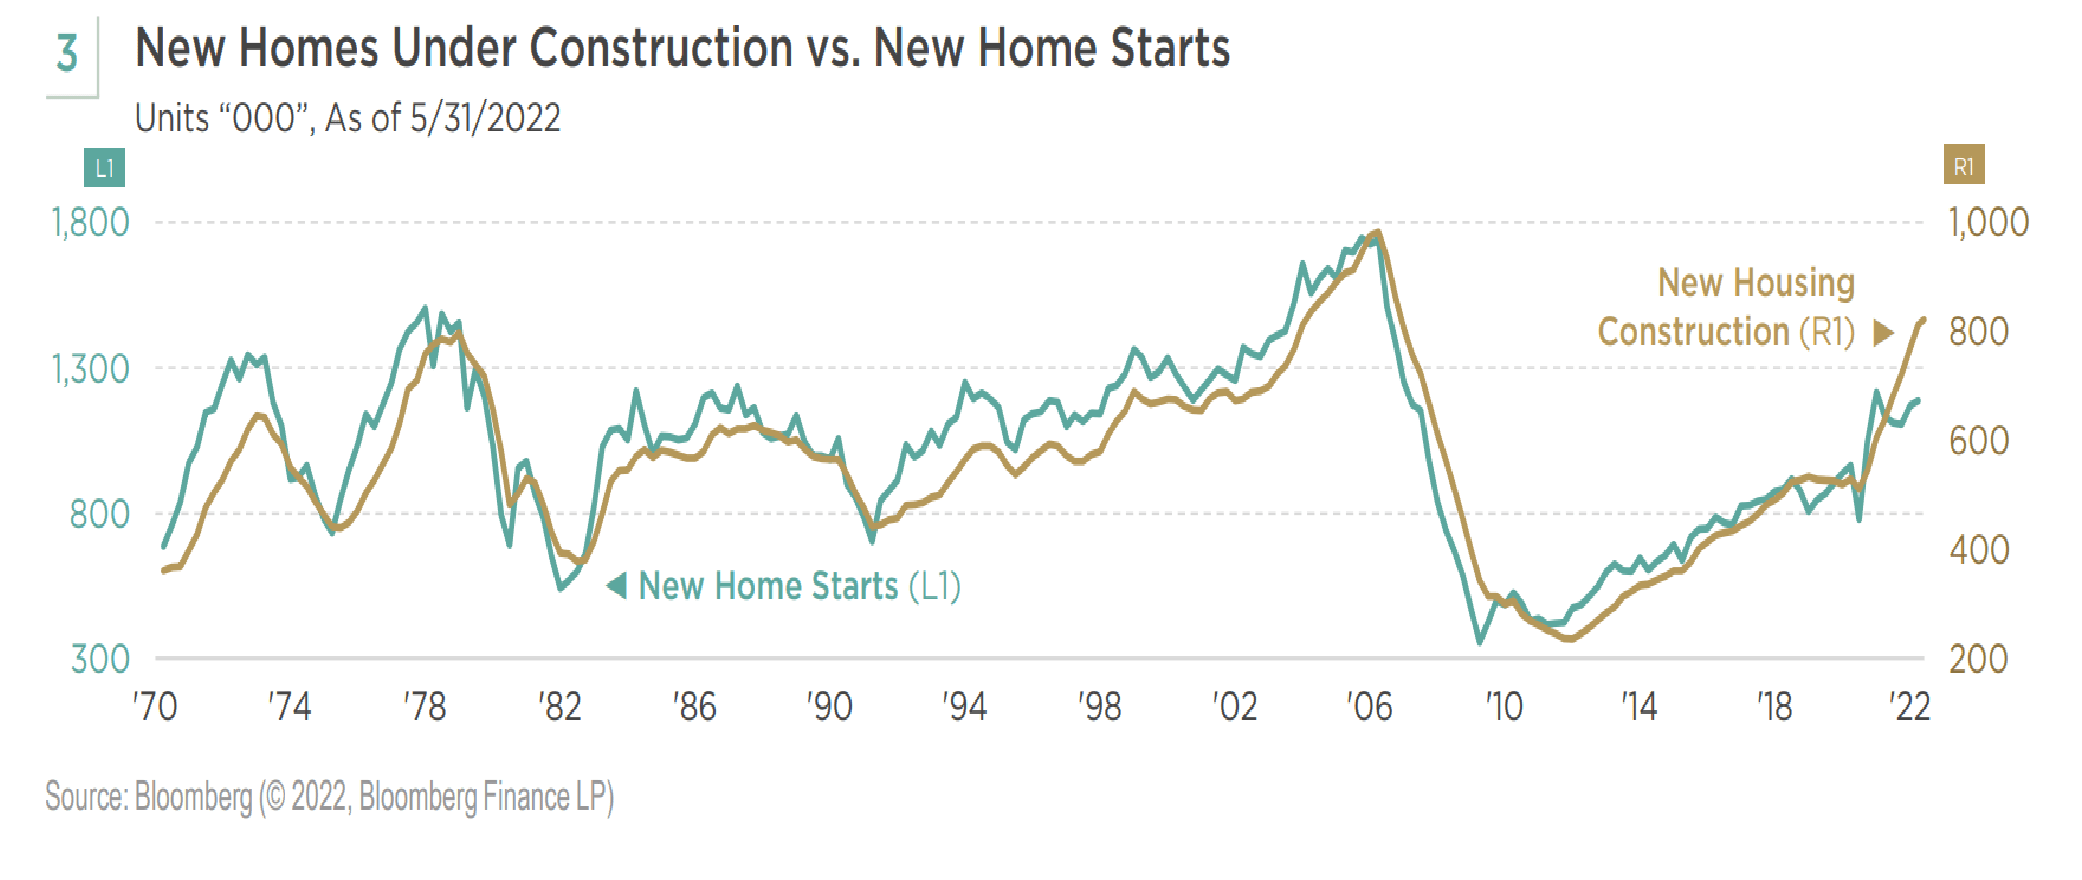
There has been an increase in the number of homes under construction, resulting in a sharp build-up in the months of inventory of new homes to about 9.3 months. However, we do not believe the new inventory increase will put tremendous pressure on supply since the undersupply is so significant. Furthermore, we believe the sizable construction backlog could slow the pace of new housing starts, and new starts should stabilize. As a result, single-family starts likely have plateaued (see FIGURE 3 on the next page). Once completed, new homes can be sold on average in 2.5 months, which suggests the increase in inventory months is due to the “under construction” delay rather than a shortage of demand.
2. Existing Homes: Lower Refinancing Rate Will Keep Supply Tight
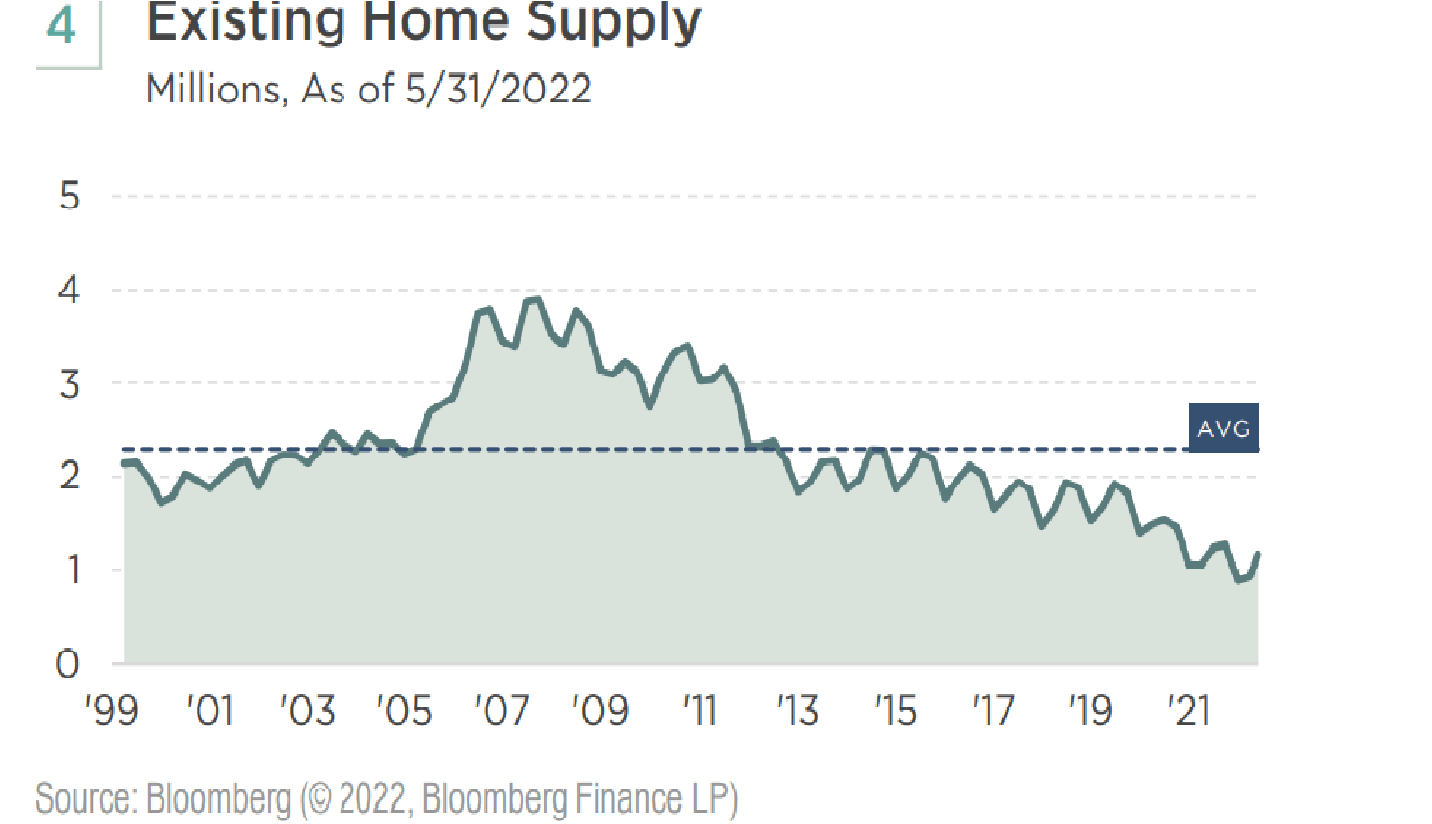
On the existing home front, the number of existing homes for sale, at slightly over 1 million units, is also at a historical low (see FIGURE 4). We believe it will take years for the tight supply environment to improve.
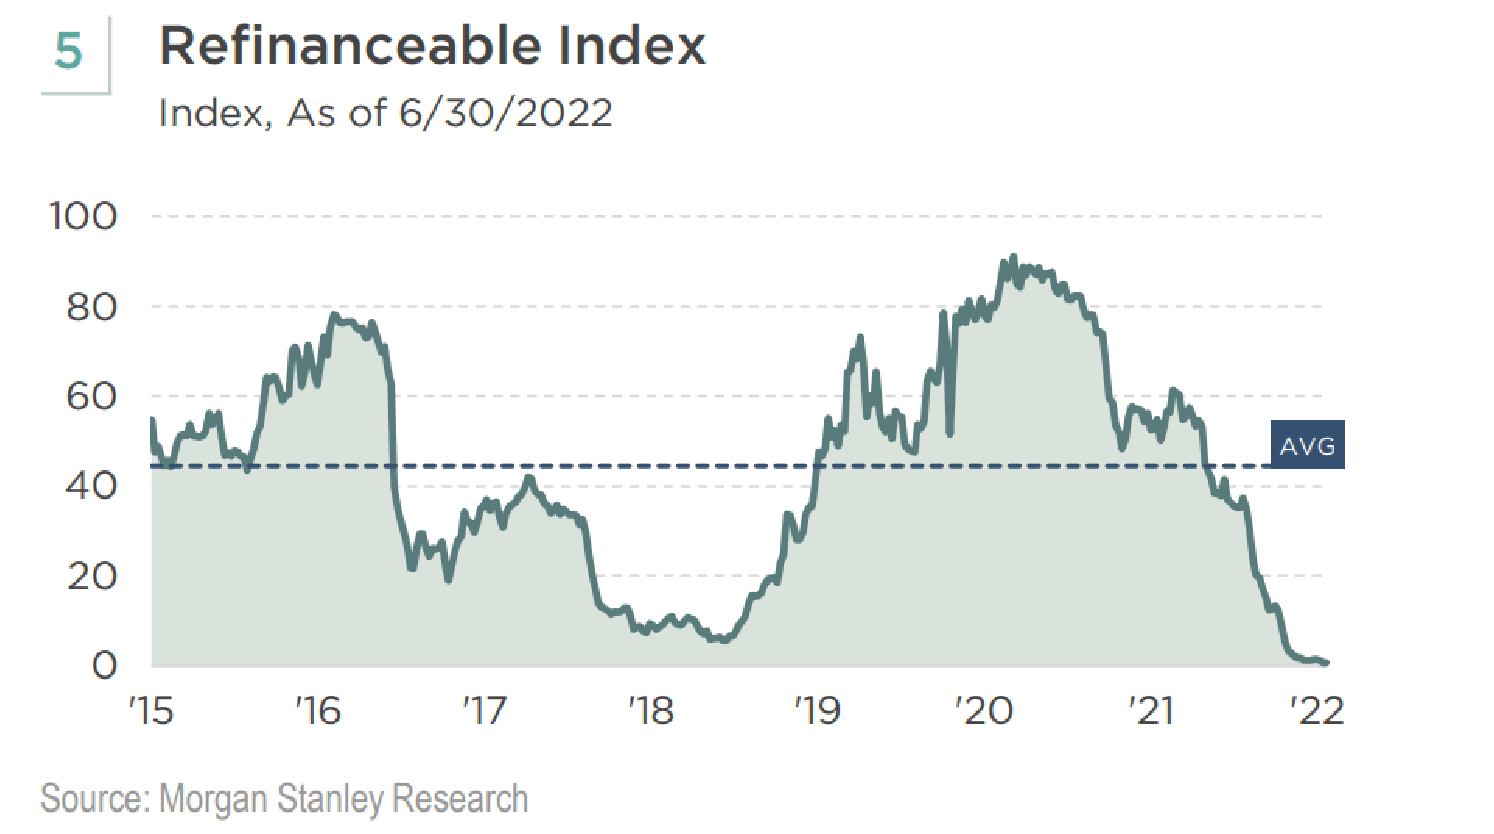
Higher current mortgage rates have a “lock-in” effect on existing homeowners. Because they effectively locked in lower mortgage rates, current homeowners have no incentive to refinance, and their mobility is limited (see FIGURE 5). Hence, rising mortgage rates have resulted in even less existing home supply.
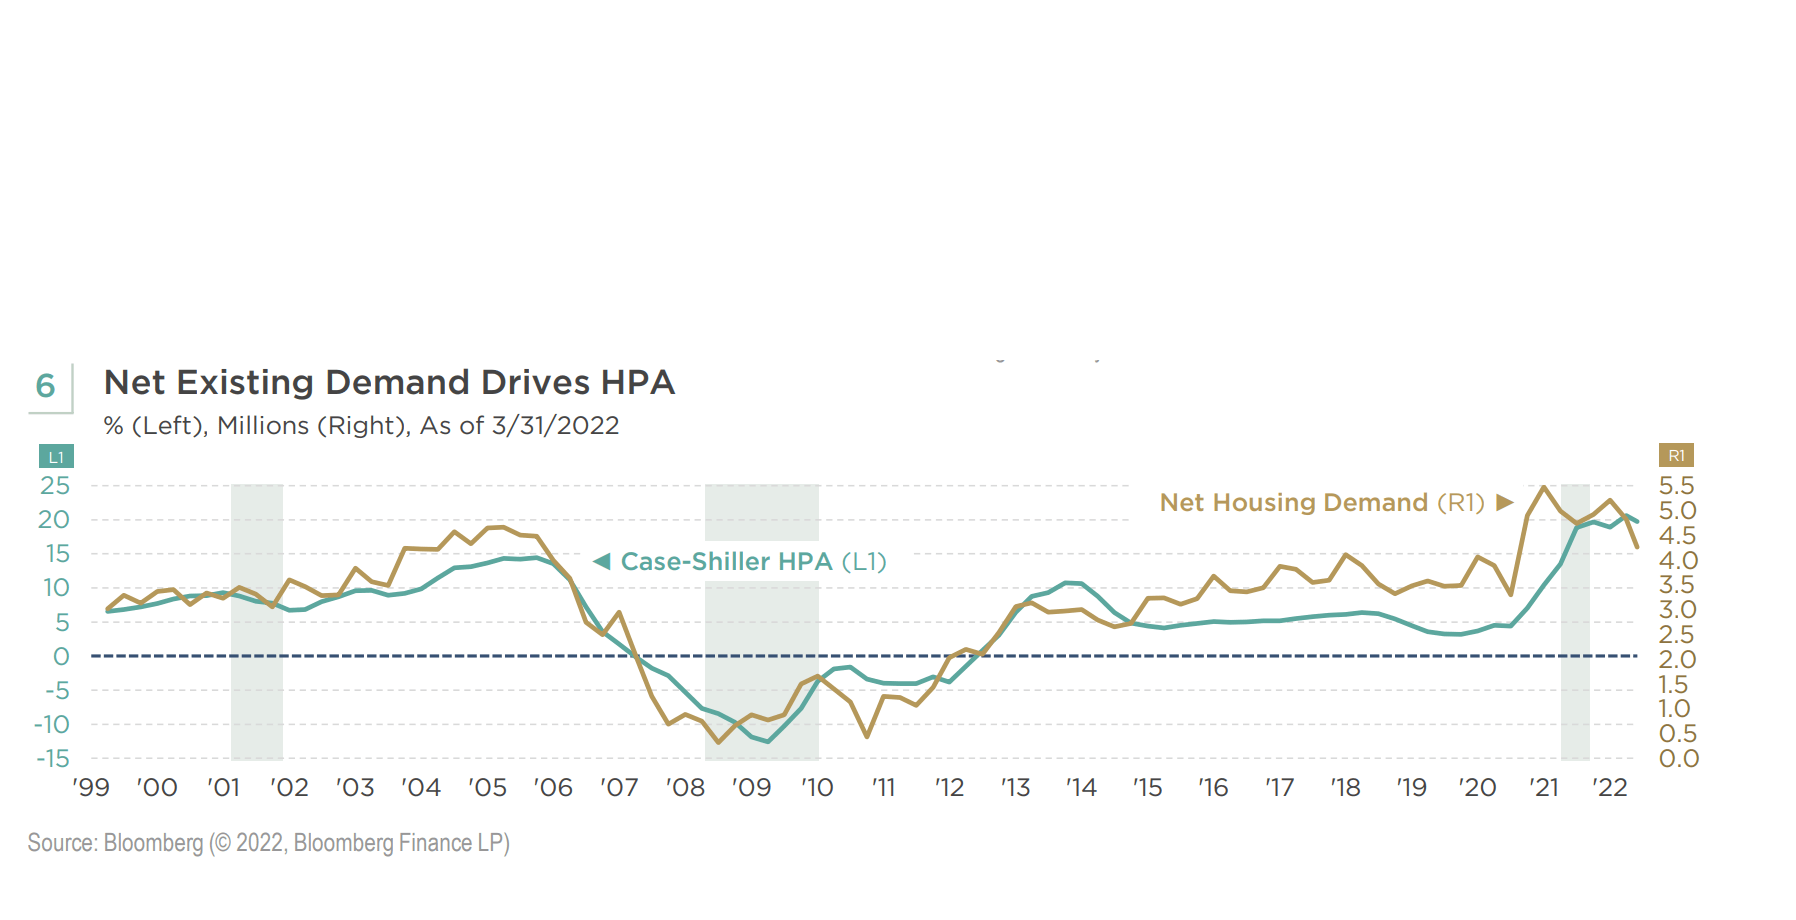
We conducted a regression analysis of net existing home demand, defined as existing home sales minus existing homes for sale, and home price appreciation (HPA). We find the correlation is very significant, with an R-squared of 0.80, suggesting net existing home demand is a good predictor of the latter (see FIGURE 6). From our analysis, as long as net demand stays higher than roughly 2.27 million, the HPA should be positive.
3. Shadow Supply: Prudent Underwriting and Lack of Distress Keep Supply Low
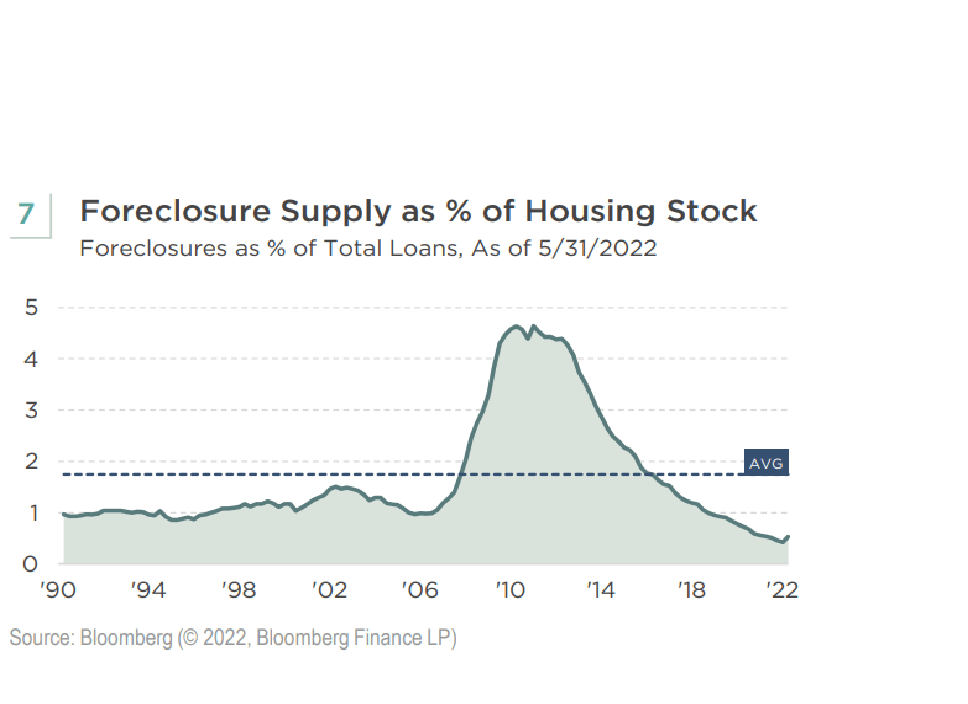
Compared to the GFC housing crisis, generous forbearance policies, loan modification programs, and sound mortgage underwriting have kept foreclosures low post-GFC, pushing the shadow housing supply to a historical low (see FIGURE 7). Because the distressed sales associated with shadow inventory can weigh on home prices, this lack of distress is another reason why we believe a housing price collapse can be avoided.
Given these supply and demand characteristics, we consider the housing market on a solid foundation. Certainly, affordability remains a concern. However, the unique supply and demand picture suggests that affordability challenges will impact housing sales more than housing prices. Therefore, affordability pressures may lead to sharp drops in home sales volumes and a slowdown in the rate at which housing prices increase-the pace of HPA should moderate to allow for normalization-but we do not believe affordability challenges will lead to declines in national home prices in 2022.
Structural Characteristics Supporting the Housing Market
Since the GFC, there have been several structural improvements to the U.S. housing market and household financial conditions. From mortgage underwriting to household balance sheets, the current market is vastly different from the one leading up to the events of 2007 through 2009, and a collapse like the one seen during and following that crisis is unlikely.
Tighter Lending Standards
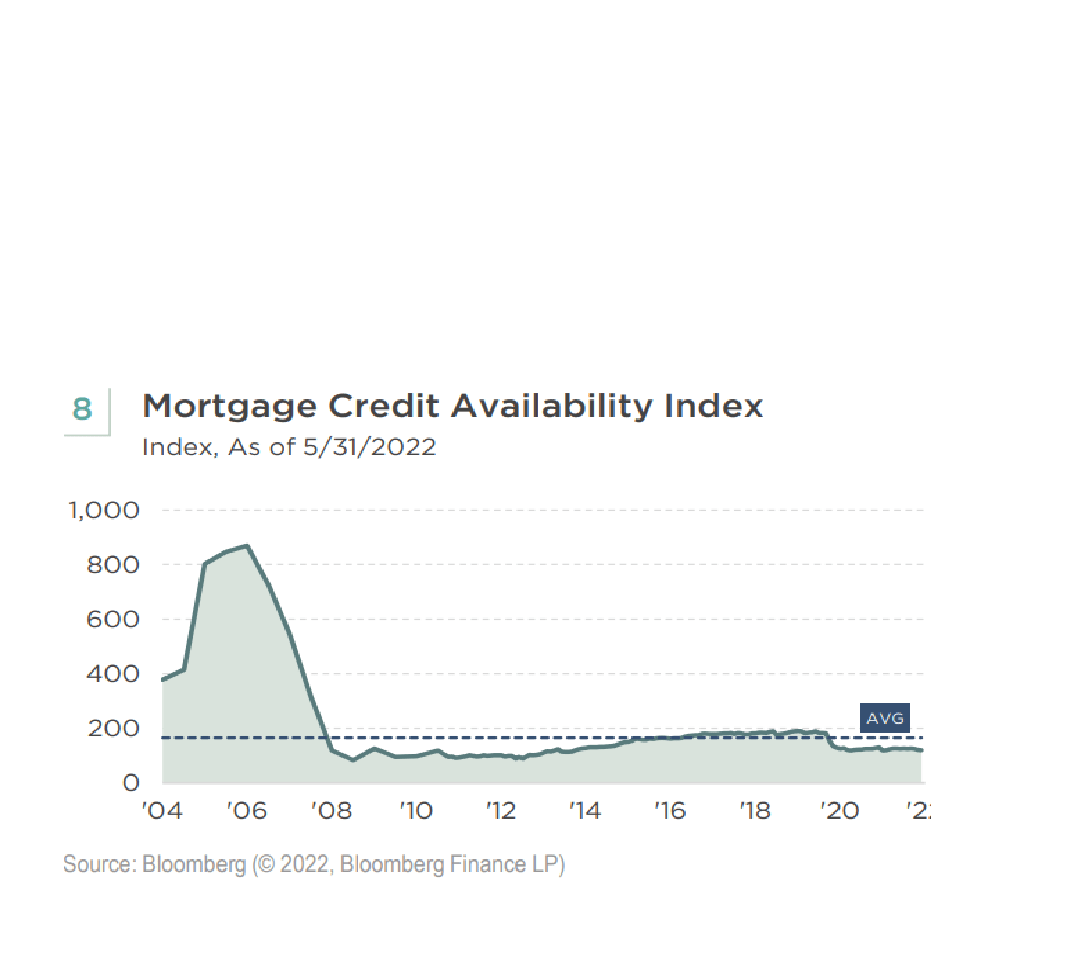
Since the go-go years of the GFC era, mortgage lending standards have become very tight, vastly reducing reckless leverage in the system. In fact, higher FICO scores and other requirements have become even tighter post-COVID. Now, 30-year mortgage loans are the mainstay of U.S. mortgage products, an important shift away from the risky affordability mortgage loans popular during the GFC era (see FIGURE 8).
Lower Interest Rate Sensitivity
According to CoreLogic data, the share of adjustable-rate mortgages (ARMs) dropped to 20% from over 60% in 2005. With the predominance of 30-year fixed rate loans, existing homeowners now have lower interest rate sensitivity, making them less prone to default when interest rates rise. In contrast, during the GFC era many borrowers defaulted when their mortgage rates adjusted to higher levels. Furthermore, current mortgage rates are still accommodative as the real, inflation-adjusted mortgage rate remains negative and near a historical low.
Increased Household Savings and Deleveraging
For many homeowners, the combination of significant housing price appreciation and mortgage borrower deleveraging has resulted in the amount of home equity exceeding mortgage debt by a large margin (see FIGURE 9). Financial obligations are at a historical low. In addition, households have accumulated an estimated $2.5 trillion of excess savings since the pandemic, a large portion of which was accrued by the middle class.
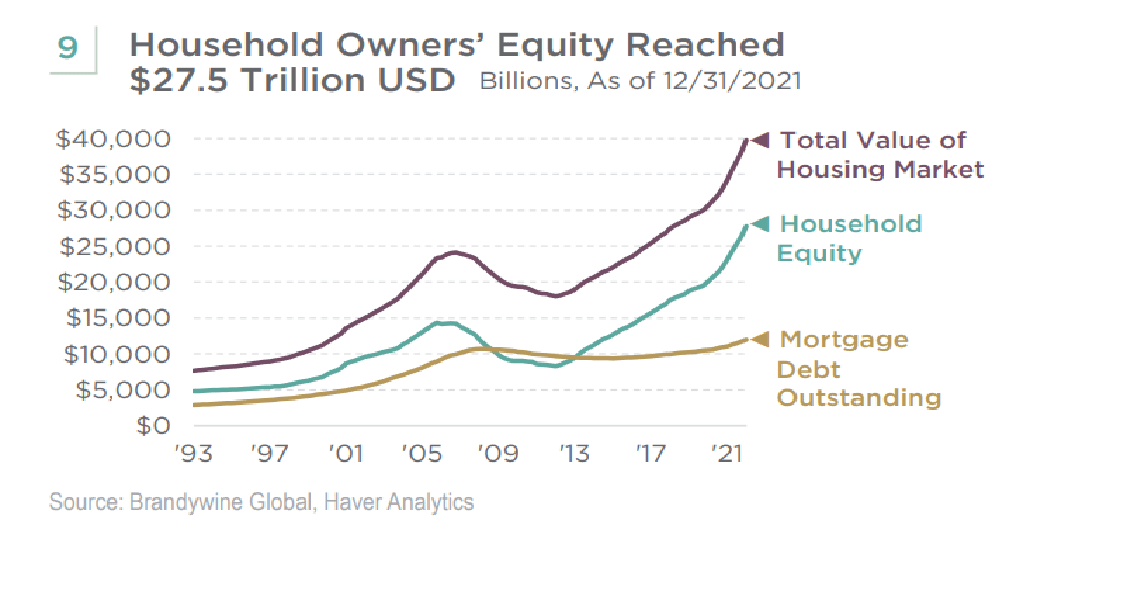
Furthermore, it is hard to turn from boom to bust without extreme leverage in the housing market. Since the GFC, mortgage borrowers delevered, and mortgage debt as a percentage of gross domestic product (GDP) declined significantly to 46% from 64% in 2009, according to the Federal Reserve Bank of New York.
U.S. Housing Compared to Other Developed Markets
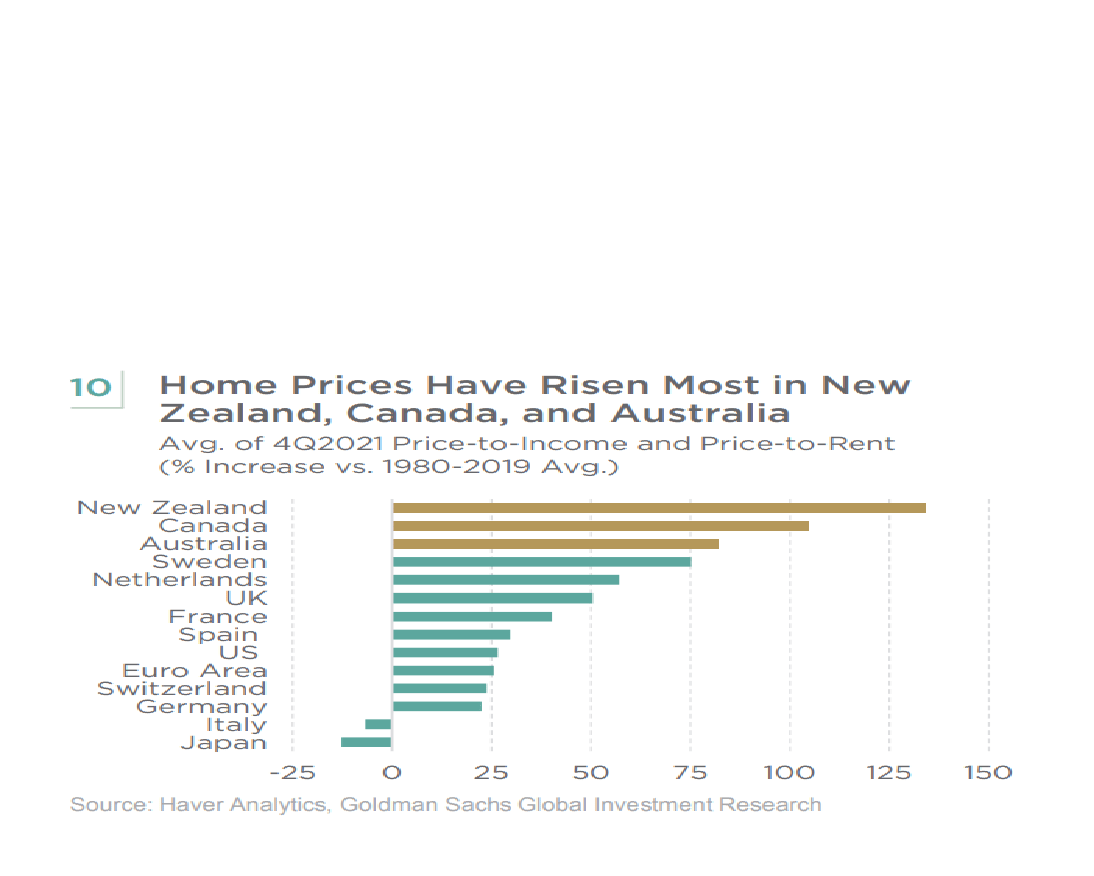
While much attention has been given to concerns over the U.S. housing market, a comparison to housing markets in other developed countries provides some interesting perspective. The U.S. market does not appear to be in a bubble relative to other developed markets. Home price valuation metrics, like price-to-income and price-to-rent, indicate that U.S. housing prices are actually much less “bubble-like” than other housing markets, including New Zealand, Canada, Australia, and Sweden (see FIGURE 10).
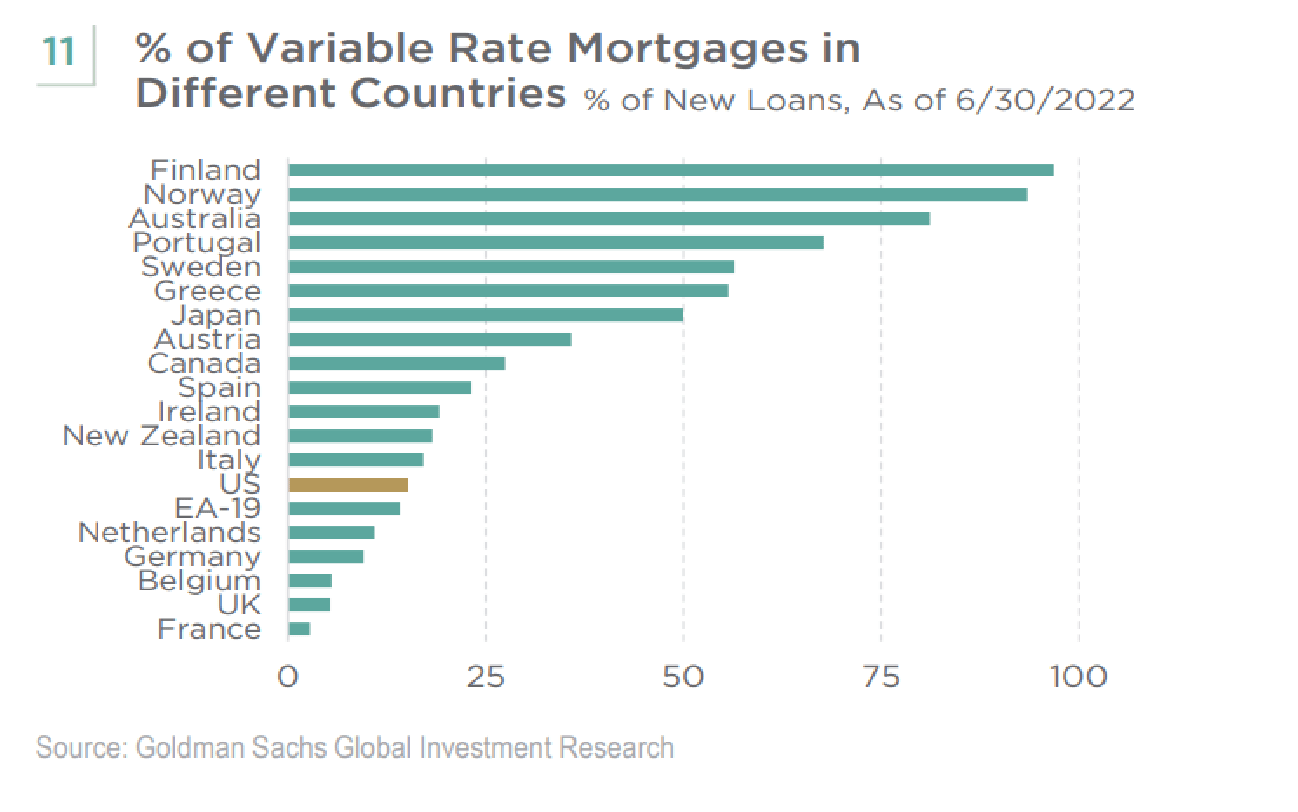
Furthermore, the percentage of variable rate mortgages in the U.S. is less than 20%, a number that compares favorably to other markets. A lower proportion of variable rate mortgages can lessen the interest rate sensitivity of the housing market relative to other countries (see FIGURE 11).
Impact of Economic Cycle on Housing
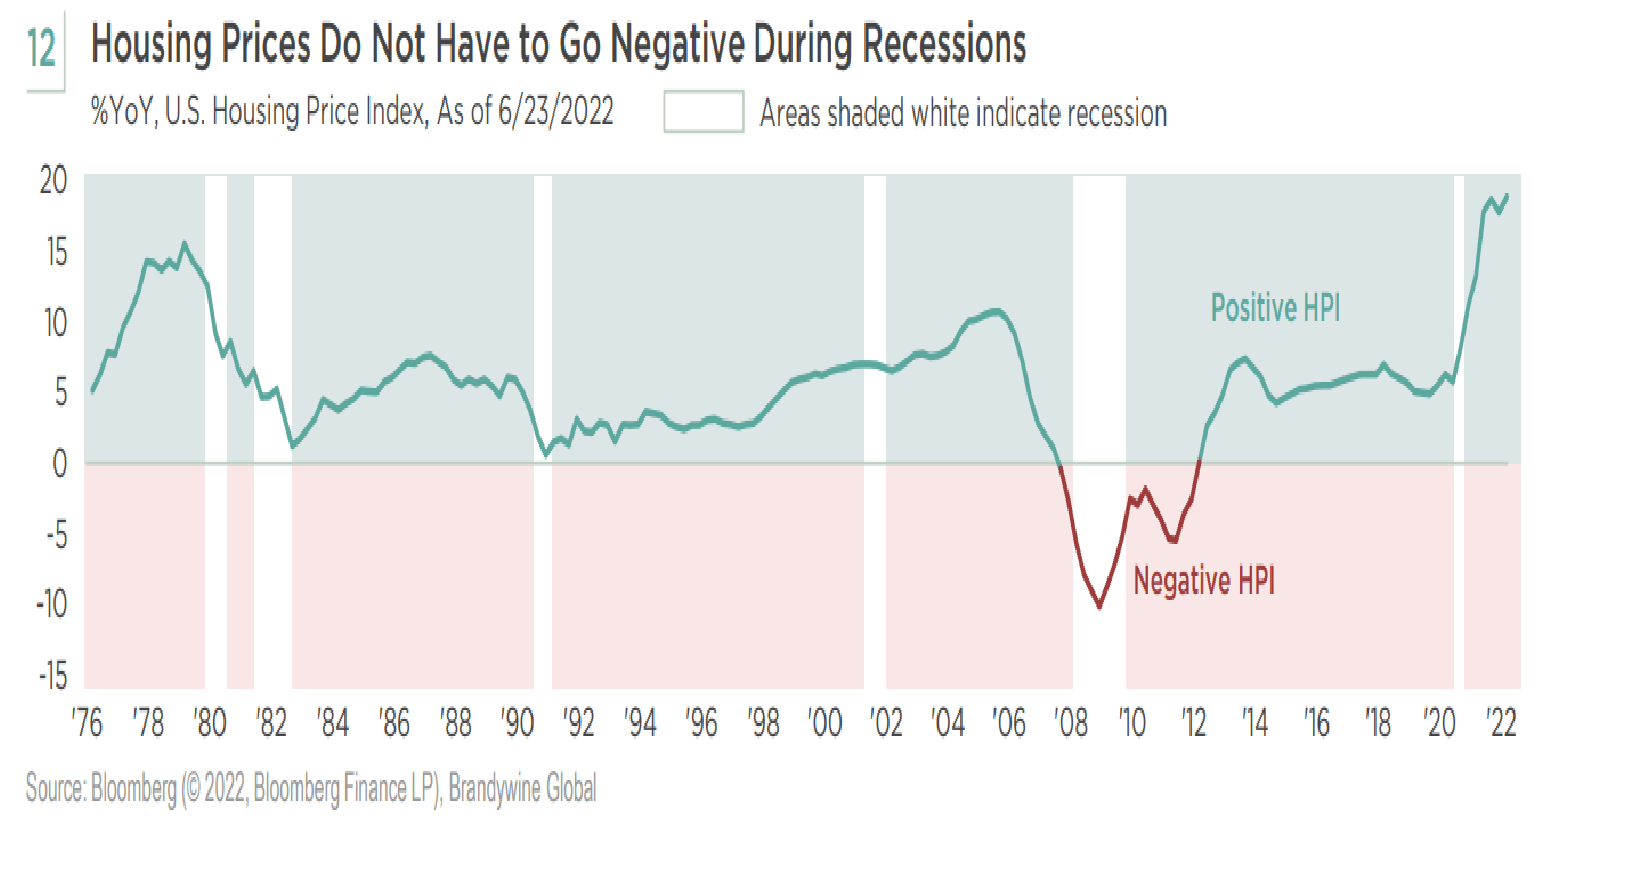
As the Fed continues to wage an epic battle against inflation, the odds of achieving a soft landing for the economy are falling. The market seems to be shifting its focus to fears of a recession away from inflation pressures. The prevailing assumption is that housing prices would collapse during an economic downturn, but can HPA stay positive during recession? Looking at past recessions, housing prices did not have to turn negative, demonstrating that a house can be both a sanctuary and good inflation hedge (see FIGURE 12).
Conclusion
Based on a variety of factors, including the favorable supply and demand dynamics, solid household balance sheets, lack of credit buildup, quality of mortgage underwriting, and differentiation from the GFC era, we believe that home price appreciation (HPA) can be better supported, even with an expected decline in home sales. In other words, a housing slowdown would likely impact sales more than prices, and a meltdown can be avoided, in our view.
If the U.S. economy were to enter a recession, we currently expect it would be mild and short lived-significantly milder than the GFC. We also expect the policy support from government-sponsored enterprises (GSE), like Fannie Mae and Freddie Mac, and other government agencies to be flexible and responsive, using the frameworks developed during the GFC and COVID recessions. We believe servicers would be proactive with loss mitigation to help affected borrowers.
Housing is not an isolated market. Its future price action will depend on the Fed, severity of the recession, and stickiness of inflation. As the share of homes for sale with price cuts is climbing in once-hot local real estate markets, the high-flying HPA is likely to experience some type of decline. A housing slowdown can exert a negative impulse on economic growth, which the Fed may perceive as a healthy adjustment. Therefore, the Fed may refrain from interest rate cuts unless a severe recession is triggered. However, a recession would likely be met with lower 10-year Treasury and mortgage rates. In this scenario, we believe we can still see positive HPA in 2022, followed by flat or slightly negative HPA in 2023 and 2024. If the U.S. economy becomes stuck with stubborn stagflation and more entrenched inflation, the Fed will have to prolong its inflation fight, resulting in higher rates for longer and moderately more negative HPA in 2023 and 2024.
Editor’s Note: The summary bullets for this article were chosen by Seeking Alpha editors.
Be the first to comment