Alexander Schmitz/iStock via Getty Images
By Rupert Watts
Last week, the S&P 500® officially entered a bear market, dropping more than 20% from its record close in January. However, not all equity indices suffered comparable losses, and one such example is the S&P 500 Low Volatility High Dividend Index. In fact, this index has outperformed by a wide margin so far in 2022.
Exhibit 1 (S&P Dow Jones Indices LLC)
This may come as no surprise since this index combines two strategies that have individually beaten the S&P 500 YTD. High dividend strategies have been popular in the recent market environment of high inflation and rising interest rates, where current income and shorter duration stocks are considered more favorable by some investors. Similarly, low volatility stocks have outperformed due to their defensive qualities during increased market uncertainty.
Methodology
This index applies a simple, two-step constituent screening methodology to capture the benefit of high dividend and low volatility strategies. First, the index selects the top 75 highest-yielding stocks in the S&P 500 based on their 12-month trailing dividend yield. Then, it narrows those down to the 50 stocks with the lowest realized volatility over the past 252 trading days. The remaining stocks are then weighted by the trailing 12-month dividend yield.
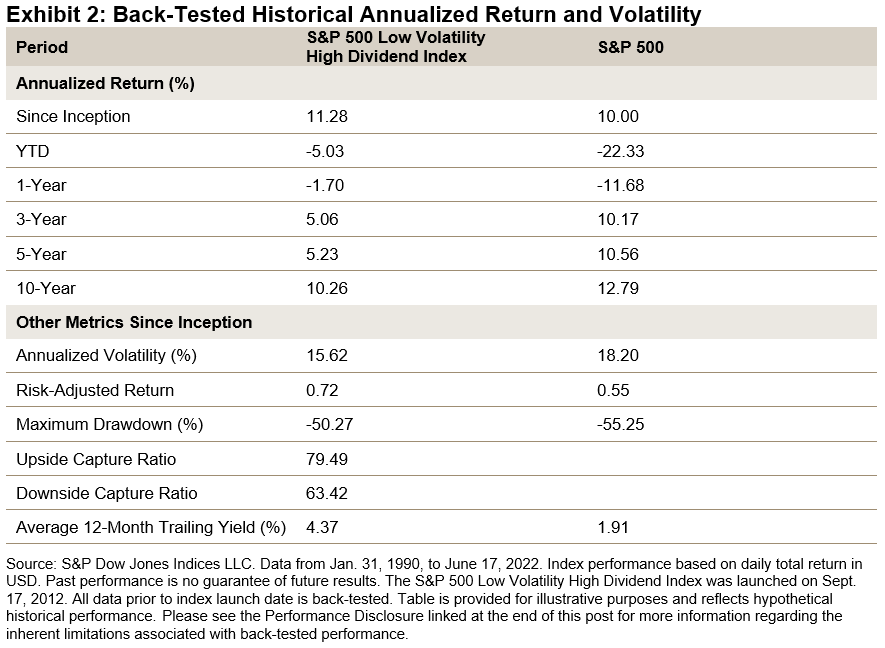
The index has delivered higher absolute and risk-adjusted returns than the S&P 500 since January 1990. Furthermore, it has had a lower downside capture ratio than similar high-yielding strategies since the low volatility screen acts as a quality measure to avoid high-yield stocks with sharp price drops.
Exhibit 2 (S&P Dow Jones Indices LLC)
Construction Philosophy
This index was built on the premise that high-yielding stocks tend to outperform the broad market in the long run. Our research team published a paper in 2019 showing just that. However, it also showed that this outperformance came at the cost of higher volatility and lower risk-adjusted returns.
The paper went on to argue that this high volatility could be attributed to the inclusion of high-yield stocks with a depressed price. Furthermore, it offered a potential remedy: a low volatility screen to help avoid high-risk companies.
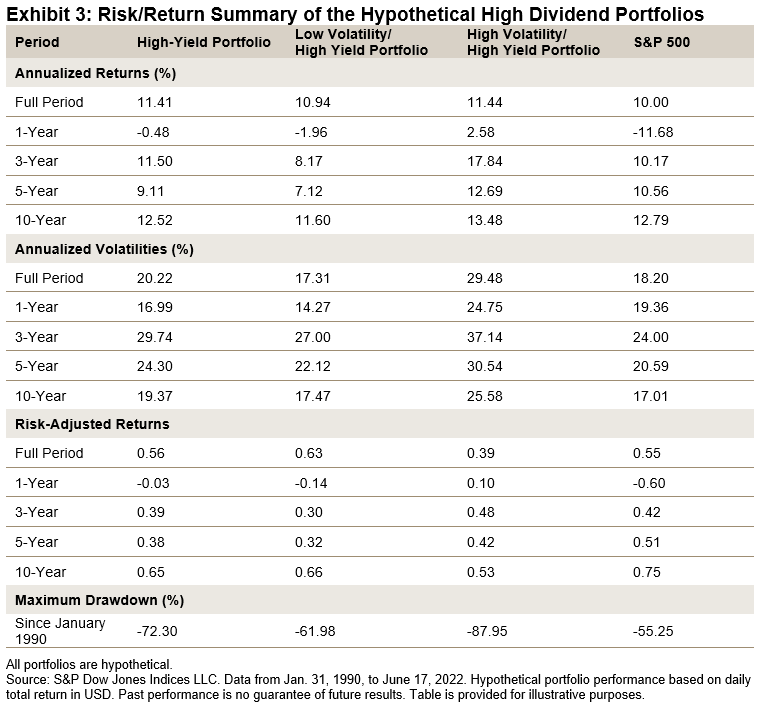
This is amply demonstrated in Exhibit 3, which shows the performance of the following three hypothetical portfolios that are equally weighted.
- High-yield portfolio: 75 stocks from the S&P 500 with the highest dividend yield
- Low volatility/high-yield portfolio: 50 lowest volatility stocks selected from the high-yield portfolio
- High volatility/high-yield portfolio: 25 highest volatility stocks selected from the high-yield portfolio
Exhibit 3 (S&P Dow Jones Indices LLC)
Since January 1990, the high-yield portfolio outperformed the S&P 500 by 1.4% annualized, but with higher volatility and a larger maximum drawdown. The low volatility/high-yield portfolio achieved a similar annualized return, but with 14.4% less volatility and a smaller maximum drawdown.
Finally, the high volatility/high-yield portfolio was much more volatile, with the lowest risk-adjusted return and largest maximum drawdown. Thus, out of these three hypothetical portfolios, the low volatility/high-yield portfolio delivered the highest risk-adjusted return and had the most pronounced maximum drawdown reduction.
Conclusion
For market participants looking for outperformance and a competitive yield with lower risk than other comparable high-yielding strategies, the S&P 500 Low Volatility High Dividend Index might be a worthy consideration.
Disclosure: Copyright © 2022 S&P Dow Jones Indices LLC, a division of S&P Global. All rights reserved. This material is reproduced with the prior written consent of S&P DJI. For more information on S&P DJI please visit www.spdji.com. For full terms of use and disclosures please visit Terms of Use.
Editor’s Note: The summary bullets for this article were chosen by Seeking Alpha editors.


Be the first to comment